
ABSTRACT
Hormone-dependent cancers and overweight/obesity are not necessarily linked but might have similar underlying causes, such as circadian disruption, lack of physical activity, and unhealthy nutrition. Several empirical studies also attribute the rise in these types of morbidity to vitamin D deficiency, linked in turn to insufficient sunlight exposure. Other studies place an emphasis on melatonin (MLT) hormone suppression, associated with artificial light at night (ALAN) exposure. Yet no studies, carried out to date, have attempted to determine which of these environmental risk factors is associated stronger with the morbidity types in question. In this study, we aim to narrow this knowledge gap by analyzing data available for 100+ countries worldwide, while controlling ALAN and solar radiation exposure estimates by several potential confounders, such as GDPpc, GINI inequality index and unhealthy food consumption. As the study reveals, all the morbidity types under analysis are significantly and positively associated with ALAN exposure estimates (p < 0.05), while solar radiation appears to be significantly associated with prostate cancer rates only (p < 0.05), but not with breast cancer or overweight/obesity rates (p > 0.1). To the best of our knowledge, this study is the first that separates the effects of ALAN and daylight exposures on the abovementioned types of morbidity.
Introduction
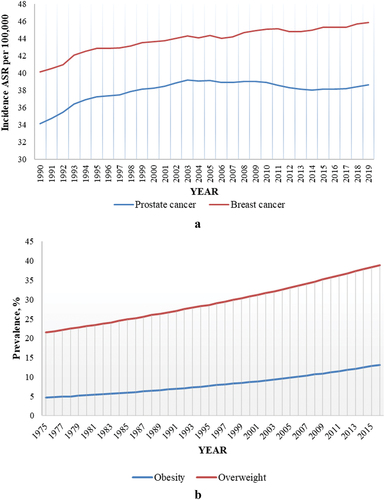
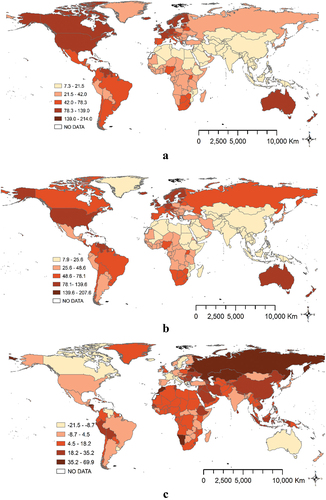
Rates of hormone-dependent cancers, such as breast cancer (BC) in women and prostate cancer (PC) in men, and overweight and obesity in both genders are on the rise worldwide (see ). Although these types of morbidity are not necessarily linked, they might have similar underlying causes, such as aging (Cooper et al. Citation2021; Sung et al. Citation2021; WHO Citation2022a), lack of physical activity (Friedenreich and Orenstein Citation2002; Rippe and Hess Citation1998), and unhealthy food consumption (Barsouk et al. Citation2020; Behrens et al. Citation2018; Mohammadbeigi et al. Citation2018).
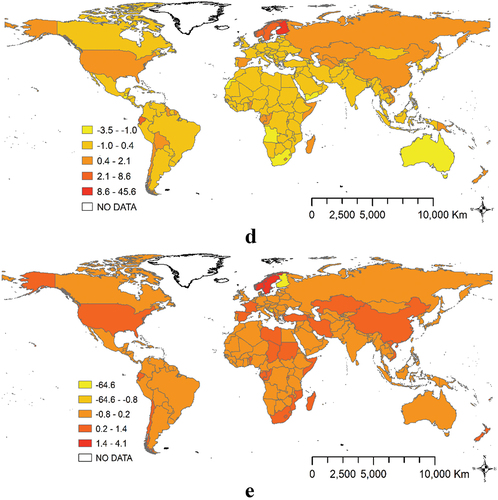
Figure 1. Global changes in breast and prostate cancer incidence ASRs (a) and overweight/obesity prevalence rates, % (b).
Empirical studies have also linked these types of morbidity to several environmental risk factors, such as insufficient sunlight exposure, linked, in turn, to vitamin D deficiency (Alfredsson et al. Citation2020; Peterlik et al. Citation2009), while other studies emphasize the effect of prolonged exposure to artificial light at night (ALAN) (Haim and Portnov Citation2013; Park et al. Citation2019).
Vitamin D is a seco-steroidal prohormone, produced endogenously when sunlight strikes the skin and triggers vitamin D synthesis (Jeon and Shin Citation2018). The synthesis of this hormone plays an important role in the body’s functioning, by affecting calcium and phosphor homeostasis (Bellavia et al. Citation2016), reducing hypertension (Pilz et al. Citation2009), improving immune function (Ponsonby et al. Citation2005) and lowering the risk of inflammation (Agrawal and Yin Citation2014).
In an attempt to explain the observed rise in the above types of morbidity, the authors of several studies place an emphasis on the impact of ALAN, associated with melatonin (MLT) suppression and circadian disruption (Reiter et al. Citation2007; Smith et al. Citation2004; Stevens et al. Citation2014). The main mechanisms behind this association are disruption of the biological clock function (Haim and Portnov Citation2013; Stevens and Rea Citation2001), and inhibition of the MLT hormone secretion due to ALAN exposure (Blask et al. Citation2005; Haim and Portnov Citation2013).
According to Reiter et al. (Citation2007), the MLT hormone has antioxidative properties, and as a result, suppression of the nocturnal MLT production changes the estrogen receptor affinity and increases susceptibility to different diseases, including hormone-dependent cancers, such as BC and PC (Blask et al. Citation2005; Figueiro Citation2017; Haim and Portnov Citation2013; Momenimovahed and Salehiniya Citation2019). Recent empirical studies lend support to such a possibility, albeit most of the evidence comes from ecological and semi-ecological research (Rybnikova et al. Citation2015, Citation2017).
It should be noted, however, that sunlight and ALAN are interlinked, as the lack of sunlight is often compensated by ALAN, especially in northern latitudes (Haim and Portnov Citation2013). Yet, which of the abovementioned environmental risk factors, i.e., excessive ALAN exposure, potentially resulting in circadian disruption and MLT suppression, or insufficient exposure to sunlight, resulting in vitamin D-deficiency, is associated stronger with human morbidity remains largely unclear, as, to the best of our knowledge, no study, carried out to date, has attempted to separate the effect of these factors on different types of human morbidity. The present study aims to narrow this knowledge gap, by contrasting sunlight and ALAN exposure data with BC and PC morbidity and overweight/obesity data available for 100+ countries worldwide, while controlling for potential confounders, such as per capita GDP, GINI inequality index, and unhealthy food intake.
The paper starts with a summary of previous studies linking vitamin D deficiency and excessive exposure to ALAN with different types of morbidity. A description of the study method and data sources follows this introduction. Next, the results of the analysis are introduced and the required public policy responses are discussed.
Summary of background studies
Vitamin D deficiency and its potential health effects
Several empirical studies investigated the association between vitamin D deficiency and specific health effects. Thus, Yao et al. (Citation2015) compared vitamin D levels in 3867 obese participants and 9342 healthy individuals, showing a significant difference in the prevalence of vitamin D deficiency among obesity and control groups, with the odds ratio (OR) being equal to 3.43 (95% CI = 2.33–5.06). In another study, Syed et al. (Citation2019) enrolled 117 diabetes type 2 patients, whose 25-OH-Vit D levels were calculated. Of this number, 83 patients (76.14%) were found to be either vitamin D-deficient (60.6%) or vitamin D-insufficient (15.6%), while only 26 patients (23.9%) were vitamin D sufficient. The study also revealed a statistically significant difference in the vitamin D levels between diabetics and healthy subjects (p = 0.015), while a statistically significant association between vitamin D levels and BMI was also found (p = 0.018).
According to another study by Der et al. (Citation2014), who examined the medical records of army veterans diagnosed with PC in the southeastern part of the US between October 1, 1999, and April 30, 2012, patients with vitamin D deficiency showed significantly smaller ORs of survival. In a separate study, Park et al. (Citation2015) conducted a large case–control study in Korean women, comparing serum-25 hydroxyvitamin D 25(OH)D levels in 3634 BC patients and 17 133 controls. As the study revealed, women, who had vitamin D levels of less than 20 ng/mL, exhibited a 27% increase in the risk of developing BC, as compared to women with vitamin D levels of 20 ng/mL and above.
ALAN exposure and its known health effects
In two separate studies, Rybnikova et al. (Citation2015, Citation2017) examined the association between BC and PC incidence and ALAN exposure estimated using data from 180 countries worldwide. The researchers compared age-standardized rates (ASRs) of these cancers with multi-annual ALAN measurements performed by nighttime satellites and considered potentially different latency periods. After the whole set of countries was disaggregated into geographic clusters of countries with similar development levels, the results showed a positive association between ASRs of both types of cancer and ALAN exposure estimates, lagged by a 10-year period.
The association between ALAN and obesity forms a separate strand of research that reveals the association between ALAN exposure and excessive body mass in humans. The biological mechanisms behind such an association include the inhibition of MLT production due to ALAN exposure (Garaulet et al. Citation2010) and suppression of MLT rhythmicity, which disrupts metabolic function and may lead to obesity (Kennaway et al. Citation2002). Another mechanism that links ALAN exposure to obesity is sleep disorders that influence circadian rhythm through changes in carbohydrate metabolism and endocrine function (Laposky et al. Citation2008). ALAN exposure may also lead to changes in eating behavior, leading to obesity, due to shifting the time of food intake from daytime to the nighttime phase (Arble et al. Citation2009; Fonken et al. Citation2010; Rybnikova et al. Citation2016).
Thus, in a recent study, Park et al. (Citation2019) examined the association between exposure to ALAN while sleeping with the risk of obesity in women aged 35 to 74 yo. The research included 43 722 healthy, unpregnant women with no background diseases, such as cancer or CVD, who did not work night shifts and were not daytime sleepers. Several parameters, such as height, weight, hip and waist circumference, were examined, and BMI values were calculated. The analysis showed that women, who were more exposed to ALAN, tended to have higher mean BMI, larger waist circumference, waist-to-hip ratio, and waist-to-height ratio.
In a separate study, Rybnikova et al. (Citation2016) examined the association between ALAN and female and male overweight and obesity prevalence rates in 80 countries worldwide using obesity and overweight data available for 2012. The ambient ALAN exposures were estimated using the U.S. Defense Meteorological Satellite Program (US-DMSP) data. The analysis showed a positive relationship between ALAN and overweight/obesity in both men and women (p < 0.05).
Research hypothesis
As well established, vitamin D deficiency, on the one hand, and overweight/obesity and hormone-dependent cancers, on the other, are associated (see inter alia, Der et al. Citation2014; Park et al. Citation2015; Syed et al. Citation2019; Yao et al. Citation2015). In other studies, researchers demonstrate the association between ALAN exposure and the above-mentioned types of morbidity (Park et al. Citation2019; Rybnikova et al. Citation2015, Citation2016, Citation2017). However, what factor – that is, either sunlight or ALAN exposure – helps to explain better the country-wide incidence of the abovementioned morbidity types is largely unclear. Therefore, we hypothesize:
H0:
Both types of the environmental exposures in question affect the morbidity types under analysis, either equally or with similar strength.
H1:
One of the abovementioned exposure factors – i.e., either ALAN or solar radiation – has a stronger impact on the morbidity types in question than the other, and the effect of this factor remains statistically significant upon controlling for potential confounders, such as GDPpc, societal inequality, unhealthy food consumption, and the counterpart factor, that is, either ALAN or solar radiation.
Data sources and research method
Obesity and overweight data
Data on the adult overweight and obesity rates for individual countries worldwide were obtained as ASRs from the World Health Organization database (WHO Citation2022b), separately for females and males. In the database, these data are available for the period between 1975 and 2016 for 196 countries worldwide. The prevalence rates of obesity were calculated as BMI ≥ 30, while overweight rates were calculated for 25 ≤ BMI <30, both as % of a country’s total adult population.
Cancer data
BC and PC incidence data for the study were obtained from the Global Health Data Exchange database (GHD Citation2019) as ASRs. In this database, BP and PC data are available for 204 countries worldwide, for the period between 1990 and 2016.
Solar radiation
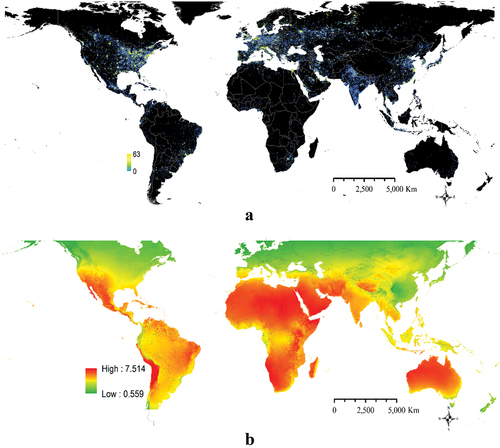
Data on solar radiation were obtained from the Global Solar Atlas database (Agency et al. Citation2021). Because in large countries, actual levels of solar radiation tend to differ across different geographic areas and localities (see ), the following normalization formula, proposed by Kloog et al. (Citation2008), was used to calculate the population-weighted solar radiation exposure rates:
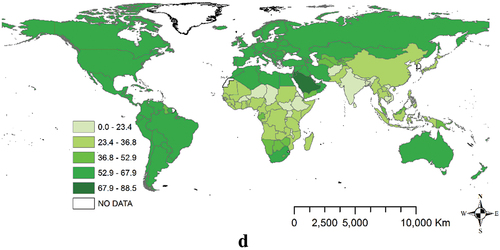
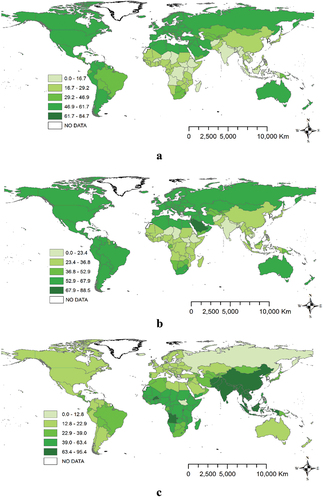
Figure 2. ALAN emissions and solar radiation worldwide.
where and
are population size of and solar radiation level in location j (that is, a map’s pixel) of country i, respectively.
Using this formula makes it possible to calculate country-wide averages of solar radiation exposure by giving greater weights to more populated areas and smaller weights to less populated areas. For the calculation, data on population distribution worldwide were obtained from the LandScan Database (Rose et al. Citation2021), where they are reported as population counts for 1 × 1 km grid cells. The calculation was performed in the ArcGISTM10.x software, using its zonal statistics tool (Esri Citation2016).
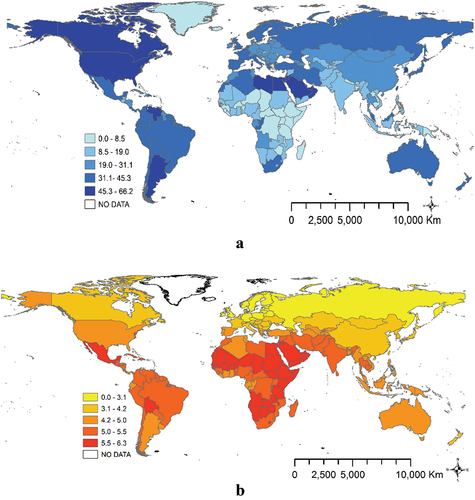
An example of population-weighted solar radiation levels by countries worldwide for the year 2016, calculated using Formula (1), is shown in , while solar radiation maps for other years and inter-year changes are reported in Appendix A (see ).
Figure 3. Population-weighted ALAN and solar radiation levels by countries worldwide.
ALAN data
ALAN data for the present analysis were downloaded from the U.S. Defense Meteorological Satellite Program (US-DMSP) database for the period between 1996/97 and 2013, and, after 2013, from the Suomi National Polar Partnership Visible Infrared Imaging Radiometer Suite (SNPP-VIIRS) website (NOAA Citation2020). An example of the ALAN data used in the study is shown in .
For the analysis, the ALAN data available for the year 2006 were matched with the year-2016 cancer data, while ALAN data for the year 2007 were matched with cancer data for the year-2017 and so on, to account for 10-year latency in BC and PC cancer incidence (Etzioni et al. Citation1998; Howard Citation2012). Concurrently, for obesity, whose latency is expected to be shorter, i.e., ~1–2 years (cf., e.g., Rybnikova et al. Citation2016), ALAN data for the year 2004 were matched with the year 2006 obesity/overweight data, and so on. As with solar radiation (see Subsection 4.3), a normalization formula similar to (1) was used to account for local geographic patterns of population distribution in individual countries:
where and
are population size and average ALAN emission from pixel j of country i, respectively.
As with solar radiation, the calculations were performed in the ArcGISTM10.x software, using its zonal statistics tool (Esri Citation2016). An example of population-weighted ALAN levels by countries worldwide for 2014, calculated using Formula (2) is shown in , while ALAN maps for other years and inter-year change are reported in Appendix B (see
Socio-economic confounders
Information on several country-level socio-economic confounders was obtained from the following sources:
Information on the average per capita GDP (in current US$) and GINI social inequality index was obtained from the World Bank database (WB Citation2022; WB and OECD Citation2018), where these data are available for the period between 1960 and 2019 for 257 countries worldwide (GDPpc) and 175 countries (GINI), respectively.
Information on healthy/unhealthy food consumption was obtained from the UN Food and Agriculture Organization (Ritchie and Roser Citation2017). In this database, oils, fats and sugar are classified as unhealthy, while cereals and grains, pulses, starchy roots, fruit and vegetables are classified as healthy (Bruso Citation2018). In the database, the food consumption data are available for the period between 1961 and 2019 for 166 countries worldwide.
As demonstrated in previous studies, diet and nutrition are important for maintaining good health throughout the life course (GHD Citation2019; Micha et al. Citation2017; Nishida et al. Citation2004; Vieira et al. Citation2013). The role of nutrition as a major determinant of chronic non-communicable diseases, such as cardio-metabolic diseases, obesity, type 2 diabetes, cancer, dental diseases, and osteoporosis is also well established (Micha et al. Citation2017; Nishida et al. Citation2004; WHO Citation2003, Citation2021). Concurrently, per capita GDP (GDPpc) is an important indicator of population wealth, potentially reflecting differences in lifestyle, in general, and local differences in diet and healthcare quality. In particular, in several previous studies, GDPpc was found to be associated with breast and prostate cancers (Kelsey and Gammon Citation1991; Rybnikova et al. Citation2015, Citation2017) and with average BMI (Kark and Rasmussen Citation2005; Miech et al. Citation2006). Due to these considerations, the variables in question were included into the present analysis as potential confounders. Descriptive statistics of the research variables are reported in .
Table 1. Descriptive statistics of the research variables.
Statistical analysis
The collected data (see Subsections 4.1-4.5) were co-integrated and analyzed using multiple-regression tools (“Linear Regression -IBM Documentation” Citationn.d.). To account for disease latency (see Subsection 4.4), for BC and PC, 11 valid annual observation series were generated, spanning from 2006 to 2016 and containing 131 countries each (i.e., an 11 × 131 matrix). Concurrently, in the obesity/overweight data set, longer series with 19 annual observations were generated for 131 countries (from 1998 to 2016), considering a shorter ALAN latency period expected for these health conditions (see Subsection 4.4). Since solar radiation changes only slightly from year to year (Lindsey Citation2009), there was no need to lag solar radiation exposure estimates for either cancer or overweight/obesity.
The following generic equation was used to measure the strength of associations between the health effects under analysis and their potential determinants:
where HEi,j,k is the health effect under analysis (k = 1 … 4 - either overweight, obesity, BC, or PC) observed in country i during year j; n = time lag; SOC = vector of country-level socio-economic confounders; REG = vector of regional dummies that reflects regional commonalities, not captured by the variables directly controlled by the analysis, that is, GDPpc, societal inequality, and unhealthy food consumption; ALANij is population weighed nighttime light intensity in country i during period j; SOLi is population weighed solar radiation intensity in country i; b0, b1, b2, β, and λ are regression coefficients; and is a random error term.
If our research hypothesis (see Section 3) is correct, only one of the abovementioned environmental factors – that is, either ALAN or solar radiation – should emerge, upon controlling for potential confounders, as a statistically significant predictor of the morbidity types under analysis at the accepted statistical significance level (p < 0.05).
Results
General trends
The worldwide geographic patterns of the morbidity types under analysis are illustrated in , separately for BC (), PC (), obesity (), and overweight ().
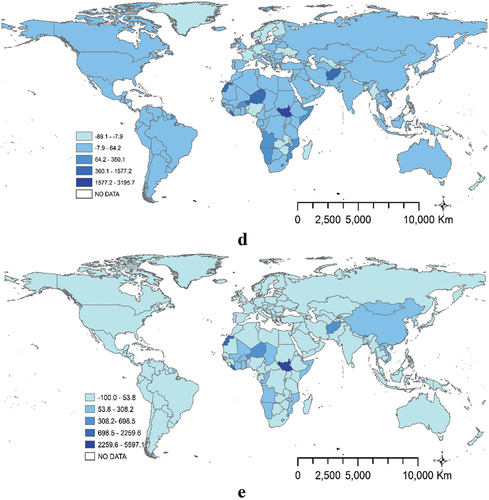
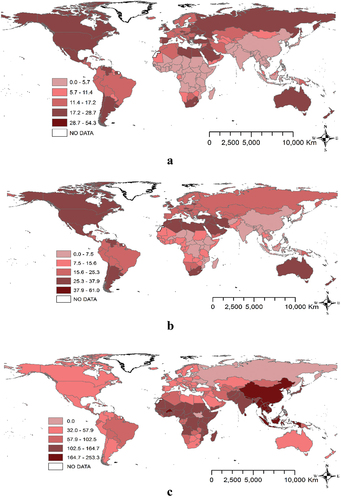
Figure 4. Morbidity rates by countries worldwide in 2016.
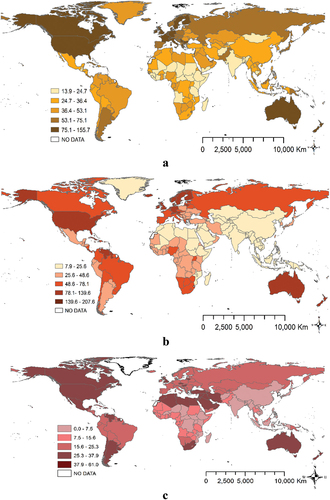
Figure 4. (Continued).
As evidenced in , the highest ASRs of BC are found in North America, Europe, Australia, and Oceania (78.27–111.71 cases per 100,000), while the lowest BC ASRs are observed in Central America, Africa, and Southeast Asia (15.37–26.16 cases per 100,000). Similar geographic patterns are also exhibited by PC, with the highest rates of this disease found in the United States, Northern Europe, Australia, and Oceania (85.79–122.90 cases per 100,000) and its lowest rates are recorded in Central America, Africa, the Middle East and most of Asia (7.96–25.59 cases per 100,000) (see ).
Characteristically, the geographic patterns of overweight and obesity are somewhat different, with the highest rates of these health conditions found in North and South America, the Middle East, North Africa, Australia, and Oceania (26–47% for obesity, and 53.3–77.6% for overweight, respectively). Concurrently, the lowest rates of these health conditions are observed in Central Africa and Southeast Asia: 2–7% for obesity and 18.3–23.3% for overweight (see ).
As further demonstrated in , the geographic patterns of BC and ALAN exhibit considerable similarities. In particular, the highest BC rates () are found in the regions, where ALAN levels are highest (). Concurrently, the places with the highest levels of solar radiation (e.g., Central America and Central Africa; see ) typically exhibit relatively low BC rates (). This indicates that both factors (i.e., ALAN and solar radiation) appear to be associated with BC, albeit the directions of these associations might differ being positive for ALAN-BC and negativefor solar radiation-BC.
With a notable exception of the Middle East and Northern Africa, the geographic patterns of ALAN () and PC () are also similar. In particular, the highest PC rates are observed in North America, Russia, and Northern Europe, that is, in the regions where solar radiation is relatively scant (see ). As it is also demonstrated in and , the geographic patterns of overweight and obesity are similar to those of ALAN, with these health conditions being more common in the regions with high ALAN exposures, viz., North and South America, the Middle East, North Africa, Australia, and Oceania (see ).
Regression analysis
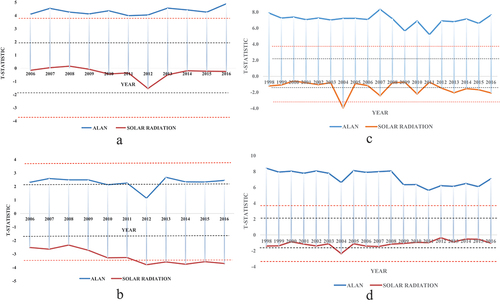
The full set of models estimated for BC, PC, overweight, and obesity is reported in Appendix G (see ). Concurrently, changes in the t-statistics of the ALAN and solar radiation variables in the models, estimated for different years between 1998 and 2016 (overweight and obesity) and for 2006–2016 (BC and PC), are reported in .
Figure 5. T-statistics of the ALAN and solar radiation variables, estimated for separate years between 1998 and 2016 for different types of morbidity.
As evidenced in , the estimated models provide a reasonably good fit, with the coefficients of determination ranging between R2 = 0.639 (PC in the year 2012) and R2 = 0.844 (BC in the year 2007). The estimated models also exhibit a high degree of generality, with F-statistics ranging from 29.475 (p < 0.01) in the model estimated for obesity (Appendix G ) to 82.231 (p < 0.01) in the model estimated for BC (Appendix G ) (p < 0.01).
Notably, in all the models estimated for BC, the main factors affecting this type of morbidity are ALAN (+) and GDPpc (+). In several models, unhealthy food consumption also emerges as a positive predictor of BC at a 0.05 probability level (see Appendix G ). Concurrently, significant determinants of PC in most models are as follows: ALAN (+), GDPpc (+), GINI (+) and solar radiation (-) (p < 0.05), while the factors significantly associated with obesity and overweight are: ALAN (+), GDPpc(-) and unhealthy food consumption (+) (p < 0.05) (see Appendix G ).
As further evidenced in , ALAN has a statistically significant and positive effect on all types of morbidity under analysis (p < 0.05), and this influence does not change substantially over the years. Concurrently, when introduced jointly with ALAN, the solar radiation variable has a significant negative effect on PC only (p < 0.05), while its effects on BC, overweight and obesity are insignificant (p > 0.1).
Factor contribution test
The relative contribution of different predictors to obesity, overweight, BC and PC models, estimated by a consequent variable ablation, is reported in . The test was run using the best-performing models, estimated for each morbidity type based on its R2, that is, Models 1, 22, 44, and 55 from , and G14. During the test, each variable was removed from the model consequently, and change in the coefficient of determination, R2, was monitored. Then, the variable in question was returned to the model and another variable was omitted, and so on.
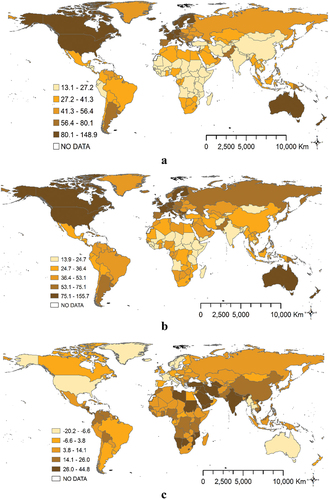
Figure 6. Relative contribution of different factors to obesity (a), overweight (b), BC (c), and PC (d).
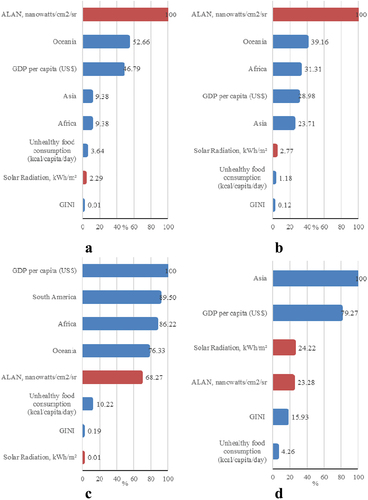
As evidenced in , ALAN contributes most to the obesity and overweight models, while solar radiation is found to have a minor contribution to obesity () and overweight (). Concurrently, as shown in , GDPpc, South America, Africa, and Oceania are the main contributors to BC, followed by ALAN, unhealthy food consumption, and GINI. Notably, solar radiation contributes the least to BC, while Asia and GDPpc contribute the most to PC (), followed by solar radiation and ALAN.
Discussion
Exposure to ALAN affects the internal cyclicity that occurs in the SCN cells (Aulinas Citation2019; Haim and Portnov Citation2013). Moreover, it affects MLT secretion through different pathways. The first – visual – pathway leads from the eye retina to the occipital region of the brain that produces a visual sensation (Rea et al. Citation2005; Van Bommel Citation2006), while the second (more recently discovered) – non-visual pathway – is pathway, in which the radiant energy travels to other parts of the brain where no visual sensation is produced (Zaidi et al. Citation2007). According to Reiter et al. (Citation2007), MLT has antioxidative properties. As a result, suppression of MLT affects the biological function resulting in changing estrogen receptor affinity and increasing susceptibility to different diseases, including hormone-dependent cancers, such as BC and PC (Blask et al. Citation2005; Figueiro Citation2017; Haim and Portnov Citation2013). Moreover, ALAN is associated with obesity (Rybnikova et al. Citation2016); fatigue (Martin et al. Citation2012); poor sleep quality (Gabinet and Portnov Citation2021, Citation2022; Smolensky et al. Citation2015), and general stress (Haim and Portnov Citation2013). Concurrently, vitamin D, produced in the skin in response to exposure to sunlight radiation (Jeon and Shin Citation2018) and metabolized in the liver and other tissues (Bikle Citation2000), improves the immune function (Ponsonby et al. Citation2005) and lowers the risk of inflammation (Agrawal and Yin Citation2014). As revealed by previous studies, the lack of vitamin D is associated with obesity (Yao et al. Citation2015); diabetes (Hussain Gilani et al. Citation2019); PC (Xie et al. Citation2017), and BC (Pineda-Moncusí et al. Citation2018). However, which of these explanations is more valid remains largely unclear, as in previous studies, the effects of ALAN and sunlight exposure on human health have been, most often, investigated separately, that is, independently from each other.
In the present study, we attempted to narrow this knowledge gap, by contrasting sunlight-ALAN exposure estimates with cancer morbidity and overweight/obesity data available for 131 countries worldwide, while controlling for potential confounders, including GDPPC, GINI inequality index, and unhealthy food intake. Data for the study were obtained from multiple sources, including WHO (Citation2022b), NOAA (Citation2020), World Bank (WB Citation2022; WB and OECD Citation2018), and others.
In order to account for geographic patterns of population distribution, a population weighting procedure was applied to ALAN and solar radiation data, enabling us to assign greater weights to locations with larger population counts. The cointegrated data were mapped and analyzed using multiple statistical tools. To account for disease latency, ALAN lags for BC and PC were set to 10 years, following the estimates reported in Rybnikova et al. (Citation2015, Citation2017). Concurrently, ALAN data for obesity and overweight were lagged by 2 years, considering a shorter latency period is expected for these health conditions.
As the study revealed, the highest ASRs of BC are found in North America, Europe, Australia, and Oceania, while the lowest BC ASRs are observed in Central America, Africa, and Southeast Asia. Similar geographic patterns are also exhibited by PC, with the highest rates of this disease found in the United States, Northern Europe, Australia, and Oceania and its lowest rates recorded in Central America, Africa, the Middle East, and most of Asia. The geographic patterns of overweight and obesity are found to be somewhat different, with their highest rates found in North and South America, the Middle East, North Africa, Australia, and Oceania, while their lowest rates are observed in Central Africa and Southeast Asia.
As further revealed in the analysis, the geographic patterns of BC/PC and ALAN exhibit considerable similarities, with the highest BC and PC rates observed in the regions, where ALAN levels are highest. The geographic patterns of overweight and obesity are also similar to those of ALAN, with these health conditions being more common in the regions with high ALAN exposures, viz., North and South America, the Middle East, North Africa, Australia and Oceania. Moreover, all the morbidity types under analysis were found to be significantly and positively associated with ALAN (p < 0.05), but not with solar radiation exposure estimates, which was found to affect PC rates only (p < 0.05), but not BC, overweight and obesity (p > 0.1).
These results thus provide partial support for our H1, according to which only one environmental risk factor – i.e., either ALAN or solar radiation – was expected to affect the morbidity types under analysis. In particular, the hypothesis in question was upheld for BC, overweight, and obesity (p < 0.05), but not for PC, for which both ALAN and solar radiation emerged as statistically significant (p < 0.05).
The coefficients of determination in the estimated models (R2 = 0.643–0.844) are similar to those obtained by Rybnikova et al. (Citation2015, Citation2016, Citation2017) and Park et al. (Citation2019) that link ALAN exposure to BC, PC, and obesity/overweight rates, attributing this association to MLT suppression and circadian disruption, caused by prolonged ALAN exposure (Reiter et al. Citation2007; Smith et al. Citation2004; Stevens et al. Citation2014).
However, our results differ from those reported by Yao et al. (Citation2015), Syed et al. (Citation2019), and Park et al. (Citation2015) who attribute BC, obesity, and overweight rates to vitamin D deficiency, linked, in turn, to insufficient sunlight exposure. This difference in findings may be due to the fact that these studies analyzed only one factor (i.e., solar radiation), while another factor (ALAN) was overlooked, which might have led to spurious results. Another possible reason for the differences in findings might be attributed to the fact that the studies in question were focused on specific population groups (i.e., patients in hospitals and specialized medical institutions) which limits their generalizability.
Several limitations of the present analysis need to be mentioned. First and foremost, the current study is ecological research based on average country-level data. A well-known limitation of ecological studies is potential misclassification of exposure, as people who suffer from a given disease might not be the same people who were exposed to a particular risk factor (Hart Citation2011). To address this issue, we implemented a population weighting procedure, which allowed us to obtain more accurate ALAN and solar radiation exposure estimates. Nevertheless, future studies should attempt to assign different weights to different countries, based on, e.g., their population size or land area.
Another limitation is that an increase in exposure to a particular risk factor might not necessarily lead to an immediate increase in morbidity, reflecting the phenomenon known as disease latency (Howard Citation2012; Rybnikova et al. Citation2016). To address this issue, we used different latency periods for ALAN exposure estimates. Moreover, outdoor ALAN, which penetrates human habitats during nighttime and is captured by satellites, causes circadian disruption due to nighttime activities it enables, and its negative effects on MLT levels (Haim and Portnov Citation2013; Stevens and Rea Citation2001). Concurrently, indoor ALAN exposure, which is captured by indoor ALAN measurements, may also result in the suppression of the MLT hormone and circadian disruption (Haim and Portnov Citation2013). Although indoor and outdoor ALAN exposures are not necessarily linked, both of them might thus contribute to increased morbidity by becoming endocrine disruptors. The present study is focused, as explicitly mentioned, on the outdoor ALAN exposure, while individual-level studies might be needed to investigate the effect of indoor ALAN exposure on the morbidity types under analysis. Finally, as ecological studies cannot control for potential individual-level cofounders, e.g., individual income, family history, etc., our findings should, therefore, be tested in individual-level follow-up studies.
Conclusion
The present study is an ecological analysis aimed to disentangle the effects of ALAN and solar radiation on three types of morbidity: BC in women, PC in men, and overweight/obesity in both genders. Although the study was performed for countries, not for individuals, it might improve our knowledge about the etiology of the above diseases, thus helping to spearhead public health policies. In particular, as the present study reveals, ALAN exposure is significantly associated with the morbidity types under analysis, while the links of these diseases with solar radiation are weaker. This finding may necessitate regulatory measures that would reduce ALAN exposure, both indoors and outdoors. As Schroer and Hölker (Citation2014) note, there are several ways to minimize the effect of ALAN on natural ecosystems and humans, including the use of dimmers and smart lighting control devices that turn off when they are not needed (Aussat et al. Citation2022), shielded luminaires that minimize ALAN spillover to neighboring areas (Bara et al. Citation2020), and limiting lighting level on streets and roads to the levels that take into account personal safety and road safety but not lead to extensive and unneeded lighting (Portnov et al. Citation2020, Citation2022; Svechkina et al. Citation2020). There is also a need for follow-up individual-level studies, aimed to verify our results against individual-level data, while controlling ALAN and sunlight exposure estimates for potential individual-level confounders.
Disclosure statement
No potential conflict of interest was reported by the author(s).
Additional information
Funding
References
- Agency IE, The World Bank, Sarah F, The World Bank, Rahut DB, Mottaleb KA, Ali A, Aryal J, Smith B, Soares PMM, et al. 2021. Global solar atlas. Renewable and sustainable energy reviews. [accessed 2022 Jul 7]. https://globalsolaratlas.info/download/world .
- Agrawal D, Yin K. 2014. Vitamin D and inflammatory diseases. J Inflamm Res. 7:69. doi:10.2147/JIR.S63898.
- Alfredsson L, Armstrong BK, Butterfield DA, Chowdhury R, de Gruijl FR, Feelisch M, Garland CF, Hart PH, Hoel DG, Jacobsen R, et al. 2020. Insufficient sun exposure has become a real public health problem. Int J Environ Res Public Health. 17:5014. doi:10.3390/ijerph17145014.
- Arble DM, Bass J, Laposky AD, Vitaterna MH, Turek FW. 2009. Circadian timing of food intake contributes to weight gain. Obesity. 17:2100–2102. doi:10.1038/oby.2009.264.
- Aulinas A. 2019. Physiology of the pineal gland and melatonin, endotext [internet]. South Dartmouth (MA): MDText.com, Inc; 1–42. https://www-ncbi-nlm-nih-gov.ezproxy.haifa.ac.il/sites/books/NBK550972/.
- Aussat Y, Rosmanis A, Keshav S. 2022. A power-efficient self-calibrating smart lighting system. Energy Build. 259:111874. doi:10.1016/j.enbuild.2022.111874.
- Bara S, Bouroussis C, Jägerbrand A, Jechow A, Longcore T, Lowenthal J, Motta M, Sanhueza P, Schlangen LJM, Schroer S. 2020. Bio-Environment Working Group Report. In: On-line Workshop Dark and Quiet Skies for Science and Society Report and Recommendations. United Nations. (p. 92-117).
- Barsouk A, Padala SA, Vakiti A, Mohammed A, Saginala K, Thandra KC, Rawla P, Barsouk A. 2020. Epidemiology, staging and management of prostate cancer. Med Sci. 8:28. doi:10.3390/MEDSCI8030028.
- Behrens G, Gredner T, Stock C, Leitzmann MF, Brenner H, Mons U. 2018. Cancers due to excess weight, low physical activity, and unhealthy diet. Deutsches Ärzteblatt Int. 115:578. doi:10.3238/arztebl.2018.0578.
- Bellavia D, Costa V, de Luca A, Maglio M, Pagani S, Fini M, Giavaresi G. 2016. Vitamin D level between calcium-phosphorus homeostasis and immune system: New perspective in osteoporosis. Curr Osteoporos Rep. 2016:1–12. doi:10.1007/S11914-016-0331-2.
- Bikle D. 2000 . Vitamin D: Production, metabolism, and mechanisms of actionIn: Feingold KR, Anawalt B, Boyce A, Chrousos G, Dungan K, Grossman A, Hershman JM, Kaltsas G, Koch C, Kopp P, Korbonits M, McLachlan R, Morley JE, New M, Perreault L, Purnell J, Rebar R, Singer F, Trence DL, Vinik A, Wilson DP, editors. Endotext [Internet]. South Dartmouth (MA): MDText.com, Inc. 1–76. https://www-ncbi-nlm-nih-gov.ezproxy.haifa.ac.il/books/NBK278935/.
- Blask DE, Brainard GC, Dauchy RT, Hanifin JP, Davidson LK, Krause JA, Sauer LA, Rivera-Bermudez MA, Dubocovich ML, Jasser SA, et al. 2005. Melatonin-depleted blood from premenopausal women exposed to light at night stimulates growth of human breast cancer xenografts in nude rats. Cancer Res. 65:11174–11184. doi:10.1158/0008-5472.CAN-05-1945.
- Bruso J. 2018. What are the benefits of eating healthy vs. unhealthy? [accessed 2022 Jul 24]. https://healthyeating.sfgate.com/benefits-eating-healthy-vs-unhealthy-7680.html.
- Cooper AJ, Gupta SR, Moustafa AF, Chao AM. 2021. Sex/Gender differences in obesity prevalence, comorbidities, and treatment. Curr Obes Rep. 10:458–466. doi:10.1007/s13679-021-00453-x.
- Der T, Bailey BA, Youssef D, Manning T, Grant WB, Peiris AN. 2014. Vitamin D and prostate cancer survival in veterans. Mil Med. 179:81–84. doi:10.7205/MILMED-D-12-00540.
- Esri. 2016. How zonal statistics works—help | ArcGIS for desktop. [accessed 2022 Jul 24]. https://desktop.arcgis.com/en/arcmap/10.3/tools/spatial-analyst-toolbox/h-how-zonal-statistics-works.htm.
- Etzioni R, Cha R, Feuer EJ, Davidov O. 1998. Asymptomatic incidence and duration of prostate cancer. Am J Epidemiol. 148:775–785. doi:10.1093/oxfordjournals.aje.a009698.
- Figueiro MG. 2017. Disruption of circadian rhythms by light during day and night. Curr Sleep Med Rep. 3:76–84. doi:10.1007/s40675-017-0069-0.
- Fonken LK, Workman JL, Walton JC, Weil ZM, Morris JS, Haim A, Nelson RJ. 2010. Light at night increases body mass by shifting the time of food intake. Proc Natl Acad Sci. 107:18664–18669. doi:10.1073/pnas.1008734107.
- Friedenreich CM, Orenstein MR. 2002. Physical activity and cancer prevention: Etiologic evidence and biological mechanisms. J Nutr. 132:3456S–3464S. doi:10.1093/jn/132.11.3456S.
- Gabinet NM, Portnov BA. 2021. Assessing the impacts of ALAN and noise proxies on sleep duration and quality: Evidence from a nation-wide survey in Israel. Chronobiol Int. 38:638–658. doi:10.1080/07420528.2021.1886111.
- Gabinet NM, Portnov BA. 2022. Investigating the combined effect of ALAN and noise on sleep by simultaneous real-time monitoring using low-cost smartphone devices. Environ Res. 113941. doi:10.1016/j.envres.2022.113941.
- Garaulet M, Ordovás JM, Madrid JA. 2010. The chronobiology, etiology and pathophysiology of obesity. Int J Obes. 34:1667–1683. doi:10.1038/ijo.2010.118.
- GHD GHD. 2019. VizHub - GBD results. Global burden of disease collaborative network. Global burden of disease study 2019. Seattle: Institute of Health Metrics and Evaluation(IHME); 2020. [accessed 2022 Jul 24]. https://vizhub.healthdata.org/gbd-results/.
- Haim A, Portnov BA. 2013. Light pollution as a new risk factor for human breast and prostate cancers, light pollution as a new risk factor for human breast and prostate cancers. Haifa (IL): Dordrecht Springer. doi:10.1007/978-94-007-6220-6.
- Hart J. 2011. On ecological studies: A short communication. Dose-Response. 9:497–501. doi:10.2203/dose-response.10-046.Hart.
- Howard J. 2012. Minimum latency & types of cancer 1–4.
- Hussain Gilani SY, Bibi S, Siddiqui A, Ali Shah SR, Akram F, Rehman MU. 2019. Obesity and diabetes as determinants of Vitamin D deficiency. J Ayub Med Coll Abbottabad. 31:432–435.
- Jeon S-M, Shin E-A. 2018. Exploring vitamin D metabolism and function in cancer. Exp Mol Med. 50:1–14. doi:10.1038/s12276-018-0038-9.
- Kark M, Rasmussen F. 2005. Growing social inequalities in the occurrence of overweight and obesity among young men in Sweden. Scand J Public Health. 33:472–477. doi:10.1080/14034940510032130.
- Kelsey JL, Gammon MD. 1991. The epidemiology of breast cancer. CA Cancer J Clin. 41:146–165. doi:10.3322/canjclin.41.3.146.
- Kennaway DJ, Voultsios A, Varcoe TJ, Moyer RW. 2002. Melatonin in mice: Rhythms, response to light, adrenergic stimulation, and metabolism. American J Physiol Regul Integr Comp Physiol. 282:R358–365. doi:10.1152/ajpregu.00360.2001.
- Kloog I, Haim A, Stevens RG, Barchana M, Portnov BA. 2008. Light at night co-distributes with incident breast but not lung cancer in the female population of Israel. Chronobiol Int. 25:65–81. doi:10.1080/07420520801921572.
- Laposky AD, Bass J, Kohsaka A, Turek FW. 2008. Sleep and circadian rhythms: Key components in the regulation of energy metabolism. FEBS Lett. 582:142–151. doi:10.1016/j.febslet.2007.06.079.
- Lindsey R. 2009. Climate change: Incoming sunlight | NOAA climate.Gov. [accessed 2022 Jul 24]. https://www.climate.gov/news-features/understanding-climate/climate-change-incoming-sunlight.
- Linear Regression - IBM Documentation. n.d. [accessed 2022 Jul 27]. https://www.ibm.com/docs/en/spss-statistics/SaaS?topic=features-linear-regression.
- Martin JS, Hébert M, Ledoux E, Gaudreault M, Laberge L. 2012. Relationship of chronotype to sleep, light exposure, and work-related fatigue in student workers. Chronobiol Int. 29:295–304. doi:10.3109/07420528.2011.653656.
- Micha R, Shulkin ML, Peñalvo JL, Khatibzadeh S, Singh GM, Rao M, Fahimi S, Powles J, Mozaffarian D, Kiechl S. 2017. Etiologic effects and optimal intakes of foods and nutrients for risk of cardiovascular diseases and diabetes: systematic reviews and meta-analyses from the nutrition and chronic diseases expert group (NutriCode). PLOS ONE. 12:e0175149. doi:10.1371/journal.pone.0175149.
- Miech RA, Kumanyika SK, Stettler N, Link BG, Phelan JC, Chang VW. 2006. Trends in the association of poverty with overweight among US adolescents, 1971-2004. JAMA. 295:2385. doi:10.1001/jama.295.20.2385.
- Mohammadbeigi A, Asgarian A, Moshir E, Heidari H, Afrashteh S, Khazaei S, Ansari H. 2018. Fast food consumption and overweight/obesity prevalence in students and its association with general and abdominal obesity. J Prev Med Hyg. 59:E236–240. doi:10.15167/2421-4248/jpmh2018.59.3.830.
- Momenimovahed Z, Salehiniya H. 2019. Epidemiological characteristics of and risk factors for breast cancer in the world. Breast Cancer. 11:151–164. doi:10.2147/BCTT.S176070.
- Nishida C, Uauy R, Kumanyika S, Shetty P. 2004. The joint WHO/FAO expert consultation on diet, nutrition and the prevention of chronic diseases: Process, product and policy implications. Public Health Nutr. 7:245–250. doi:10.1079/PHN2003592.
- NOAA, U.D. of C.N.S. and I.S.N.C. for E.I. 2020. NOAA National Centers for Environmental Information (NCEI). [accessed 2022 Jul 27]. https://ngdc.noaa.gov/.
- Park S, Lee DH, Jeon JY, Ryu J, Kim S, Kim JY, Park HS, Kim SI, Park B-W. 2015. Serum 25-hydroxyvitamin D deficiency and increased risk of breast cancer among Korean women: A case–control study. Breast Cancer Res Treat. 152:147–154. doi:10.1007/s10549-015-3433-0.
- Park YMM, White AJ, Jackson CL, Weinberg CR, Sandler DP. 2019. Association of exposure to artificial light at night while sleeping with risk of obesity in women. JAMA Intern Med. 179:1061. doi:10.1001/jamainternmed.2019.0571.
- Peterlik M, Boonen S, Cross H, Lamberg-Allardt C. 2009. Vitamin D and calcium insufficiency-related chronic diseases: An emerging world-wide public health problem. Int J Environ Res Public Health. 6:2585–2607. doi:10.3390/ijerph6102585.
- Pilz S, Tomaschitz A, Ritz E, Pieber TR. 2009. Vitamin D status and arterial hypertension: A systematic review. Nat Rev Cardiol. 6:621–630. doi:10.1038/nrcardio.2009.135.
- Pineda-Moncusí M, Garcia-Perez MA, Rial A, Casamayor G, Cos ML, Servitja S, Tusquets I, Diez-Perez A, Cano A, Garcia-Giralt N et al, 2018. Vitamin D levels in Mediterranean breast cancer patients compared with those in healthy women. Maturitas. 116:83–88. doi:10.1016/J.MATURITAS.2018.07.015.
- Ponsonby A-L, Lucas RM, van der Mei IAF. 2005. UVR, Vitamin D and three autoimmune diseases—multiple sclerosis, type 1 diabetes, rheumatoid arthritis. Photochem Photobiol. 81:1267. doi:10.1562/2005-02-15-IR-441.
- Portnov B, Fotios S, Saad R, Kliger D. 2022. Establishing optimal illuminance for pedestrian reassurance using segmented regression. Lighting Res Technol. 147715352210806. doi:10.1177/14771535221080649.
- Portnov BA, Saad R, Trop T, Kliger D, Svechkina A, Yuan Q. 2020. Linking nighttime outdoor lighting attributes to pedestrians’ feeling of safety: An interactive survey approach. PLOS ONE. 15:1–21. doi:10.1371/journal.pone.0242172.
- Rea MS, Figueiro MG, Bullough JD, Bierman A. 2005. A model of phototransduction by the human circadian system. Brain Res Rev. 50:213–228. doi:10.1016/j.brainresrev.2005.07.002.
- Reiter RJ, Tan D-X, Korkmaz A, Erren TC, Piekarski C, Tamura H, Manchester LC. 2007. Light at night, chronodisruption, melatonin suppression, and cancer risk: A review. Crit Rev Oncog. 13:303–328. doi:10.1615/CritRevOncog.v13.i4.30.
- Rippe JM, Hess S. 1998. The role of physical activity in the prevention and management of obesity. J Am Diet Assoc. 98:S31–38. doi:10.1016/S0002-8223(98)00708-1.
- Ritchie H, Roser M. 2017. Diet compositions - our world in data. Our world in data. [accessed 2022 Jul 24]. https://ourworldindata.org/diet-compositions#diet-compositions-by-macronutrient.
- Rose A, McKee J, Sims K, Bright E, Reith A, Urban M. 2021. LandScan global 2020. LandScan Global. doi:10.48690/1523378.
- Rybnikova N, Haim A, Portnov BA. 2015. Artificial Light at Night (ALAN) and breast cancer incidence worldwide: A revisit of earlier findings with analysis of current trends. Chronobiol Int. 32:757–773. doi:10.3109/07420528.2015.1043369.
- Rybnikova NA, Haim A, Portnov BA. 2016. Does artificial light-at-night exposure contribute to the worldwide obesity pandemic? Int J Obes. 40:815–823. doi:10.1038/ijo.2015.255.
- Rybnikova NA, Haim A, Portnov BA. 2017. Is prostate cancer incidence worldwide linked to artificial light at night exposures? Review of earlier findings and analysis of current trends. Arch Environ Occup Health. 72:111–122. doi:10.1080/19338244.2016.1169980.
- Schroer S, Hölker F. 2014. Light pollution reduction. In: Handbook of advanced lighting technology. Cham: Springer International Publishing, p. 1–17. doi:10.1007/978-3-319-00295-8_43-1.
- Smith KA, Schoen MW, Czeisler CA. 2004. Adaptation of human pineal melatonin suppression by recent photic history. J Clin Endocrinol Metab. 89:3610–3614. doi:10.1210/jc.2003-032100.
- Smolensky MH, Sackett-Lundeen LL, Portaluppi F. 2015. Nocturnal light pollution and underexposure to daytime sunlight: Complementary mechanisms of circadian disruption and related diseases. Chronobiol Int. 32:1029–1048. doi:10.3109/07420528.2015.1072002.
- Stevens RG, Brainard GC, Blask DE, Lockley SW, Motta ME. 2014. Breast cancer and circadian disruption from electric lighting in the modern world. CA Cancer J Clin. 64:207–218. doi:10.3322/caac.21218.
- Stevens RG, Rea MS. 2001. Light in the built environment: Potential role of circadian disruption in endocrine disruption and breast cancer. Cancer Caus Control 2001. 12:279–287. doi:10.1023/A:1011237000609.
- Sung H, Ferlay J, Siegel RL, Laversanne M, Soerjomataram I, Jemal A, Bray F. 2021. Global cancer statistics 2020: GLOBOCAN estimates of incidence and mortality worldwide for 36 cancers in 185 countries. CA Cancer J Clin. 71:209–249. doi:10.3322/caac.21660.
- Svechkina A, Trop T, Portnov BA, Portnov BA. 2020. How much lighting is required to feel safe when walking through the streets at night? Sustain (Switzerland). 12:3133. doi:10.3390/SU12083133.
- Syed YHG, Bibi S, Siddiqui A, Ali Shah SR, Akram F, Rehman MU. 2019. Obesity and diabetes as determinants of vitamin D deficiency. J Ayub Med Coll Abbottabad. 31:432–435.
- Van Bommel WJM. 2006. Non-visual biological effect of lighting and the practical meaning for lighting for work. Appl Ergon. 37:461–466. doi:10.1016/j.apergo.2006.04.009.
- Vieira AR, Chan D, Aune D, Abar L, Navarro D, Vingeliene S, Greenwood DC. 2013. World cancer research fund international systematic literature review. The associations between food, nutrition and physical activity and the risk of prostate cancer Imperial College London continuous update project team members Teresa norat. [accessed 2022 Jul 27]. https://www.wcrf.org/wp-content/uploads/2021/02/breast-cancer-slr.pdf.
- Wb TWB. 2022. Gini index | data. The world bank. [accessed 2022 Jul 27]. https://data.worldbank.org/indicator/SI.POV.GINI.
- Wb WB, Oecd. 2018. GDP per capita (current US$) | data. World Bank Group US. [accessed 2022 Jul 27]. https://data.worldbank.org/indicator/NY.GDP.PCAP.CD.
- WHO. 2003. Diet, nutrition and the prevention of chronic diseases: Report of a joint WHO/FAO expert consultation, Geneva, 28 January - 1 February 2002. World Health Organization. [accessed 2022 Jul 29]. https://apps.who.int/iris/handle/10665/42665.
- WHO. 2021. Fact sheets: Malnutrition. Fact sheets: Malnutrition. [accessed 2022 Jul 29]. https://www.who.int/news-room/fact-sheets/detail/malnutrition.
- WHO. 2022a. Body mass index (BMI). [accessed 2022 Jul 27]. https://www.who.int/data/gho/data/themes/topics/topic-details/GHO/body-mass-index.
- WHO. 2022b. WHO European regional obesity report 2022. World Health Organization. Regional Office for Europe. [accessed 2022 Jul 29]. https://apps.who.int/iris/handle/10665/353747.
- Xie Z, Chen F, Li WA, Geng X, Li C, Meng X, Feng Y, Liu W, Yu F. 2017. A review of sleep disorders and melatonin. Neurol Res. 39:559–565. doi:10.1080/01616412.2017.1315864.
- Yao Y, Zhu L, He L, Duan Y, Liang W, Nie Z, Jin Y, Wu X, Fang Y. 2015. A meta-analysis of the relationship between vitamin D deficiency and obesity. Int J Clin Exp Med. 8:14977–14984.
- Zaidi FH, Hull JT, Peirson SNN, Wulff K, Aeschbach D, Gooley JJ, Brainard GCC, Gregory-Evans K, Rizzo JFF, Czeisler CA, et al. 2007. Short-wavelength light sensitivity of circadian, pupillary, and visual awareness in humans lacking an outer retina. Curr Biol. 17:2122–2128. doi:10.1016/J.CUB.2007.11.034.
Appendix A
Figure A1. Population-weighted national averages of solar radiation by countries worldwide, kWh/m².
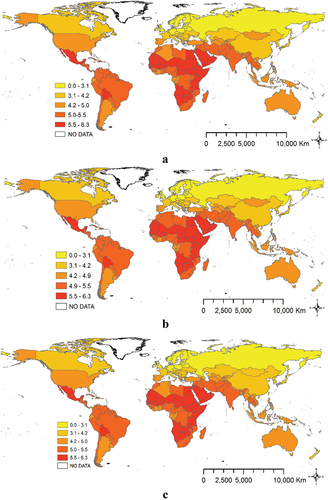
Figure A1. (Continued).
Appendix B
Figure B1. Population-weighted ALAN averages by countries worldwide, nanowatts/cm2/sr.
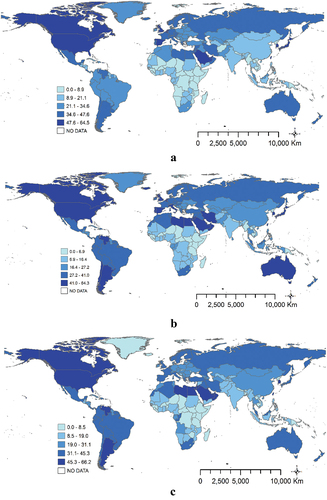
Figure B1. (Continued).
Appendix C
Figure C1. BC rates by countries worldwide.
Appendix D
Figure D1. BC rates by countries worldwide.
Appendix E
Figure E1. Overweight ASR by countries worldwide, %.
Appendix F
Figure F1. Overweight ASR by countries worldwide, %.
Appendix G.
Factors affecting obesity, overweight, BC, PC – Method: linear regression
Table G1. Factors affecting obesity rates in individual countries of the world (Dependent variable – Obesity, % ASR in the years 1998; 1999; 2000 and 2001; explanatory 2-year latency period, unless stated otherwise).
Table G2. Factors affecting obesity rates in individual countries of the world (dependent variable – obesity, % ASR in the years 2002; 2003; 2004 and 2005; explanatory 2-year latency period, unless stated otherwise).
Table G3. Factors affecting obesity rates in individual countries of the world (dependent variable – obesity, % ASR in the years 2006; 2007; 2008 and 2009; explanatory 2-year latency period, unless stated otherwise).
Table G4. Factors affecting obesity rates in individual countries of the world (dependent variable – obesity, % ASR in the years 2010; 2011; 2012 and 2013; explanatory 2-year latency period, unless stated otherwise).
Table G5. Factors affecting obesity rates in individual countries of the world (dependent variable – obesity, % ASR in the years 2014; 2015 and 2016; explanatory 2-year latency period, unless stated otherwise).
Table G6. Factors affecting obesity rates in individual countries of the world (dependent variable – obesity, % ASR in the years 2015 and 2016 explanatory 2-year latency period, unless stated otherwise).
Table G7. Factors affecting overweight rates in individual countries of the world (dependent variable – overweight, % ASR in the years 1998; 1999; 2000 and 2001 explanatory 2-year latency period, unless stated otherwise).
Table G8. Factors affecting overweight rates in individual countries of the world (dependent variable – overweight, % ASR in the years 2002; 2003; 2004 and 2005 explanatory 2-year latency period, unless stated otherwise).
Table G9. Factors affecting overweight rates in individual countries of the world (dependent variable – overweight, % ASR in the years 2006; 2007; 2008 and 2009 explanatory 2-year latency period, unless stated otherwise).
Table G10. Factors affecting overweight rates in individual countries of the world (dependent variable – overweight, % ASR in the years 2010; 2011; 2012 and 2013 explanatory 2-year latency period, unless stated otherwise).
Table G11. Factors affecting overweight rates in individual countries of the world (dependent variable – overweight, % ASR in the years 2014; 2015 and 2016 explanatory 2-year latency period, unless stated otherwise).
Table G12. Factors affecting overweight rates in individual countries of the world (dependent variable – overweight, % ASR in the years 2015 and 2016 explanatory 2-year latency period, unless stated otherwise).
Table G13. Factors affecting breast cancer rates in individual countries of the world (dependent variable – breast cancer rate ASR in the years 2006; 2007; 2008 and 2009 explanatory 10-year latency period, unless stated otherwise).
Table G14. Factors affecting breast cancer rates in individual countries of the world (dependent variable – breast cancer rate ASR in the years 2010; 2011; 2012 and 2013 explanatory 10-year latency period, unless stated otherwise).
Table G15. Factors affecting breast cancer rates in individual countries of the world (dependent variable – breast cancer rate ASR in the years 2014; 2015 and 2016 explanatory 10-year latency period, unless stated otherwise).
Table G16. Factors affecting prostate cancer rates in individual countries of the world (dependent variable – prostate cancer rate ASR in the years 2006; 2007; 2008 and 2009 explanatory 10-year latency period, unless stated otherwise).
Table G17. Factors affecting prostate cancer rates in individual countries of the world (dependent variable – prostate cancer rate ASR in the years 2010; 2011; 2012 and 2013 explanatory 10-year latency period, unless stated otherwise).
Table G18. Factors affecting prostate cancer rates in individual countries of the world (dependent variable – prostate cancer rate ASR in the years 2014; 2015 and 2016 explanatory 10-year latency period, unless stated otherwise).