
 ?Mathematical formulae have been encoded as MathML and are displayed in this HTML version using MathJax in order to improve their display. Uncheck the box to turn MathJax off. This feature requires Javascript. Click on a formula to zoom.
ABSTRACT
There is significant interest in the possible influence of chronotype on clinical states in young people with emerging mental disorders. We apply a dynamic approach (bivariate latent change score modelling) to examine the possible prospective influence of chronotype on depressive and hypo/manic symptoms in a youth cohort with predominantly depressive, bipolar, and psychotic disorders (N = 118; 14–30-years), who completed a baseline and follow-up assessment of these constructs (mean interval = 1.8-years). Our primary hypotheses were that greater baseline eveningness would predict increases in depressive but not hypo/manic symptoms. We found moderate to strong autoregressive effects for chronotype (β = -0.447 to −0.448, p < 0.001), depressive (β = -0.650, p < 0.001) and hypo/manic symptoms (β = -0.819, p < 0.001). Against our predictions, baseline chronotypes did not predict change in depressive (β = -0.016, p = 0.810) or hypo/manic symptoms (β = 0.077, p = 0.104). Similarly, the change in chronotype did not correlate with the change in depressive symptoms (β = -0.096, p = 0.295) nor did the change in chronotype and the change in hypo/manic symptoms (β = -0.166, p = 0.070). These data suggest that chronotypes may have low utility for predicting future hypo/manic and depressive symptoms in the short term, or that more frequent assessments over longer periods are needed to observe these associations. Future studies should test whether other circadian phenotypes (e.g. sleep-wake variability) are better indicators of illness course.
Introduction
There is substantial interest in the role of the “body clock” in mental health (Crouse et al. Citation2021; McCarthy et al. Citation2022). Accumulating evidence suggests that variations and disturbances in the circadian system (e.g. 24-h sleep-wake cycle) may play an important role in the presentation, course, and treatment of mental disorders (Hickie et al. Citation2023; Logan and McClung Citation2019; McCarthy et al. Citation2022; Murray et al. Citation2020; Wulff et al. Citation2010). Variations and disturbances in circadian-relevant factors are observed in the early phases of mental disorders, which may have implications for identification of and early intervention in at-risk groups (Robillard et al. Citation2016; Scott et al. Citation2022). One factor that is linked to the circadian system and relevant to mental ill-health is chronotype. While conceptualised in different ways depending on the instrument used (Roenneberg Citation2015), one popular definition of chronotype is an individual’s preference for daily timing of sleep and activity, which encompasses variations in alertness, mood, and energy during wakefulness. Chronotype varies with age and sex (Fischer et al. Citation2017) and undergoes developmental changes across the lifespan, for example, becoming more evening-like during adolescence (Roenneberg et al. Citation2004). While it has a major genetic component (Jones et al. Citation2019), it is also determined by light (Roenneberg and Merrow Citation2007). Variations in chronotypes have now been linked to a variety of indicators of poor health, including mental health problems.
Meta-analyses report a consistent yet weak, cross-sectional link between depressive symptoms and chronotype (Au and Reece Citation2017; Norbury Citation2021). People classified as evening types may be more prone to depressive symptoms and syndromes (Antypa et al. Citation2016; Merikanto and Partonen Citation2021; Merikanto et al. Citation2013), and eveningness may be a marker of severity of depressive symptoms among patients with mental disorders (Melo et al. Citation2017; Meyrel et al. Citation2022). The link between chronotype and manic symptoms is less established. While individuals with bipolar disorder are more likely to be evening types (Melo et al. Citation2017; Meyrel et al. Citation2022), chronotype appears to be more strongly linked to depression than manic symptoms in bipolar disorder (Melo et al. Citation2017). Eveningness has been shown to be associated with manic symptoms in bipolar disorder (McCarthy et al. Citation2019) though null findings are more common (Giglio et al. Citation2010; Kanagarajan et al. Citation2018; Mansour et al. Citation2005).
Few prospective studies of chronotype and mental health are available. A community study of youth found that baseline eveningness predicted future increases in depressive symptoms, and that baseline depressive symptoms were associated with future eveningness (Haraden et al. Citation2017). In another community study of people with depressive and/or anxiety disorders, a prospective advance in chronotype (toward morningness) was associated with decreased depressive symptoms but not anxiety symptoms (Druiven et al. Citation2020). Clinical trials have also shed light on links between chronotype and depressive symptoms. One randomised controlled trial (n = 22 healthy individuals) that aimed to behaviourally advance the sleep-wake timing of evening types demonstrated that a phase advance in the sleep-wake cycle was associated with improvements in self-reported depressive symptoms (Facer-Childs et al. Citation2019); Similarly, an open-label study (n = 24 youths with depression) of the antidepressant agomelatine showed that a phase advance in dim-light melatonin onset was strongly associated with change in clinician-rated depressive symptom severity (Robillard et al. Citation2018a). Only one study has examined chronotype and manic symptoms longitudinally, finding that in bipolar disorder, evening types were more likely to experience subsequent depressive symptoms but less likely to experience hypo/mania (Vidafar et al. Citation2021). However, a limitation of these studies is that they did not model changes in chronotype over time, nor did they examine changes in both manic and depressive symptoms alongside chronotype.
To better establish whether chronotype predicts future depressive and manic symptoms, a statistical approach is needed that can model (a) the degree or rate of change in variables over time; (b) the potential causes of change in variables over time; and (d) correlated change in variables over time. These questions are especially relevant in young people for whom chronotype undergoes the most rapid and substantial developmental change across the lifespan (Fischer et al. Citation2017; Roenneberg et al. Citation2004). One popular approach is the latent change score (LCS) model (Kievit et al. Citation2018), which is well suited to dynamical questions and has been applied to other areas of mental health (Crouse et al. Citation2020b; Hoe et al. Citation2012).
Here, we use bivariate LCS models to examine the prospective relationships among chronotype and depressive and hypo/manic symptoms in young people with emerging mental disorders. First, with respect to depressive symptoms, we hypothesise that greater eveningness at baseline will be associated with higher depressive symptom severity at baseline (H1); greater eveningness at baseline will be associated with an increase in depressive symptom severity over time (H2); higher depressive symptom severity at baseline will be associated with an increase in eveningness over time (H3); and an increase in morningness will be associated with a reduction in depressive symptom severity over time (H4). Second, with respect to hypo/manic symptoms, we hypothesise that chronotype and hypo/manic symptoms at baseline will not be associated (H5); and chronotype at baseline will not be associated with change in hypo/manic symptoms over time (H6). We will also examine potential relationships between baseline hypo/manic symptoms and change in chronotype, and between change in hypo/manic symptoms and change in chronotype; however, based on the sparsity of prior evidence, these are exploratory analyses.
Methods
Ethics approval
The study and consent procedures were approved by the University of Sydney Human Research Ethics Committee (number: 2012/1631). Participants aged 16-years and over provided written informed consent, and parental/guardian consent was obtained for those aged under 16-years.
Participants
Participants were referred from one of the two primary care-based early intervention mental health services (www.headspace.org.au) in Sydney, Australia (Scott et al. Citation2012) and were recruited into a broader research program investigating the neurobiology of emerging mental disorders in young people (Lee et al. Citation2018). This program has been detailed elsewhere (Crouse et al. Citation2020a), but briefly, involved administration of a protocol for self-report questionnaires, clinician-rated scales, a neuropsychological battery, and biological measures for subsets of the sample. A single referring clinician determined participants’ primary diagnosis based on DSM-IV criteria and participants were then grouped into broad diagnostic categories: depression, bipolar, psychosis, and other (anxiety disorders, autism spectrum disorder, learning disorders, alcohol/substance use disorders, and personality disorders). After referral, assessments were conducted by one of the several graduate-level research officers.
Young people were excluded from participating if they met any of the following criteria: (a) history of neurological disease; (b) medical illness known to affect cognitive/brain function; (c) received electroconvulsive therapy in the 3 months prior to anassessment; (d) clinically evident intellectual disability; or (e) insufficient understanding of the English language to allow participation in verbal testing.
Assessments
Hamilton Depression Rating Scale (HDRS) (Hamilton Citation1960): clinician-administered, 17-item rating scale measuring the severity of depressive symptoms. The severity of each symptom is rated on a three-, four-, or five-point scale, giving a maximum total score of 52. HDRS total scores higher than 8, 16 and 23 suggest mild, moderate and severe depressive symptoms, respectively (Zimmerman et al. Citation2013). The scale had good internal consistency (Cronbach’s = .82).
Young Mania Rating Scale (YMRS) (Young et al. Citation1978): clinician-administered, 11-item rating scale measuring the severity of hypo/manic symptoms. The severity of each symptom is rated on a five-point scale, giving a maximum total score of 60. A YMRS total score ≥ 25 suggests that the severity of manic symptoms is enough to assess the person as “markedly ill” (Lukasiewicz et al. Citation2013). The scale had good internal consistency (Cronbach’s = .84)
Morningness-Eveningness Questionnaire (MEQ) (Horne and Östberg Citation1976): self-report, 19-item rating scale measuring chronotype. Though all the items ask respondents to rate their behaviour on a four- or five-point scale, some items also ask for a rating on an objective scale such as time, while others require respondents to evaluate subjective internal experiences. Item ratings are summed up to give a total score of 16–80 (higher scores indicating a greater preference for morningness). MEQ types are categorised into the following total score ranges: Definite evening = 16–30, Moderate evening = 31–41, Intermediate = 42–58, Moderate morning = 59–69, Definite morning = 70–86. The scale had good internal consistency (Cronbach’s = .80).
Eligibility criteria
Aged 12–30 years at baseline.
Had a baseline and follow-up assessment that included measures of depressive symptoms, hypo/manic symptoms, and chronotype (including only participants with a single follow-up assessment).
Provided informed consent for the original study and for their data to be used in subsequent studies (or parental/guardian consent was obtained).
Statistical analysis
Analyses were conducted using R statistical software (version 4.1.3) (R Core Team Citation2022). The lavaan package (Rosseel Citation2012) was used to perform structural equation modelling. Bivariate latent change score (LCS) models were used to examine the hypothesised relationships of chronotype and depressive and hypo/manic symptoms (cross-sectionally and prospectively). For the bivariate LCS model to be identified, we derive two important parameter constraints. First, the autoregressive coefficient (i.e. the coefficient obtained when regressing a variable measured at follow-up onto itself measured at baseline) is constrained to 1. Second, each latent change score was set as a perfect indicator (factor loading = 1) of its respective construct measured at follow-up (Kievit et al. Citation2018). Given that age is associated with chronotype, it was included as a covariate at baseline.
The model fit was evaluated using several indices. The chi-square () statistic determines whether the hypothesised model deviates from the “perfect” model (the observed data). A statistically significant
indicates that the hypothesised model deviates significantly from the observed data. The Root Mean Square Error of Approximation (RMSEA) and the Standardised Root Mean Square Residual (SRMR) measure how much the hypothesised model deviates from the perfect model. Of these indices, lower values indicate less deviation; models with values <0.08 are desirable (Kline Citation2011). The Comparative Fit Index (CFI) and Tucker-Lewis Index (TLI) are incremental fit indices, measuring how well the hypothesised model fits versus a baseline model (wherein no regressions or covariances are specified).Higher CFI and TLI values are better, with values > 0.90 and > 0.95 suggesting adequate and excellent fit, respectively. We instructed lavaan to apply Yuan-Bentler scaling (Yuan and Bentler Citation2000) to all fit indices and to estimate free parameters using the maximum likelihood estimator with Huber-White standard errors. More details on these techniques can be found elsewhere (Savalei and Rosseel Citation2022), and more details about our statistical analysis are in Supplementary Materials.
We conducted a post-hoc Monte Carlo simulation study to determine whether we had sufficient power to detect effects of interest within the bivariate LCS models. For each model, this requires specifying a population model containing a priori values for all model parameters (not just the paths of interest; Wang and Rhemtulla Citation2021). We started by defining the effect size as the proportion of variance in the change score explained by the dependent variables in each model (i.e., R2 of the change score). Then, with reference to our hypotheses and available literature, we work backward to derive population values for all paths, variances, and means (see Table S3). If we could not find a literature value for a parameter, we used the sample statistic as a substitute. We used the package simsem (Pornprasertmanit et al. Citation2021) to generate 1000 datasets using a population model with a sample size of 118. For a given effect size and path, the power is defined as the proportion of datasets in which the regression coefficient differs significantly from 0 (=.05). We deemed a power of 0.8 to be adequate.
Results
Sample characteristics
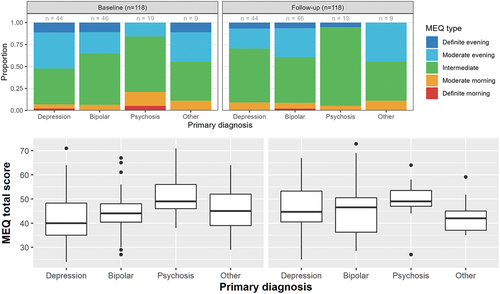
One-hundred-and-eighteen young people met the eligibility criteria. Descriptive statistics are presented for all eligible samples in and across diagnostic groups in . In the baseline assessment, the samples were aged 14–30 years (M = 20.9; SD = 3.87), with 72 females (61.0%) and 46 males. Mood disorders were the most frequent diagnosis in our sample. Forty-four participants had a primary diagnosis of a depressive disorder, 46 with a bipolar disorder, 19 with a psychotic disorder, and 9 with “other” disorders (anxiety disorders [n = 6], cyclothymia [n = 1], obsessive-compulsive disorder [n = 1], attention-deficit/hyperactivity disorder [n = 1]). Severity of depressive and hypo/manic symptoms were mild (on average) at baseline and follow-up. Substance use (tobacco, alcohol, cannabis) and use of psychotropic medications (antidepressants, antipsychotics, mood stabilisers) were prevalent among our sample ().
Table 1. Sample socio-demographics, symptom total scores, and chronotype at baseline and follow-up assessments (N = 118).
Table 2. Sample characteristics and clinical scores by diagnostic group.
The mean follow-up duration was 1.8 years (SD = 0.8). From baseline to follow-up, depressive and hypo/manic symptoms decreased (on average), while chronotype shifted dimensionally toward morningness (on average). Line graphs illustrating individual and sample-wise change in these measures are shown in Supplementary Figure 1. Most of our sample were classified as “intermediate” types at baseline and follow-up (i.e. chronotype falling between morningness and eveningness; ).
Figure 1. Morningness-Eveningness Questionnaire (MEQ) categories and total scores at baseline and follow-up across diagnostic groups.
Univariate latent change score (LCS) models
To investigate how individual scores on each measure changed over time, we created three univariate LCS models. Diagrams of each univariate LCS model are shown in Supplementary Figure S2. Each of the models fits the data well; model fit indices are reported in . For each model, the intercept of the change score factor represents the mean change in scores between baseline and follow-up, while the variance of the change score indicates whether individuals differ in their change over time. All three models indicated a reliable average change over time (unstandardised change score intercept: depressive symptoms = 4.93, SE = .908, p < 0.001; hypo/manic symptoms = 1.95, SE = .458, p < 0.001; chronotype = 18.1, SE = 3.11, p < 0.001), as well as individual differences in the amount of change over time (unstandardised change score variance: depressive symptoms = 30.9, SE = 2.93, p < 0.001; hypo/manic symptoms = 15.3, SE = 5.05, p = 0.002; chronotype = 53.2, SE = 6.33, p < 0.001).
Table 3. Fit indices for the univariate latent change score models.
Bivariate latent change score (BLCS) models
Given that scores in all three domains indeed changed over time, we proceeded to create two bivariate LCS models to examine the potential predictors of change within and between domains. We report regression coefficients in standardized form within the main text. The unstandardized coefficients and their standard errors can be found in .
Table 4. Path coefficients for bivariate latent change score models. Single-headed arrows (→) indicate a regression path; the double-headed arrows (↔) indicate a covariance path.
Chronotype and depressive symptoms
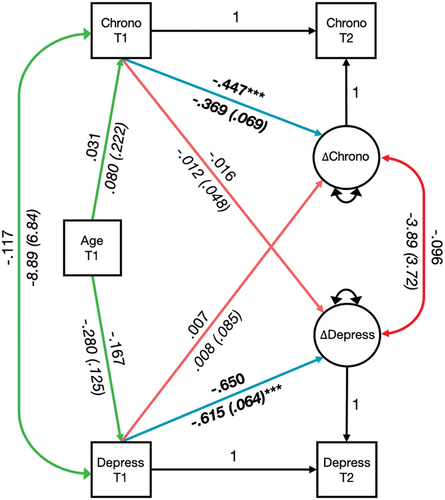
The first BLCS model was constructed to examine the association between baseline chronotype and depressive symptoms, and their respective change over time ( and ). The model was an excellent fit to the data [(2) = 1.21, p = 0.546, RMSEA=.000 [90% CI .000–.160], CFI = 1.00, TLI = 1.04, SRMR=.017]. First, we observed that both autoregressive effects were significant: greater baseline depressive symptom severity was strongly associated with less change in depressive symptoms over time (β = -0.650, p < 0.001), while greater baseline morningness was moderately associated with less change toward morningness over time (β = -0.447, p < 0.001). As expected, based on preliminary correlational analyses, we found that baseline depressive symptoms and baseline chronotype were not significantly associated (β = -0.117, p = 0.194). Against our hypotheses, we did not observe significant lead-lag associations between baseline chronotype and change in depressive symptoms (β = -0.016, p = 0.810), nor for baseline depressive symptoms and change in chronotype (β = 0.007, p = 0.926). Similarly, we did not find evidence of correlated change: change in depressive symptoms and change in chronotype were not related (β = -0.096, p = 0.295). Finally, the age covariate was not significantly related to either depressive symptoms (β = -.113, p = 0.215) or chronotype (β = 0.031, p = 0.718) at baseline. In our post-hoc Monte Carlo simulation study, we assumed medium effects in the proportion of explained variance for both change scores (R2 = .13; see Table S3 for the complete list of assumptions). We had sufficient power to detect significant autoregressive and lead-lag paths, and significance in the correlation between the change scores (power >.89 in all cases) but lacked the power to detect significance in the association between baseline chronotype and depressive symptoms (power = .58).
Figure 2. Bivariate latent change score model of depressive symptoms and chronotype at baseline (T1) and follow-up (T2) assessments.
Chronotype and hypo/manic symptoms
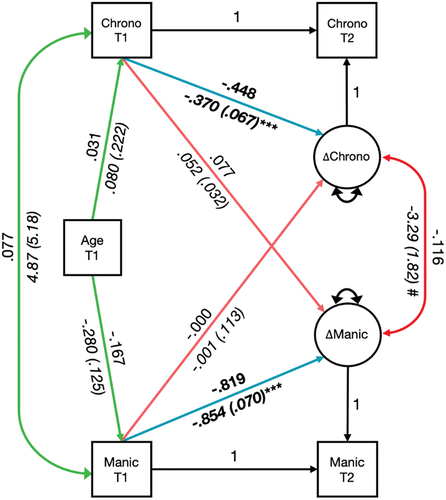
The second BLCS model was created to explore how baseline levels of chronotype and hypo/manic symptoms, and their relative change over time, are related ( and ). Like the first BLCS model, this model was an excellent fit to data [ = 1.78, p = 0.411, RMSEA =.00 [90% CI .000–.175], CFI = 1.00, TLI = 1.02, SRMR=.023]. Again, both autoregressive effects were significant: greater baseline severity of hypo/manic symptoms was very strongly associated with less change in hypo/manic symptoms over time (β=-0.819, p < 0.001), and greater morningness at baseline was moderately associated with less change towards morningness over time (β = -0.448, p < 0.001). As observed in our preliminary univariate correlational analyses, hypo/manic symptoms and chronotype at baseline were not related (β = 0.077, p = 0.347). Against expectations, we did not find any significant lead-lag associations between baseline chronotype and change in hypo/manic symptoms (β = 0.077, p = 0.104), nor for baseline hypo/manic symptoms and change in chronotype (β = -0.000, p = 0.996). There was no significant relationship between the change in hypo/manic symptoms and the change in chronotype over time (β = -0.116, p = 0.070). Finally, age was not significantly related to the chronotype at baseline (β = .031, p = 0.718), butage was associated with baseline hypo/manic symptoms (β = -0.167, p = 0.026). We did not perform a post-hoc Monte Carlo simulation study for this model, as we lacked the appropriate literature values to formulate a valid population model. Therefore, the power to detect effects in this model cannot be determined.
Figure 3. Bivariate latent change score model of hypo/manic symptoms and chronotype at baseline (T1) and follow-up (T2) assessments.
Discussion
The goal of this study was to dynamically model the relationship between chronotype, depressive and hypo/manic symptoms in youth with emerging mental disorders. Contrary to our expectations, we found that greater eveningness at baseline did not predict more depressive symptoms at baseline (H1), nor an increase in depressive symptoms over time (H2). We also found no support for the reciprocal relationship: higher depressive symptoms at baseline did not predict an increase in eveningness over time (H3). Against our hypothesis, change in chronotype over time was not associated with change in depressive symptoms (H4). However, our expectations of null associations between chronotype and hypo/manic symptoms were supported. We found no association between baseline chronotype and hypo/manic symptoms (H5) and no association between baseline chronotype and change in hypo/manic symptoms over time (H6).
Given the body of evidence linking eveningness to depressive symptoms (Au and Reece Citation2017; Norbury Citation2021), the lack of association between chronotype and depressive symptoms was somewhat surprising. The lack of association between eveningness and hypo/manic symptoms was less surprising, given that most clinical studies examining this have found null associations (Giglio et al. Citation2010; Kanagarajan et al. Citation2018; Mansour et al. Citation2005). Notably, the only follow-up study to explore associations between chronotype and hypo/manic symptoms (Vidafar et al. Citation2021) found that hypo/manic symptoms were related to eveningness when measured by the Longitudinal Interval Follow-Up Evaluation interview but not when using the Young Mania Rating Scale (the measure of hypo/manic symptoms used in this study).
We suggest several reasons for our null findings. First, many studies linking chronotype to mental health use chronotype categories (e.g. morning/intermediate/evening), while we used participants’ raw scores. This allowed us to avoid decisions associated with categorisations, such as determining how many categories to create and where cut-offs for these categories lie (decisions that can be sample-dependent; Natale and Cicogna Citation2002); this may have reduced the comparability of our results with the extant literature. Second, while our models have excellent fits to the data, it is possible that our study is underpowered; other prospective studies have larger sample sizes (Druiven et al. Citation2020; Vidafar et al. Citation2021). Relatedly, these studies had longer follow-up (4–7-years) and more frequent assessments; for example, Vidafar et al. (Citation2021) recorded an average of 9.9 and 3.6 assessments per participant on the PHQ-9 and YMRS, respectively. Longer, more frequent follow-up allows these studies greater opportunity to capture variability in illness. Third, chronotype may poorly predict short-term changes in depressive and hypo/manic symptoms.
Our findings should be interpreted considering several limitations. First, we relied on the MEQ to estimate chronotype, while other measures, such as the Munich ChronoType Questionnaire, have stronger construct and biological validity (Roenneberg et al. Citation2003; Santisteban et al. Citation2018). Relatedly, while the ULCS models showed that MEQ scores did reliably change across the sample (p < 0.001) and that individuals differed in the amount of change in MEQ (p < 0.001), the extent of sample-wise change was small, which likely influenced our ability to detect associations with depressive and hypo/manic symptoms. Other biologically meaningful and more variable measures of the sleep-wake cycle (e.g. actigraphy-derived sleep onset/offset, sleep midpoint) and circadian rhythm disturbance (e.g. phase angle of entrainment between endogenous phase and habitual wake time) (Robillard et al. Citation2018b) may map more closely to circadian dysregulation and be more strongly tied to dynamic features of the environment (e.g. light/dark cycle) (Wright et al. Citation2013). Such measures may therefore be better at capturing changes in mood and activation states. Moreover, chronotype itself may not be on the causal path to psychopathology; instead, it could be that evening types are more likely to experience sleep disturbances (e.g. shortened sleep duration, sleep deprivation) and misalignment (e.g. social jetlag), which were unmeasured but may be more proximal to depression and hypo/manic states compared to chronotype. Second, a version of the MEQ has been developed specifically for children and adolescents (Tonetti et al. Citation2015), and this may have been more appropriate for the subset of adolescents in our sample. Third, the HDRS does not assess atypical symptoms that could be associated with chronotype more strongly (e.g. hypersomnia). Fourth, we used a convenience sample; more studies are needed in similar early-phase cohorts. Fifth, our study did not account for the effect of other possible confounders (e.g. substance use, medication, other treatments) on mental health symptom trajectories. Sixth, while there are age-related sex differences in the chronotype (Fischer et al. Citation2017), we did not have sufficient sample size to construct separate models for each sex (bivariate models with sex as the grouping variable failed to converge). Seventh, assessments at only two time-points limited the ability to observe elevated symptoms. We will overcome these limitations and revisit this question in our Neurobiology Youth Follow-Up Study (Nichles et al. Citation2021). Finally, we found insufficient power to detect certain paths in the depressive symptom model (baseline chronotype and depressive symptoms) and did not have sufficient previous data to construct a population model for the hypo/manic symptom model, precluding a power analysis.
Although the results were against our expectations, we believe that dynamic modelling offers a novel approach to test the causal influence of chronotype on illness states. The LCS framework offers several major advantages over traditional methods (e.g. repeated-measures ANOVA). For example, they account for measurement error through specification of latent variables, the ability to model multiple kinds of developmental questions (e.g. leading-lag processes) and the capacity to examine dynamic relationships among multiple variables across multiple measurement occasions (Grimm Citation2007; Grimm and Ram Citation2018; Kievit et al. Citation2018). However, there are limitations to the LCS framework. Notably, LCS models assume that the interval between measurements is equal across individuals, which may not be the case for many studies. Continuous-time SEM is a newer, alternative approach that allows researchers encode the assessment interval. While its use remains limited, continuous-time SEM is a promising technique that could aid our understanding of time-sensitive developmental processes (Voelkle and Oud Citation2015). Secondly, the complexity of LCS models also introduces problems such as model non-convergence and misspecification. As researchers include more variables and more measurement occasions into the model, the sample size required to produce a stable estimate increases (Westland Citation2010). At the same time, larger models put more pressure on the researcher to correctly specify model parameters and constraints prior to estimation. Failing to do so can also cause model non-convergence and bias the estimates of model parameters, leading to invalid conclusions about the data (Clark et al. Citation2018). Future studies could explore the use of other longitudinal methods, such as latent transition analysis (Lanza et al. Citation2013), which are better suited to modelling changes in category membership (e.g. chronotype category) over time.
Altogether, our findings suggest that the relationship between chronotype and prospective changes in depressive and hypo/manic symptoms may require more frequent assessments to observe, and that chronotype may have limited utility for predicting short-term changes in clinical states among young people with emerging mental disorders. We encourage researchers in this area to use dynamic modelling to examine relationships among chronotype and illness states in a more flexible and nuanced way than traditional techniques allow.
Author contributions (contributor roles taxonomy)
TW: Formal analysis; methodology; software; visualization; writing – original draft; writing – review & editing. JSC: Investigation; writing – review & editing. EMS: Funding acquisition; investigation; project administration; writing – review & editing. AJG: Investigation; writing – review & editing. PV: Writing – review & editing. JS: Writing – review & editing. DFH: Funding acquisition; investigation; project administration; writing – review & editing. IBH: Conceptualization; funding acquisition; investigation; project administration; resources; supervision; writing – review & editing. JJC: Conceptualization; formal analysis; funding acquisition; investigation; methodology; supervision; visualization; writing – original draft; writing – review & editing.
Supplemental Material
Download PDF (572.6 KB)Acknowledgments
The authors acknowledge the Gadigal people of the Eora nation, upon whose ancestral lands our research was conducted; we pay our respect to elders past and present; and we acknowledge all First Nations Australians, in their ongoing struggles for sovereignty and justice. Finally, we express our gratitude to the young people who participated in this research.
Disclosure statement
The authors declare that there are no competing financial interests in relation to the work described. Potential conflicts of interest may arise from the following: IBH is the Co-Director, Health and Policy at the Brain and Mind Centre (BMC) University of Sydney, Australia. The BMC operates an early-intervention youth services at Camperdown under contract to headspace. IBH has previously led community-based and pharmaceutical industry-supported (Wyeth, Eli Lily, Servier, Pfizer, AstraZeneca) projects focused on the identification and better management of anxiety and depression. He is the Chief Scientific Advisor to, and a 3.2% equity shareholder in, InnoWell Pty Ltd. InnoWell was formed by the University of Sydney (45% equity) and PwC (Australia; 45% equity) to deliver the $30 M Australian Government-funded Project Synergy (2017-20) and to lead transformation of mental health services internationally through the use of innovative technologies. EMS is the Medical Director, Young Adult Mental Health Unit, St Vincent’s Hospital Darlinghurst, Discipline Leader of Adult Mental Health, School of Medicine, University of Notre Dame, Research Affiliate, The University of Sydney and Consultant Psychiatrist. She has received honoraria for educational seminars related to the clinical management of depressive disorders supported by Servier and Eli-Lilly pharmaceuticals. She has participated in a national advisory board for the antidepressant compound Pristiq, manufactured by Pfizer. She was the National Coordinator of an antidepressant trial sponsored by Servier.
Supplementary data
Supplemental data for this article can be accessed online at https://doi.org/10.1080/07420528.2023.2203241.
Additional information
Funding
References
- Antypa N, Vogelzangs N, Meesters Y, Schoevers R, Penninx BWJH. 2016. Chronotype associations with depression and anxiety disorders in a large cohort study. Depress Anxiety. 33:75–83. doi:10.1002/da.22422
- Au J, Reece J. 2017. The relationship between chronotype and depressive symptoms: A meta-analysis. J Affect Disord. 218:93–104. doi:10.1016/j.jad.2017.04.021
- Clark DA, Nuttall AK, Bowles RP. 2018. Misspecification in latent change score models: Consequences for parameter estimation, model evaluation, and predicting change. Multivariate Behav Res. 53:172–189. doi:10.1080/00273171.2017.1409612
- Crouse JJ, Carpenter JS, Song YJC, Hockey SJ, Naismith SL, Grunstein RR, Scott EM, Merikangas KR, Scott J, Hickie IB. 2021. Circadian rhythm sleep-wake disturbances and depression in young people: Implications for prevention and early intervention. Lancet Psychiatry. 8:813–823. doi:10.1016/S2215-0366(21)00034-1
- Crouse JJ, Chitty KM, Iorfino F, Carpenter JS, White D, Nichles A, Zmicerevska N, Tickell AM, Lee RSC, Naismith SL, et al. 2020a. Transdiagnostic neurocognitive subgroups and functional course in young people with emerging mental disorders: A cohort study. BJPsych Open. 6:e31. doi:10.1192/bjo.2020.12
- Crouse JJ, Chitty KM, White D, Lee RSC, Moustafa AA, Naismith SL, Scott J, Hermens DF, Hickie IB. 2020b. Modelling change in neurocognition, symptoms and functioning in young people with emerging mental disorders. J Psychiatr Res. 131:22–30. doi:10.1016/j.jpsychires.2020.08.028
- Druiven SJM, Hovenkamp-Hermelink JHM, Knapen SE, Kamphuis J, Haarman BCM, Penninx BWJH, Antypa N, Meesters Y, Schoevers RA, Riese H. 2020. Stability of chronotype over a 7-year follow-up period and its association with severity of depressive and anxiety symptoms. Depress Anxiety. 37:466–474. doi:10.1002/da.22995
- Facer-Childs ER, Middleton B, Skene DJ, Bagshaw AP. 2019. Resetting the late timing of ‘night owls’ has a positive impact on mental health and performance. Sleep Med. 60:236–247. doi:10.1016/j.sleep.2019.05.001
- Fischer D, Lombardi DA, Marucci-Wellman H, Roenneberg T. 2017. Chronotypes in the US – Influence of age and sex. Plos One. 12:e0178782. doi:10.1371/journal.pone.0178782
- Giglio LMF, Magalhães PVS, Andersen ML, Walz JC, Jakobson L, Kapczinski F. 2010. Circadian preference in bipolar disorder. Sleep Breathing. 14:153–155. doi:10.1007/s11325-009-0301-3
- Grimm KJ. 2007. Multivariate longitudinal methods for studying developmental relationships between depression and academic achievement. Int J Behav Dev. 31:328–339. doi:10.1177/0165025407077754
- Grimm K, Ram N. 2018. Latent growth and dynamic structural equation models. Annu Rev Clin Psychol. 14:55–89. doi:10.1146/annurev-clinpsy-050817-084840
- Hamilton M. 1960. A rating scale for depression. J Neurol Neurosurg Psychiatry. 23:56–62. doi:10.1136/jnnp.23.1.56
- Haraden DA, Mullin BC, Hankin BL. 2017. The relationship between depression and chronotype: A longitudinal assessment during childhood and adolescence. Depress Anxiety. 34:967–976. doi:10.1002/da.22682
- Hickie IB, Merikangas KR, Carpenter JS, et al. 2023. Does circadian dysrhythmia drive the switch into high or low activation states in bipolar I disorder? Bipolar Disord. 1–9. doi:10.1111/bdi.13304
- Hoe M, Nakagami E, Green MF, Brekke JS. 2012. The causal relationships between neurocognition, social cognition and functional outcome over time in schizophrenia: A latent difference score approach. Psychol Med. 42:2287–2299. doi:10.1017/S0033291712000578
- Horne JA, Östberg O. 1976. A self-assessment questionnaire to determine morningness-eveningness in human circadian rhythms. Int J Chronobiol. 4:97–110.
- Jones SE, Lane JM, Wood AR, van Hees VT, Tyrrell J, Beaumont RN, Jeffries AR, Dashti HS, Hillsdon M, Ruth KS, et al. 2019. Genome-wide association analyses of chronotype in 697,828 individuals provides insights into circadian rhythms. Nat Commun. 10:343. doi:10.1038/s41467-018-08259-7
- Kanagarajan K, Gou K, Antinora C, Buyukkurt A, Crescenzi O, Beaulieu S, Storch KF, Mantere O. 2018. Morningness-Eveningness questionnaire in bipolar disorder. Psychiatry Res. 262:102–107. doi:10.1016/j.psychres.2018.02.004
- Kievit RA, Brandmaier AM, Ziegler G, van Harmelen AL, de Mooij SMM, Moutoussis M, Goodyer IM, Bullmore E, Jones PB, Fonagy P, et al. 2018. Developmental cognitive neuroscience using latent change score models: A tutorial and applications. Dev Cogn Neurosci. 33:99–117. doi:10.1016/j.dcn.2017.11.007
- Kline RB. 2011. Principles and practice of structural equation modeling. 3rd ed. New York, NY: Guildford Press.
- Lanza ST, Bray BC, Collins LM. 2013. An introduction to latent class and latent transition analysis. In: Schinka JA, Velicer WF Weiner IB, editors. Handbook of psychology. Hoboken, NJ: Wiley; pp. 691–716.
- Lee RSC, Hermens DF, Naismith SL, Kaur M, Guastella AJ, Glozier N, Scott J, Scott EM, Hickie IB. 2018. Clinical, neurocognitive and demographic factors associated with functional impairment in the Australian brain and mind youth cohort study (2008-2016). BMJ Open. 8:e022659. doi:10.1136/bmjopen-2018-022659
- Logan RW, McClung CA. 2019. Rhythms of life: Circadian disruption and brain disorders across the lifespan. Nat Rev Neurosci. 20:49–65. doi:10.1038/s41583-018-0088-y
- Lukasiewicz M, Gerard S, Besnard A, Falissard B, Perrin E, Sapin H, Tohen M, Reed C, Azorin J-M, Group TES. 2013. Young mania rating scale: How to interpret the numbers? Determination of a severity threshold and of the minimal clinically significant difference in the EMBLEM cohort. Int J Methods Psychiatr Res. 22:46–58. doi:10.1002/mpr.1379
- Mansour HA, Wood J, Chowdari KV, Dayal M, Thase ME, Kupfer DJ, Monk TH, Devlin B, Nimgaonkar VL. 2005. Circadian phase variation in bipolar I disorder. Chronobiol Int. 22:571–584. doi:10.1081/CBI-200062413
- McCarthy MJ, Gottlieb JF, Gonzalez R, McClung CA, Alloy LB, Cain S, Dulcis D, Etain B, Frey BN, Garbazza C, et al. 2022. Neurobiological and behavioral mechanisms of circadian rhythm disruption in bipolar disorder: A critical multi-disciplinary literature review and agenda for future research from the ISBD task force on chronobiology. Bipolar Disord. 24:232–263. doi:10.1111/bdi.13165
- McCarthy MJ, Wei H, Nievergelt CM, Stautland A, Maihofer AX, Welsh DK, Shilling P, Alda M, Alliey-Rodriguez N, Anand A, et al. 2019. Chronotype and cellular circadian rhythms predict the clinical response to lithium maintenance treatment in patients with bipolar disorder. Neuropsychopharmacology. 44:620–628. doi:10.1038/s41386-018-0273-8
- Melo MCA, Abreu RLC, Linhares Neto VB, de Bruin PFC, de Bruin VMS. 2017. Chronotype and circadian rhythm in bipolar disorder: A systematic review. Sleep Med Rev. 34:46–58. doi:10.1016/j.smrv.2016.06.007
- Merikanto I, Lahti T, Kronholm E, Peltonen M, Laatikainen T, Vartiainen E, Salomaa V, Partonen T. 2013. Evening types are prone to depression. Chronobiol Int. 30:719–725. doi:10.3109/07420528.2013.784770
- Merikanto I, Partonen T. 2021. Eveningness increases risks for depressive and anxiety symptoms and hospital treatments mediated by insufficient sleep in a population-based study of 18,039 adults. Depress Anxiety. 38:1066–1077. doi:10.1002/da.23189
- Meyrel M, Scott J, Etain B. 2022. Chronotypes and circadian rest–activity rhythms in bipolar disorders: A meta-analysis of self- and observer rating scales. Bipolar Disord. 24:286–297. doi:10.1111/bdi.13122
- Murray G, Gottlieb J, Hidalgo MP, Etain B, Ritter P, Skene DJ, Garbazza C, Bullock B, Merikangas K, Zipunnikov V, et al. 2020. Measuring circadian function in bipolar disorders: Empirical and conceptual review of physiological, actigraphic, and self-report approaches. Bipolar Disord. 22:693–710. doi:10.1111/bdi.12963
- Natale V, Cicogna P. 2002. Morningness-eveningness dimension: Is it really a continuum? Pers Individ Dif. 32:809–816. doi:10.1016/S0191-8869(01)00085-X
- Nichles A, Zmicerevska N, Song YJC, Wilson C, McHugh C, Hamilton B, Crouse J, Rohleder C, Carpenter JS, Ho N, et al. 2021. Neurobiology youth follow-up study: Protocol to establish a longitudinal and prospective research database using multimodal assessments for current and past mental health treatment-seeking young people within an early intervention service. BMJ Open. 11:e044731. doi:10.1136/bmjopen-2020-044731
- Norbury R. 2021. Diurnal preference and depressive symptomatology: A meta-analysis. Sci Rep. 11:12003. doi:10.1038/s41598-021-91205-3
- Pornprasertmanit S, Miller P, Schoemann A, Jorgensen TD. 2021. simsem: SIMulated Structrual Equation Modeling.
- R Core Team. 2022. R: A language and environment for statistical computing. Vienna, Austria: R Foundation for Statistical Computing.
- Robillard R, Carpenter JS, Feilds K, Hermens DF, White D, Naismith SL, Bartlett D, Whitwell B, Southan J, Scott EM, et al. 2018a. Parallel changes in mood and melatonin rhythm following an adjunctive multimodal chronobiological intervention with agomelatine in people with depression: A proof of concept open label study. Front Psychiatry. 9. doi:10.3389/fpsyt.2018.00624
- Robillard R, Carpenter JS, Rogers NL, Fares S, Grierson AB, Hermens DF, Naismith SL, Mullin SJ, Feilds KL, Glozier N, et al. 2018b. Circadian rhythms and psychiatric profiles in young adults with unipolar depressive disorders. Transl Psychiatry. 8:213. doi:10.1038/s41398-018-0255-y
- Robillard R, Oxley C, Hermens DF, White D, Wallis R, Naismith SL, Whitwell B, Southan J, Scott EM, Hickie IB. 2016. The relative contributions of psychiatric symptoms and psychotropic medications on the sleep-wake profile of young persons with anxiety, depression and bipolar disorders. Psychiatry Res. 243:403–406. doi:10.1016/j.psychres.2016.06.025
- Roenneberg T. 2015. Having trouble typing? What on Earth is chronotype? J Biol Rhythms. 30:487–491. doi:10.1177/0748730415603835
- Roenneberg T, Kuehnle T, Pramstaller PP, Ricken J, Havel M, Guth A, Merrow M. 2004. A marker for the end of adolescence. Curr Biol. 14:R1038–1039. doi:10.1016/j.cub.2004.11.039
- Roenneberg T, Merrow M. 2007. Entrainment of the human circadian clock. Cold Spring Harb Symp Quant Biol. 72:293–299. doi:10.1101/sqb.2007.72.043
- Roenneberg T, Wirz-Justice A, Merrow M. 2003. Life between clocks: Daily temporal patterns of human chronotypes. J Biol Rhythms. 18:80–90. doi:10.1177/0748730402239679
- Rosseel Y. 2012. Lavaan: An R package for structural equation modeling. J Stat Softw. 48:1–36. doi:10.18637/jss.v048.i02
- Santisteban JA, Brown TG, Gruber R. 2018. Association between the munich chronotype questionnaire and wrist actigraphy. Sleep Disord. 2018:5646848. doi:10.1155/2018/5646848
- Savalei V, Rosseel Y. 2022. Computational options for standard errors and test statistics with incomplete normal and nonnormal data in SEM. Struct Equation Model: Multidiscip J. 29:163–181. doi:10.1080/10705511.2021.1877548
- Scott J, Etain B, Miklowitz D, Crouse JJ, Carpenter J, Marwaha S, Smith D, Merikangas K, Hickie I. 2022. A systematic review and meta-analysis of sleep and circadian rhythms disturbances in individuals at high-risk of developing or with early onset of bipolar disorders. Neurosci Biobehav Rev. 135:104585. doi:10.1016/j.neubiorev.2022.104585
- Scott EM, Hermens DF, Glozier N, Naismith SL, Guastella AJ, Hickie IB. 2012. Targeted primary care-based mental health services for young Australians. Med J Aust. 196:136–140. doi:10.5694/mja11.10481
- Tonetti L, Adan A, Di Milia L, Randler C, Natale V. 2015. Measures of circadian preference in childhood and adolescence: A review. Eur Pscyhiatry. 30:576–582. doi:10.1016/j.eurpsy.2015.01.006
- Vidafar P, Yocum AK, Han P, McInnis MG, Burgess HJ. 2021. Late chronotype predicts more depressive symptoms in bipolar disorder over a 5 year follow-up period. Int J Bipolar Disord. 9:28. doi:10.1186/s40345-021-00233-5
- Voelkle MC, Oud JHL. 2015. Relating latent change score and continuous time models. Struct Equation Model: Multidiscip J. 22:366–381. doi:10.1080/10705511.2014.935918
- Wang YA, Rhemtulla M. 2021. Power analysis for parameter estimation in structural equation modeling: A discussion and tutorial. Adv Methods Pract Psycholog Sci. 4:2515245920918253. doi:10.1177/2515245920918253
- Westland JC. 2010. Lower bounds on sample size in structural equation modeling. Electron Commer Res Appl. 9:476–487. doi:10.1016/j.elerap.2010.07.003
- Wright KP Jr., McHill AW, Birks BR, Griffin BR, Rusterholz T, Chinoy ED. 2013. Entrainment of the human circadian clock to the natural light-dark cycle. Curr Biol. 23:1554–1558. doi:10.1016/j.cub.2013.06.039
- Wulff K, Gatti S, Wettstein JG, Foster RG. 2010. Sleep and circadian rhythm disruption in psychiatric and neurodegenerative disease. Nat Rev Neurosci. 11:589–599. doi:10.1038/nrn2868
- Young R, Biggs J, Ziegler V, Meyer D. 1978. A rating scale for mania: Reliability, validity and sensitivity. Br J Psychiatry. 133:429–435. doi:10.1192/bjp.133.5.429
- Yuan K-H, Bentler PM. 2000. 5. Three likelihood-based methods for mean and covariance structure analysis with nonnormal missing data. Sociol Methodol. 30:165–200. doi:10.1111/0081-1750.00078
- Zimmerman M, Martinez JH, Young D, Chelminski I, Dalrymple K. 2013. Severity classification on the hamilton depression rating scale. J Affect Disord. 150:384–388. doi:10.1016/j.jad.2013.04.028