
ABSTRACT
The irregular eating patterns of both shift workers and evening chronotypes adversely affect cardiometabolic health. A tool that conveniently captures temporal patterns of eating alongside an indicator of circadian rhythm such as chronotype will enable researchers to explore relationships with diverse health outcome measures. We aimed to investigate the test-retest reliability and convergent validity of a Chrononutrition Questionnaire (CNQ) that captures temporal patterns of eating and chronotype in the general population (non-shift workers, university students, retirees, unemployed individuals) and shift work population. Participants attended two face-to-face/virtual sessions and completed the CNQ and food/sleep/work diaries. Outcomes included subjective chronotype, wake/sleep/mid-sleep time, sleep duration, meal/snack regularity, meal/snack/total frequency, times of first/last/largest eating occasions (EO), main meal (MM) 1/2/3, and duration of eating window (DEW). 116 participants enrolled (44.5 ± 16.5 years, BMI: 27.3 ± 5.8 kg/m2, 73% female, 52% general population); 105 completed the study. Reliability was acceptable for chronotype, sleep, and all temporal eating patterns except on night shifts. Convergent validity was good for chronotype and sleep except for certain shift/shift-free days. Generally, meal/snack regularity and frequency, and times of first/last EO showed good validity for the general population but not shift workers. Validity was good for DEW (except work-free days and afternoon shifts) and times of MM 1/2/3 (except afternoon and night shifts), while time of largest EO had poor validity. The CNQ has good test-retest reliability and acceptable convergent validity for the general and shift work population, although it will benefit from further validation, especially regarding regularity, frequency, and times of first and last eating occasions across more days amongst a larger sample size of shift workers. Use of the CNQ by researchers will expand our current understanding of chrononutrition as relationships between timing of food intake and the multitude of health outcomes are examined.
Introduction
When we eat may be as important as what we eat for optimal cardiometabolic health. Eating later rather than earlier in the day and over extended periods is linked with impaired glycaemic control and obesity (Leung et al. Citation2020; Popp et al. Citation2021). In contrast, time-restricted eating has shown in meta-analyses to achieve similar weight loss to continuous energy restriction (Elortegui Pascual et al. Citation2023), and improve blood pressure, glucose, and lipid profile (Liu et al. Citation2022; Moon et al. Citation2020). These data show that efficiency of metabolic processes are aligned with the 24-h day (Bonham et al. Citation2019; Poggiogalle et al. Citation2018) due to our circadian rhythm (Johnston et al. Citation2016). Hence, long-term consequences of eating outside typical diurnal rhythms manifest as higher rates of chronic disease, as observed in shift workers (Hemmer et al. Citation2021). Similar consequences are also observed in non-shift workers, particularly among evening chronotypes (i.e., those with a later circadian preference who eat later in the day) through poorer weight loss success (Garaulet et al. Citation2013) and greater odds of obesity (Xiao et al. Citation2019). In all, these data support the American Heart Association (AHA) recommendation to optimise timing, regularity, and frequency of food intake, or chrononutrition, to better manage cardiometabolic disease risk (St-Onge et al. Citation2017).
However, accurate assessment of these temporal eating aspects is challenging. Current approaches to describe temporal patterns involve food diaries or phone applications that time-stamp food intake (Gill and Panda Citation2015; Shaw et al. Citation2019). However, they can be burdensome for participants and tedious for researchers in large studies (Ortega et al. Citation2015) or where participants’ workplaces prohibit use of electronic devices (e.g., military bases). Furthermore, electronic methods to assess consumption patterns (i.e., timing, frequency, regularity, spacing, skipping) were found to be unvalidated (Pendergast et al. Citation2017). Reviews of temporal eating patterns concluded that dietary assessment tools were heterogenous, preventing data aggregation, meta-analysis (Peplonska et al. Citation2019), and direct comparisons between studies (Mazri et al. Citation2019; Phoi et al. Citation2021). Conventional dietary assessment tools were simply not designed to capture meal timings or identify variability between days (Almoosawi et al. Citation2019). Moving forward, a standardized approach to data collection on temporal eating patterns is warranted to understand its impact on health and develop national guidelines regarding optimal meal timing. We developed a Chrononutrition Questionnaire (CNQ) for this purpose.
Through a scoping review, we identified relevant aspects of temporal eating patterns: meal timings, duration of eating window, and meal regularity (Phoi et al. Citation2021). We discussed reasons they should be characterised in relation to sleep/wake times and individual circadian timing preferences, in the form of chronotype (Roenneberg and Merrow Citation2016; Roenneberg et al. Citation2003). It is also important that the CNQ is suitable for shift workers, who form 15–20% of the workforce (Ker et al. Citation2010) and whose longer eating windows (Terada et al. Citation2019) and common practice of eating late on night shifts (Kosmadopoulos et al. Citation2020; Lauren et al. Citation2020; Molzof et al. Citation2017; Shaw et al. Citation2019) increase their health risk. Finally, in a Delphi study, experts provided feedback on the CNQ, which achieved content validation after three rounds (Phoi et al. Citation2021).
To our knowledge, only four questionnaires to date capture temporal eating patterns (Bertéus Forslund et al. Citation2002; Chakradeo et al. Citation2021; Gioia et al. Citation2022; Veronda et al. Citation2020). However, they have not been validated to capture chronotype, and do not identify all aspects of temporal eating patterns (e.g., regularity) or variability in food intake across shift types for shift workers (Chakradeo et al. Citation2021; Veronda et al. Citation2020). Hence, we aimed to validate our CNQ, which identifies temporal patterns of eating, sleep/wake times, and chronotype against gold standard measures of dietary intake (food diaries) and sleep patterns (sleep diaries), in both shift and non-shift working individuals. The use of this questionnaire is multi-pronged; it will assist researchers in exploring relationships between timing of food intake and disease development or to assess compliance to time-restricted feeding protocols, clinicians may use it as a periodic assessment tool to monitor changes in temporal eating patterns and effects on health indicators like glucose levels, and shift work industries may use it as a screening tool to identify employees with suboptimal temporal eating patterns who require nutritional intervention.
Materials and methods
Recruitment and participants
The study population consisted of individuals from the general population (non-shift workers, university students, retirees, and unemployed individuals) and shift work population (shift workers who performed morning, afternoon, night or split shifts). They were recruited from the University of South Australia (UniSA), the public, and shift work industries across South Australia and Victoria through a combination of e-mails, flyers, and Facebook posts, which linked volunteers to a participant information sheet and a screening questionnaire. Individuals deemed eligible were contacted to schedule their first visit. Individuals 18 years or older and who were able to read and write English were included; exclusion criteria were determined prior to recruitment of participants and are listed in . The study was approved by the University of South Australia Human Research Ethics Committee (register number 203281).
Figure 1. Flow diagram of individuals who underwent screening, enrolment, and completed the study, including exclusion criteria.
Study procedure
Participants attended two visits during the study period, either in a clinic at the University of South Australia City East Campus or online via Zoom. At their first visit, participants provided informed consent and demographic information; including date of birth, gender, ethnicity, height, and weight. Participants who attended clinic visits had height measured twice to the nearest 1 mm using a stadiometer (SECA 216 Height Measuring Rod, SECA) and body weight measured twice to the nearest 100 g using calibrated electronic scales (TANITA Ultimate Scale 2000, Tanita Corporation, Tokyo, Japan) while individuals who participated online estimated their height and weight; the values were averaged and used to calculate body mass index (BMI). They were then asked to fill in the CNQ and a feedback form regarding its usability. These data were all collected using REDCap – a secure web-based interface for research data collection (Harris et al. Citation2009, Citation2019). Participants were then provided either hard or soft copies of the 7-day food diary, 14-day work diary, and 14-day sleep diary with instructions on completion prior to their second visit.
Visit two was scheduled two weeks after visit one. The diaries were checked for details with the participants and any incomplete entries clarified and updated. Participants were then asked to fill in the CNQ and feedback form on REDCap for a second time. Test conditions were kept similar to the first visit in terms of instructions provided and environmental setting. Participants were also reminded not to recall answers that they input into the questionnaire at their first visit, to maintain independence of each administration.
Measures
CNQ
Questions were based on findings of our scoping review (Phoi et al. Citation2021) and adjusted according to recommendations by experts in circadian biology and chrononutrition from our Delphi study (Phoi et al. Citation2021). Participants were asked in three separate sections about their: 1) wake and sleep times, 2) regularity of meals and snacks, 3) time of main meals and snacks, and time of largest meal. Each of these aspects were identified on each of work/school (i.e., tertiary education) and work-free/school-free days for non-shift workers, and morning/afternoon/night/split shift days (as relevant) and work-free days for shift workers. The language and format of the questionnaire were also refined by the expert panel to optimise readability and understanding, especially to minimise error when responses were answered by participants. A small but key format deviation from the Delphi study recommendations is the use of 24-h time instead of am/pm format, as REDCap does not support collection of time in am/pm format. Refer to Supplementary A for the CNQ, and Supplementary B for definition of terms used in the CNQ.
Feedback form for the CNQ
In order to capture face validity of the CNQ to a layperson based on readability, clarity of language and consistency of format (Taherdoost Citation2016), participants were asked whether: 1) the questions asked were clear, 2) the language used was easy to understand, and 3) the format of the questionnaire made it easy to answer. They were asked to rate each question on a Likert scale ranging from strongly disagree (1) to strongly agree (5), and to provide any written feedback they had in a free text box.
7-day food diary
Whilst there is no “gold-standard” reference method for assessing the timings of energy consumption, 7-day food diaries identify differences in food intake across the week, and timing and pattern of daily food intake (Stephen Citation2007). Additionally, they overcome the limitations of single 24-h dietary recalls and food frequency questionnaires and have been used by studies to characterise meal patterns (Leech et al. Citation2015b). Participants were provided with 7-day food diaries and asked to record every food or drink that they consumed over seven consecutive days. Weighing of food was not required, but portion size estimates were encouraged based on standard household measures such as cups and spoons. A pamphlet was provided that contained pictures to aid in estimation of portion sizes. Participants were asked to indicate clock times of eating occasions based on the start time of eating, and to label each eating event as a main meal (i.e., breakfast, lunch, and dinner/supper) or snack (i.e., food or drink consumed outside of main meals). All eating occasions were asked to be recorded, including non-caloric drinks (such as water or black tea). Cooking methods and brands of food/drink were encouraged to be recorded.
14-day sleep diary
Sleep diaries of at least one week are the gold standard for subjective sleep assessment (Buysse et al. Citation2006) and have been used as continuous assessment methods to determine the validity of other questionnaires concerning sleep-wake behaviour in healthy adults and shift workers (Juda et al. Citation2013; Monk et al. Citation2003). Participants were provided with sleep diaries to record every sleep episode, including major sleeps and naps. Participants noted start date and time of sleep (i.e., the time that participant starts attempting to sleep), time taken to fall asleep, end date and time of sleep, and whether an alarm clock was used to wake up. Mid-sleep time on free days corrected for sleep debt (MSFSC) was used to determine an estimation of chronotype based on the Munich Chronotype Questionnaire, where use of alarm clock to wake on free days precludes it from being used to calculate chronotype (Roenneberg et al. Citation2007).
14-day work diary
Participants noted down the start date and time, and end date and time of each work episode. Shift workers additionally indicated if the work episode was a morning, afternoon, night shift, or split shift. The work diary allows for information collected from the food and sleep diaries to be categorised according to their relevant work/school/shift day or work/school/shift-free day types for analysis against data collected by the CNQ.
Preparing the data for analysis
Data from sleep diaries were entered into Excel and cleaned; times were converted to decimal hours. Sleep episodes were coded by day type (e.g., morning shift or free day). For each sleep episode, based on sleep and wake times, the following variables were calculated: sleep duration, mid-sleep time, and chronotype (Table S1). These variables were similarly extracted and calculated from REDCap-exported Excel files.
Data from food diaries were entered into Foodworks 10 Professional (Citation2019), cleaned, and all eating occasions of ≤210 kJ were removed (Leech et al. Citation2015a). Each day’s entry was coded by day type. The following data were extracted from Foodworks into Excel: time of first eating occasion, last eating occasion, largest eating occasion (based on energy), times of main meals, and times of snacks. They allowed calculation of: duration of eating window; meal, snack, and total frequency; and meal and snack regularity (Table S1). With the exception of meal and snack regularity, these variables were similarly extracted and calculated from REDCap-exported Excel files. Refer to Supplementary Information for a detailed step-by-step guide of how data was managed.
is a summary of outcomes and final variables of interest derived from sleep diaries, food diaries, and REDCAP that were used in analyses of test-retest, convergent validity, and Bland Altman analyses.
Table 1. Data sources and variables included in analyses. A shift worker may perform one or more of: morning shift, afternoon shift, and night shift.
Data analysis
Test-retest reliability and convergent validity were conducted following the COSMIN Study Design checklist for Patient-reported outcome measurement instruments (Mokkink et al. Citation2019).
Test-retest reliability was calculated to examine the degree to which values provided on the CNQ were stable over a designated timeframe (Mokkink et al. Citation2019). Intraclass correlation coefficients (ICCs) were calculated for continuous variables (model: two-way mixed effects model, type: average measurement, definition: absolute agreement) and weighted Kappa were calculated for categorical values (Portney and Watkins Citation2015), along with their 95% confidence intervals. ICCs described the extent of correlation and the agreement between the measurements (Koo and Li Citation2016), and reliability for values ≥ 0.75 was interpreted as excellent, 0.40–0.75 as fair to good, and < 0.40 as poor (Fleiss Citation1999). Strength of agreement for Kappa values ≥ 0.81 was interpreted as almost perfect; 0.61–0.80 as substantial; 0.41–0.60 as moderate, 0.21–0.40 as fair, and 0.00–0.20 as slight (Landis and Koch Citation1977).
Convergent validity of CNQ variables was examined through correlations with variables from the food and sleep diaries that capture the same constructs (Portney and Watkins Citation2015). Spearman’s rho with 95% confidence intervals (CI) (Caruso & Cliff method) was calculated, and effect sizes < 0.30 were interpreted as weak, 0.30–0.49 as moderate, and > 0.50 as large (Hays Citation1981; Howell Citation1997). Bland-Altman plots were used to quantify the agreement and variability, calculating the differences (and 95% CI) between analogous CNQ and food/sleep diary variables relative to their averages.
Descriptive statistics are presented as means and standard deviation for the study population overall, and separately for the general and shift work populations. Consistent with the approach to MCTQ analyses (Roenneberg Citation2015) and with findings from our scoping review (Phoi et al. Citation2021), chronotype cut-offs (“morning,” “intermediate,” or “evening” chronotype) were identified by splitting the MSFSC distribution of the study population (i.e. across all participants) into thirds.
Descriptive statistics (means and standard deviations) are presented to describe participant response in the feedback form for the CNQ (questions about question clarity, ease of understanding, and format). Paired samples t-tests were used to compare responses at baseline and after 2-weeks.
The COSMIN Study Design checklist for Patient-reported outcome measurement instruments (Mokkink et al. Citation2019) recommended a sample size of ≥ 100 individuals for testing of construct validity and reliability. Data availability was maximised by employing pairwise deletion for each variable. The sample size used in the analysis of each variable is listed alongside results.
Results
226 individuals underwent screening, 43 were ineligible and 67 declined to participate, leaving 116 participants enrolled; a total of 105 participants completed both visits (). Participant demographics of completers are reported in with age ranging between 18–83 years and BMI between 17.3–44.0 kg/m2. 74% of participants were female, and 69% were of North-West European descent. The majority (59%) of people from the general population worked. Among the general population, 47% of participants were relative “morning” types compared to 20% of the shiftwork group. Conversely, 47% of shift workers were relative “evening” types compared to 26% of the general population. Among the shift workers, the most common shift type was night shift (37%), followed by morning (34%), and afternoon (28%) shift (). As only two individuals performed split shift, their free-day data were included in analysis, but not data on split shifts. Chronotype cut-offs for our total study population were morning (MSFSC <02:45 h), intermediate (02:45–03:40 h) and late chronotypes (MSFSC ≥03:41 h).
Table 2. Demographic details at baseline. *A shift worker may perform one or more of: morning shift, afternoon shift, and night shift. #Categories for ethnicity were derived from the Australian standard classification of cultural and ethnic groups 2019 (Statistics Citation2019). ^Calculated based on data from the CNQ by splitting MSFSC distribution of the study population in thirds; chronotype could not be calculated for all shift workers as insufficient information was provided about work schedule.
Chronotype, sleep, and temporal patterns of eating
Using the data from the CNQ or sleep diary, the average estimated chronotype (MSFSC) was not significantly different for shift workers (CNQ: 03:29 h, sleep diary: 03:48 h, p = 0.318) or individuals from the general population (CNQ: 03:02 h, sleep diary: 03:02 h, p = 0.908). For the general population, sleep diaries yielded later sleep time (p = 0.006), wake time (p = 0.015), and mid-sleep time (p = 0.001) on workdays and shorter sleep duration on work-free days (p = 0.04) than the CNQ (). For shift workers, sleep duration was shorter on night shifts when measured using sleep diaries compared to the CNQ (p = 0.04) ().
Table 3. Sleep variables derived from CNQ compared to sleep diaries for General Population and for shift workers on morning, afternoon, and night shifts, and their following days off. Columns show mean values from the CNQ and Bland-Altman-calculated mean differences (Diff=sleep Diary-CNQ) and the range of the 95% confidence intervals (CI range=CI upper limit – CI lower limit). Bolded values show results of paired samples t-tests comparing CNQ and diary values that were significantly different, p < 0.05. Sample sizes less than 10 are marked with an ^.
Compared to food diaries, CNQ responses resulted in significantly greater meal and snack regularity values on night shifts and across the week for the general population (snack regularity greater only on free days) and lower total frequency on morning shifts. The CNQ also captured a significantly later time of largest eating occasion across the week for the general population and on shift-free days, later time of main meal 2 on workdays of the general population and on night shifts, earlier time of main meal 1 on afternoon shifts and first eating occasion on shift-free days, longer duration of eating window on afternoon shifts and shift-free days, and shorter duration of eating window on night shifts ().
Table 4. Temporal patterns of eating variables derived from CNQ compared to food diaries for General Population. Columns show mean values from the CNQ, Bland-Altman-calculated mean differences (Diff = Food Diary-CNQ), and the range of the 95% confidence intervals (95%CI range = CI upper limit – CI lower limit). Bolded values show results of paired samples t-tests comparing CNQ and diary values that were significantly different, p < 0.05. n/a: Bland Altman analyses and 95% CI not calculated for regularity as it was a categorical variable.
Table 5. Temporal patterns of eating variables derived from CNQ compared to food diaries for shift workers on morning, afternoon, and night shifts, and days off. Columns show mean values from the CNQ, Bland-Altman-calculated mean differences (Diff = Food Diary-CNQ), and the range of the 95% confidence intervals (95%CI range = CI upper limit – CI lower limit). Bolded values show results of paired samples t-tests comparing CNQ and diary values that were significantly different, p < 0.05. Sample sizes less than 10 are marked with an ^. n/a: Bland Altman analyses and 95% CI not calculated for regularity as it was a categorical variable.
Test re-test reliability
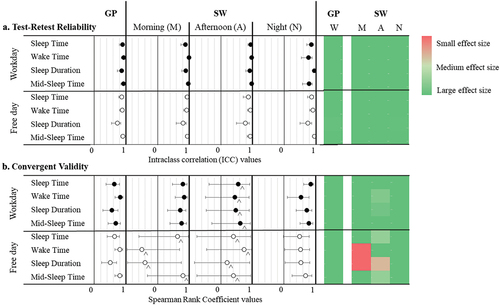
Sleep variables (sleep time, wake time, sleep duration, and mid-sleep time) for the general population and shift work population on all work/school/shift and respective free days showed good to excellent reliability (Table S2 and ). Chronotype also had excellent reliability for both groups, with high ICC values (General population: 0.888, 95% CI: 0.811–0.934; Shift work population: 0.887, 95% CI: 0.732–0.952).
Figure 2. (a) Test-retest reliability of sleep variables represented on the left as a box (ICC) and whiskers (upper and lower confidence intervals) plot and on the right as heat map, ranging from dark green (excellent reliability) to red (poor reliability). (b) Convergent validity of sleep variables represented on the left as a box (rs) and whiskers (upper and lower confidence intervals) plot and on the right as heat map, ranging from dark green (large effect size) to red (small effect size). Sample sizes less than 10 are marked with a ^. GP: general population; SW: shift worker; W: workday.
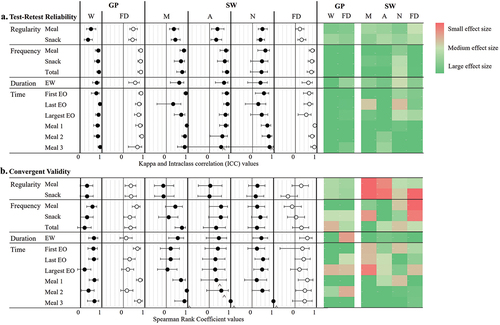
In terms of temporal aspects of eating (Table S3 and ), meal and snack regularity showed fair to moderate reliability across all day types in the general and shift work population (p < 0.05). Meal, snack, and total frequency; time of first, last, and largest eating occasion; and duration of eating window all showed good to excellent reliability for the general population and shift workers on morning shift, afternoon shift, and free days (p < 0.05), with the exception of time of last eating occasion on morning shift, which did not reach statistical significance. On night shifts, only meal frequency and time of first eating occasion had good reliability. Times of main meal 1, 2, and 3 all showed good to excellent reliability across all day types in the general and shift work population (p < 0.05), although results were not statistically significant for times of main meal 3 on afternoon and night shifts (noting the small sample sizes).
Figure 3. (a) Test-retest reliability of temporal patterns of eating variables represented on the left as a box (Kappa for regularity and ICC for frequency, duration, and time) and whiskers (upper and lower confidence intervals) plot and on the right as heat map, ranging from dark green (excellent reliability) to red (poor reliability). (b) Convergent validity of temporal patterns of eating variables represented on the left as a box (rs) and whiskers (upper and lower confidence intervals) plot and on the right as heat map, ranging from dark green (large effect size) to red (small effect size). Sample sizes less than 10 are marked with a ^. GP: general population; SW: shift worker; W: workday; FD: free day; M: morning shift; A: afternoon shift; N: night shift; EW: eating window; EO: eating occasion.
Convergent validity
Convergent validity of chronotype calculated from CNQ and sleep diaries shows good validity (general population: rs = 0.662, p < 0.001, shift worker: rs = 0.655, p = 0.015).
Convergent validity between the CNQ and sleep diaries is presented in Table S4 and . For both the general and shift work population, sleep variables (sleep time, wake time, sleep duration, mid-sleep time) show good validity with large effect sizes on morning shifts, night shifts, and free days after night shifts (p < 0.05 for all except for sleep time on free days after night shift). Sleep variables for afternoon shifts and free days after morning and afternoon shifts had low to large effect sizes but were not statistically significant due to low sample sizes (n = 4–6).
Convergent validity between the CNQ and food diary is presented in Table S5 and . Meal and snack regularity had a medium effect size for the general population and was statistically significant on work/school-free days (p < 0.05) but was not statistically significant on work/school days. Amongst shift workers, meal and snack regularity had small effect sizes across all day types and were not statistically significant.
Meal, snack, and total frequency showed good validity for the general population (p < 0.05), except for total frequency on work/school days which had poor validity (p = 0.244). For shift workers, only total frequency on morning shift had a statistically significant large effect size (p < 0.001). Otherwise, meal, snack, and total frequency had medium to large effect sizes on morning and afternoon shifts (except snack frequency on morning shifts with a small effect size), and small to medium effect sizes on night shifts and free days, but none were statistically significant.
Correlations between CNQ and food diary of time of first and last eating occasions had a medium to large effect size across the week for the general population (p < 0.05). For shift workers, only time of last eating occasion on night shift had a statistically significant large effect size for (p = 0.011); times of first and last eating occasions across the other shifts had low to medium effect sizes that were not statistically significant. Duration of eating window had a low effect size on free days of the general population (p = 0.381), but medium to large effect sizes across all other day types that were statistically significant (p < 0.05) except on afternoon shifts (p = 0.135). For the general population, times of main meal 1, 2, and 3 had medium to large effect sizes across the week (p < 0.05) apart from time of main meal 2 on free days that had a small effect size (p = 0.26). Amongst shift workers, times of main meals 1, 2, and 3 generally had medium to large effect sizes, that were statistically significant only on morning and shift-free days (p < 0.05) and insignificant on afternoon and night shifts. Time of largest eating occasion was poorly correlated across both the general and shift work populations except for night shifts, which had a medium effect size (p = 0.035).
Face validity
After the first completion of the CNQ at baseline, 43 participants provided feedback to the questionnaire: 12 were positive; 16 were neutral (reflecting on variations in their lifestyle, or general comments about questionnaire or the study); 8 were suggestions; and 7 expressed difficulties around clarity of questions/instructions, use of 24-h clock, and formatting. When the CNQ was completed for a second time after two weeks, 39 participants provided feedback: 13 were positive; 19 were neutral; 7 were suggestions. The questionnaire was rated (out of 5) to be clear (4.28 ± 0.753), understandable (4.46 ± 0.665), and have a good format (4.32 ± 0.809); results were not statistically different at two weeks (p = 0.505, 0.801, 0.586 respectively).
Discussion
The CNQ is the first questionnaire designed to capture temporal patterns of eating, chronotype, and sleep and wake times. It has shown fair to excellent test-retest reliability for the general population, while greater variability has been identified in temporal eating patterns for shift workers on night shift. Convergent validity for chronotype and sleep was strong across the study population except for sleep variables on certain shift-related days. For all participants, duration of eating window and times of main meals generally showed moderate to strong validation metrics, but time of largest eating occasion failed to reach this level. Regularity, frequency and times of first and last eating occasions generally showed moderate to strong validation metrics for the general population but not shift workers.
Convergent validity
Convergent validity for sleep and chronotype was generally acceptable except for sleep on certain shift-related days, due to limited sample sizes (n = 4–6). It is likely that validity would have been achieved with a larger sample size, as questions were derived from the validated MCTQShift (Juda et al. Citation2013).
To our knowledge, this is the first questionnaire that attempted to validate regularity and frequency of food consumption. Meal and snack regularity showed moderate validity for the general population. Regularity in food intake times has been determined through various methods previously (McHill et al. Citation2020; Popp et al. Citation2021; Pot et al. Citation2014; Wang et al. Citation2022). Our method (Supplementary C) yields a specific percentage of time that meals fall within an hour of each other based on reported fluctuations in circadian rhythms if mealtimes are consumed >1 hr apart from day to day, which are less influenced by snack times (Manoogian et al. Citation2022) that tend to be smaller in portion (Leech et al. Citation2015b). Hence, when investigating relationships with health outcomes, emphasis should be placed on meal regularity rather than snack regularity. Similarly, in the general population, meal and snack frequency demonstrated moderate to strong validity, but not total frequency. While eating frequency is a crucial element of chrononutrition (Almoosawi et al. Citation2016), meal but not snack frequency was positively related to micronutrient intake and overall diet quality (Leech et al. Citation2016; Murakami and Livingstone Citation2016). Compared to meals, snacks are typically smaller in portions (Leech et al. Citation2015b), providing only ~ 10% of total energy intake (Potter et al. Citation2018); hence have disparate effects on cardiometabolic outcomes. Because of differences in energy loading, implications on diet quality and importantly, cardiometabolic health outcomes, distinguishing meal from snack frequency should be superior to total frequency.
Amongst the general population, times of first and last eating occasions had moderate to strong validation metrics for work and free days but duration of eating window showed poor validity on free days, consistent with a similar validation study (Gioia et al. Citation2022). This may be explained by greater variability in the time of last eating occasion on free days (Gill and Panda Citation2015). Furthermore, time of main meal 3 (typically last main meal of the day) had strong validity on free days while our food diary data (unreported) showed snacks occurred more often after main meal 3 than reported in the CNQ, suggesting our findings could be due to additional snacks after main meal 3. Hence, interpreting duration of eating window on free days should be conducted with the awareness that it could be a longer duration than reported. Amongst shift workers, duration of eating window had a larger effect size than times of first or last eating occasions. Hence, the CNQ can be used in future studies with shift workers to identify relationships between eating windows and health outcomes or assess compliance in time-restricted eating studies.
The time of largest eating occasion generally showed poor convergent validity except on night shifts, as previous studies have reported (Chakradeo et al. Citation2021; Gioia et al. Citation2022; Veronda et al. Citation2020). The concept of the largest eating occasion as captured by the CNQ was based on overall food volume which can be skewed by low energy dense foods and factors such as serving plate size or packaging (Benton Citation2015). More importantly, some participants indicated lunch and dinner as equally large in the questionnaire, a similar challenge to another validation study (Gioia et al. Citation2022). As lunch and dinner was observed to have an energy differential of 12%, differences may be indistinguishable by the lay person (Kant Citation2018). Our findings show mealtimes (particularly main meals 2 and 3, typically lunch and dinner) may better represent caloric load than largest mealtime.
Test-retest reliability
Our results showed good to excellent test-retest reliability for sleep, chronotype, and temporal patterns of eating variables (in the general population), similar to previous validation studies (Chakradeo et al. Citation2021; Reis et al. Citation2020; Veronda et al. Citation2020; Wang et al. Citation2023). Being the first chrononutrition questionnaire for shift workers, test-retest reliability was generally fair to excellent, except on night shifts. This is consistent with intra-individual variability in food intake patterns found between night shifts (Shaw et al. Citation2019) and should be considered in future data collected from the CNQ.
Comments on shift work data
We found poor convergent validity or loss of statistical significance particularly in shift workers for sleep variables on afternoon shifts and free days after morning and afternoon shifts, and eating variables including regularity, frequency, and times of first and last eating occasions. These findings may be explained by the nature of night shift work and various factors limiting data availability from shift workers and translation of results obtained.
Firstly, poor convergent validity on night shifts particularly may be due to variability in wake window. Sleep diaries revealed wake time before the first night shift tends to be in the morning while wake time before the second night shift onwards is in the evening, as sleep cycles adjust to night work. Thus, a recommended change to the CNQ would be instructing participants to respond based on the 2nd night shift and onwards, reflecting true eating habits around a night shift (Recommended change 2).
Sample sizes within each shift were reduced as not all 56 shift workers performed all shift types, and sleep and food diary data with only one entry per shift type were excluded. Furthermore, identification of sleep/wake patterns and chronotype were based on the MCTQ, which has specific criteria that limited data usability. For instance, from sleep diaries, wake times on free days were eligible only without alarm clock use and sleep/wake data were eligible only if they occurred between two of the same shifts, which not all shift workers followed. Lastly, 7-day food diaries may have been insufficient to capture representative data from rotating shift workers. This would have particularly affected the validation of meal and snack regularity, as determining regularity of food intake on a given shift type was constrained with only two or three days of food data per shift. Should further validation of the CNQ amongst shift workers be conducted, including individuals performing limited shift types would generate more days of data per shift type. Otherwise, 14-day food diaries or multiple targeted 24-h recalls may better suit rotating shift workers.
Being the first chrononutrition questionnaire for shift workers, there is no comparison for reference. While it is postulated that the lack of statistical significance in various temporal eating aspects amongst shift workers is likely due to limited sample sizes for the above reasons, there is a chance that our findings are reflective of genuine variations in consumption patterns, affected by time and food availability, with day-to-day variability that are industry-specific (Gupta et al. Citation2019). Therefore, validating this questionnaire across diverse shift work industries with unique shift schedules may ascertain if our results were limited by sample size or actually reflect “chaos” typical of shift work.
Strengths and limitations
Strengths include use of prospective food and sleep diaries that reduced recall bias. Averages of sleep and food diary data from at least two days per day type were included as representative data of habitual intake. Eating occasions were specifically defined as containing ≥210 kJ/50 kcal and separated by >15 minutes (Leech et al. Citation2015a), similar to previous studies (Gibney et al. Citation1997; Hartline-Grafton et al. Citation2010; Ma Citation2003; Murakami and Livingstone Citation2016) and endorsed by AHA recommendations (St-Onge et al. Citation2017). Lastly, our questionnaire was validated amongst a multi-ethnic population representing multicultural Australia and is the first questionnaire created not only for the general population but also shift workers, capable of identifying all relevant aspects of temporal eating endorsed by experts in the field alongside chronotype that may be used by researchers, clinicians and in workplace settings.
Notably, there were several limitations to the study. Firstly, the use of sleep diaries could have introduced recall bias, and actigraphy would have served as a more objective measure of sleep (Fekedulegn et al. Citation2020). Secondly, inadequate prompting in the CNQ led to missing information about shift schedule and chronotype not being able to be calculated for some shift workers, which forms a recommended change to the CNQ (Recommended change 1). Thirdly, the high proportion of females prevents generalisability of findings. Lastly, rounding errors or mistakes could have resulted from participants’ unfamiliarity with 24 h time, which are common in collecting data on time (Recommended change 3) (Dashti et al. Citation2021; Gioia et al. Citation2022; Jackson et al. Citation2020).
Key points
Conclusion
The CNQ is the first tool created to capture temporal patterns of eating in relation to sleep variables and chronotype. Convergent validity and reliability metrics supports its use in the general population, and in identifying chronotype, sleep, and some temporal eating aspects in the shift work population. The tool was rated as easy to use in our population of day workers, shift workers, university students, and retirees. The CNQ accurately and reliably captures chronotype and sleep parameters in both the general and shift working populations. In terms of temporal patterns of eating, across the study population, it showed moderate to strong reliability except on night shifts (perhaps due to disrupted patterns of eating), and accurate at capturing duration of eating window and times of main meals, but not time of largest eating occasion (as it tends to alternate between lunch and dinner). The other temporal aspects of eating such as meal and snack regularity and frequency, and times of first and last eating occasions were more accurately captured amongst the general population than shift workers, likely attributable to the heterogeneity of shift workers in this study.
In summary, this study validates the CNQ for the general population and shift workers; although given that it is the first of such a questionnaire for shift workers, further validation specifically of times of first and last eating occasion, and regularity and frequency of food intake in a larger sample size of homogenous shift workers will increase confidence of its use in future shift work research. In using this tool, responses should be interpreted in the context of the study population, accounting for possible external factors, such as exam period of university students or industry of shift work, which could affect timing of food intake differently. In the short term, the CNQ will be useful for quantifying temporal eating patterns and impacts on health outcomes in epidemiological studies, and in the long-term, could inform development of national dietary guidelines around optimal meal timings.
Author contribution
Yan Yin Phoi: Conceptualization, Data curation, Formal analysis, Investigation, Methodology, Project administration; Writing – original draft; Writing – review & editing. Maxine P. Bonham: Conceptualization, Methodology, Supervision, Validation, Writing – review & editing. Michelle Rogers: Conceptualization, Methodology, Supervision, Validation, Writing – review & editing. Jill Dorrian: Conceptualization, Methodology, Supervision, Validation, Visualization, Writing – review & editing. Alison M. Coates: Conceptualization, Methodology, Resources; Supervision, Validation, Writing – review & editing.
Supplemental Material
Download PDF (716.4 KB)Acknowledgments
We would like to acknowledge Jaslie Wu, who assisted in conducting clinic visits and data entry in this study as part of her Honours Project.
Disclosure statement
No potential conflict of interest was reported by the author(s).
Data availability statement
The data that support the findings of this study are available from the corresponding author, YYP, upon reasonable request.
Supplementary material
Supplemental data for this article can be accessed online at https://doi.org/10.1080/07420528.2024.2342937.
Additional information
Funding
References
- Almoosawi S, Vingeliene S, Gachon F, Voortman T, Palla L, Johnston JD, Van Dam RM, Darimont C, Karagounis LG. 2019. Chronotype: implications for epidemiologic studies on chrono-nutrition and cardiometabolic health. Adv Nutr. 10:30–42. doi: 10.1093/advances/nmy070.
- Almoosawi S, Vingeliene S, Karagounis LG, Pot GK. 2016. Chrono-nutrition: a review of current evidence from observational studies on global trends in time-of-day of energy intake and its association with obesity. Proc Nutr Soc. 75:487–500. doi: 10.1017/S0029665116000306.
- Benton D. 2015. Portion size: what we know and what we need to know. Crit Rev Food Sci Nutr. 55:988–1004. doi: 10.1080/10408398.2012.679980.
- Bertéus Forslund H, Lindroos AK, Sjöström L, Lissner L. 2002. Meal patterns and obesity in swedish women-a simple instrument describing usual meal types, frequency and temporal distribution. Eur J Clin Nutr. 56:740–747. doi: 10.1038/sj.ejcn.1601387.
- Bonham MP, Kaias E, Zimberg I, Leung GKW, Davis R, Sletten TL, Windsor-Aubrey H, Huggins CE. 2019. Effect of night time eating on postprandial triglyceride metabolism in healthy adults: a systematic literature review. J Biol Rhythms. 34:119–130. doi: 10.1177/0748730418824214.
- Buysse DJ, Ancoli-Israel S, Edinger JD, Lichstein KL, Morin CM. 2006. Recommendations for a standard research assessment of insomnia. Sleep. 29:1155–1173. doi: 10.1093/sleep/29.9.1155.
- Chakradeo P, Rasmussen HE, Swanson GR, Swanson B, Fogg LF, Bishehsari F, Burgess HJ, Keshavarzian A. 2021. Psychometric testing of a food timing questionnaire and food timing screener. Curr Dev Nutr. 6:nzab148. doi: 10.1093/cdn/nzab148.
- Dashti HS, Cade BE, Stutaite G, Saxena R, Redline S, Karlson EW. 2021. Sleep health, diseases, and pain syndromes: findings from an electronic health record biobank. Sleep. 44. doi: 10.1093/sleep/zsaa189.
- Elortegui Pascual P, Rolands MR, Eldridge AL, Kassis A, Mainardi F, Le K, Karagounis LG, Gut P, Varady KA. 2023. A meta-analysis comparing the effectiveness of alternate day fasting, the 5: 2 diet, and time-restricted eating for weight loss. Obesity (Silver Spring). 31 (Suppl 1):9–21. doi: 10.1002/oby.23568.
- Fekedulegn D, Andrew ME, Shi M, Violanti JM, Knox S, Innes KE. 2020. Actigraphy-based assessment of sleep parameters. Ann Work Expo Health. 64:350–367. doi: 10.1093/annweh/wxaa007.
- Fleiss JL. 1999. The design and analysis of clinical experiments. New York: John Wiley & Sons.
- Foodworks 10 Professional. 2019. Ver. 10.0 [software]. Brisbane: Xyris Pty Ltd.
- Garaulet M, Gomez-Abellan P, Alburquerque-Bejar J, Lee YC, Ordovas J, Scheer F. 2013. Timing of food intake predicts weight loss effectiveness. Int J Obes (Lond). 37:604–611. doi: 10.1038/ijo.2012.229.
- Gibney MJ, Wolever TMS. 1997. Periodicity of eating and human health: present perspective and future directions. Br J Nutr. 77:S3–S5. doi: 10.1079/BJN19970099.
- Gill S, Panda S. 2015. A smartphone app reveals erratic diurnal eating patterns in humans that can be modulated for health benefits. Cell Metab. 22:789–798. doi: 10.1016/j.cmet.2015.09.005.
- Gioia SC, Guirette M, Chen A, Tucker C, Gray BE, Vetter C, Garaulet M, FAJL S, Saxena R, Dashti HS. 2022. How accurately can we recall the timing of food intake? A comparison of food times from recall-based survey questions and daily food records. Curr Dev Nutr. 6:nzac002. doi: 10.1093/cdn/nzac002.
- Gupta CC, Coates AM, Dorrian J, Banks S. 2019. The factors influencing the eating behaviour of shiftworkers: what, when, where and why. Ind Health. 57:419–453. doi: 10.2486/indhealth.2018-0147.
- Harris PA, Taylor R, Minor BL, Elliott V, Fernandez M, O’Neal L, McLeod L, Delacqua G, Delacqua F, Kirby J, et al. 2019. The redcap consortium: b an international community of software platform partners. J Biomed Inform. 95:103208–103208. doi: 10.1016/j.jbi.2019.103208.
- Harris PA, Taylor R, Thielke R, Payne J, Gonzalez N, Conde JG. 2009. Research electronic data capture (redcap)–a metadata-driven methodology and workflow process for providing translational research informatics support. J Biomed Inform. 42:377–381. doi: 10.1016/j.jbi.2008.08.010.
- Hartline-Grafton HL, Rose D, Johnson CC, Rice JC, Webber LS. 2010. The influence of weekday eating patterns on energy intake and bmi among female elementary school personnel. Obesity (Silver Spring). 18:736–742. doi: 10.1038/oby.2009.249.
- Hays W. 1981. Statistics. 3rd ed. New York: Holt, Rinehart and Winston.
- Hemmer A, Mareschal J, Dibner C, Pralong JA, Dorribo V, Perrig S, Genton L, Pichard C, Collet TH. 2021. The effects of shift work on cardio-metabolic diseases and eating patterns. Nutrients. 13:4178. doi: 10.3390/nu13114178.
- Howell D. 1997. Statistical methods for psychology. Belmont, CA: Duxbury Press.
- Jackson CL, Ward JB, Johnson DA, Sims M, Wilson J, Redline S. 2020. Concordance between self-reported and actigraphy-assessed sleep duration among african-american adults: findings from the jackson heart sleep study. Sleep. 43. doi: 10.1093/sleep/zsz246.
- Johnston JD, Ordovás JM, Scheer FA, Turek FW. 2016. Circadian rhythms, metabolism, and chrononutrition in rodents and humans. Adv nutr (Bethesda Md). 7:399–406. doi: 10.3945/an.115.010777.
- Juda M, Vetter C, Roenneberg T. 2013. The munich chronotype questionnaire for shift-workers (mctqshift). J Biol Rhythms. 28:130–140. doi: 10.1177/0748730412475041.
- Kant AK. 2018. Eating patterns of us adults: meals, snacks, and time of eating. Physiol Behav. 193:270–278. doi: 10.1016/j.physbeh.2018.03.022.
- Ker K, Edwards PJ, Felix LM, Blackhall K, Roberts I. 2010. Caffeine for the prevention of injuries and errors in shift workers. Cochrane Database Syst Rev. 2010:Cd008508. doi: 10.1002/14651858.CD008508.
- Koo TK, Li MY. 2016. A guideline of selecting and reporting intraclass correlation coefficients for reliability research. J Chiropr Med. 15:155–163. doi: 10.1016/j.jcm.2016.02.012.
- Kosmadopoulos A, Kervezee L, Boudreau P, Gonzales-Aste F, Vujovic N, Scheer F, Boivin DB. 2020. Effects of shift work on the eating behavior of police officers on patrol. Nutrients. 12:999. doi: 10.3390/nu12040999.
- Landis JR, Koch GG. 1977. The measurement of observer agreement for categorical data. Biometrics. 33:159–174. doi: 10.2307/2529310.
- Lauren S, Chen Y, Friel C, Chang BP, Shechter A. 2020. Free-living sleep, food intake, and physical activity in night and morning shift workers. J Am Coll Nutr. 39:450–456. doi: 10.1080/07315724.2019.1691954.
- Leech RM, Livingstone KM, Worsley A, Timperio A, McNaughton SA. 2016. Meal frequency but not snack frequency is associated with micronutrient intakes and overall diet quality in australian men and women. J Nutr. 146:2027–2034. doi: 10.3945/jn.116.234070.
- Leech RM, Worsley A, Timperio A, McNaughton SA. 2015a. Characterizing eating patterns: a comparison of eating occasion definitions. Am J Clin Nutr. 102:1229–1237. doi: 10.3945/ajcn.115.114660.
- Leech RM, Worsley A, Timperio A, McNaughton SA. 2015b. Understanding meal patterns: definitions, methodology and impact on nutrient intake and diet quality. Nutr Res Rev. 28:1–21. doi: 10.1017/S0954422414000262.
- Leung GKW, Huggins CE, Ware RS, Bonham MP. 2020. Time of day difference in postprandial glucose and insulin responses: systematic review and meta-analysis of acute postprandial studies. Chronobiol Int. 37:311–326. doi: 10.1080/07420528.2019.1683856.
- Liu L, Chen W, Wu D, Hu F. 2022. Metabolic efficacy of time-restricted eating in adults: a systematic review and meta-analysis of randomized controlled trials. J Clin Endocrinol Metab. 107:3428–3441. doi: 10.1210/clinem/dgac570.
- Ma Y. 2003. Association between eating patterns and obesity in a free-living us adult population. Am J Epidemiol. 158:85–92. doi: 10.1093/aje/kwg117.
- Manoogian ENC, Wei-Shatzel J, Panda S. 2022. Assessing temporal eating pattern in free living humans through the mycircadianclock app. Int J Obes. 46:696–706. doi: 10.1038/s41366-021-01038-3.
- Mazri FH, Manaf ZA, Shahar S, Mat Ludin AF. 2019. The association between chronotype and dietary pattern among adults: a scoping review. Int J Environ Res Public Health. 17:68. doi: 10.3390/ijerph17010068.
- McHill AW, Hilditch CJ, Fischer D, Czeisler CA, Garaulet M, Scheer F, Klerman EB. 2020. Stability of the timing of food intake at daily and monthly timescales in young adults. Sci Rep. 10:20849. doi: 10.1038/s41598-020-77851-z.
- Mokkink LB, Prinsen CA, Patrick DL, Alonso J, Bouter LM, De Vet HC, Terwee CB. 2019. Cosmin study design checklist for patient-reported outcome measurement instruments. The Netherlands: COSMIN.
- Molzof HE, Wirth MD, Burch JB, Shivappa N, Hebert JR, Johnson RL, Gamble KL. 2017. The impact of meal timing on cardiometabolic syndrome indicators in shift workers. Chronobiol Int. 34:337–348. doi: 10.1080/07420528.2016.1259242.
- Monk TH, Buysse DJ, Kennedy KS, Pods JM, Degrazia JM, Miewald JM. 2003. Measuring sleep habits without using a diary: the sleep timing questionnaire. Sleep. 26:208–212. doi: 10.1093/sleep/26.2.208.
- Moon S, Kang J, Kim SH, Chung HS, Kim YJ, Yu JM, Cho ST, Oh CM, Kim T. 2020. Beneficial effects of time-restricted eating on metabolic diseases: a systemic review and meta-analysis. Nutrients. 12:1267. doi: 10.3390/nu12051267.
- Murakami K, Livingstone MBE. 2016. Associations between meal and snack frequency and diet quality in us adults: national health and nutrition examination survey 2003-2012. J Acad Nutr Diet. 116:1101–1113. doi: 10.1016/j.jand.2015.12.012.
- Ortega RM, Pérez-Rodrigo C, López-Sobaler AM. 2015. Dietary assessment methods: dietary records. Nutr Hosp. 31 Suppl 3:38.
- Pendergast FJ, Leech RM, McNaughton SA. 2017. Novel online or mobile methods to assess eating patterns. Curr Nutr Rep. 6:212–227. doi: 10.1007/s13668-017-0211-0.
- Peplonska B, Nowak P, Trafalska E. 2019. The association between night shift work and nutrition patterns among nurses: a literature review. Med Pr. 70:363–376. doi: 10.13075/mp.5893.00816.
- Phoi YY, Bonham MP, Rogers M, Dorrian J, Coates AM. 2021. Content validation of a chrononutrition questionnaire for the general and shift work populations: a delphi study. Nutrients. 13:4087. doi: 10.3390/nu13114087.
- Phoi YY, Rogers M, Bonham MP, Dorrian J, Coates AM. 2021. A scoping review of chronotype and temporal patterns of eating of adults: tools used, findings, and future directions. Nutr Res Rev. 35:1–24. doi: 10.1017/S0954422421000123.
- Poggiogalle E, Jamshed H, Peterson CM. 2018. Circadian regulation of glucose, lipid, and energy metabolism in humans. Metabolism. 84:11–27. doi: 10.1016/j.metabol.2017.11.017.
- Popp CJ, Curran M, Wang C, Prasad M, Fine K, Gee A, Nair N, Perdomo K, Chen S, Hu L, et al. 2021. Temporal eating patterns and eating windows among adults with overweight or obesity. Nutrients. 13:4485.
- Portney L, Watkins M. 2015. Foundations of clinical research, 3e: applications to practice. Philadelphia, PA, USA: F. A. Davis Company.
- Pot GK, Hardy R, Stephen AM. 2014. Irregular consumption of energy intake in meals is associated with a higher cardiometabolic risk in adults of a british birth cohort. Int J Obes (Lond). 38:1518–1524. doi: 10.1038/ijo.2014.51.
- Potter M, Vlassopoulos A, Lehmann U. 2018. Snacking recommendations worldwide: a scoping review. Adv Nutr. 9:86–98. doi: 10.1093/advances/nmx003.
- Reis C, Madeira SG, Lopes LV, Paiva T, Roenneberg T. 2020. Validation of the portuguese variant of the munich chronotype questionnaire (mctqpt). Front Physiol. 11:11. doi: 10.3389/fphys.2020.00795.
- Roenneberg T. 2015. Having trouble typing? What on earth is chronotype? J Biol Rhythms. 30:487–491. doi: 10.1177/0748730415603835.
- Roenneberg T, Kuehnle T, Juda M, Kantermann T, Allebrandt K, Gordijn M, Merrow M. 2007. Epidemiology of the human circadian clock. Sleep Med Rev. 11:429–438. doi: 10.1016/j.smrv.2007.07.005.
- Roenneberg T, Merrow M. 2016. The circadian clock and human health. Curr Biol. 26:R432–R443. doi: 10.1016/j.cub.2016.04.011.
- Roenneberg T, Wirz-Justice A, Merrow M. 2003. Life between clocks: daily temporal patterns of human chronotypes. J Biol Rhythms. 18:80–90. doi: 10.1177/0748730402239679.
- Shaw E, Dorrian J, Coates AM, Leung GKW, Davis R, Rosbotham E, Warnock R, Huggins CE, Bonham MP. 2019. Temporal pattern of eating in night shift workers. Chronobiol Int. 36:1613–1625. doi: 10.1080/07420528.2019.1660358.
- St-Onge M-P, Ard J, Baskin ML, Chiuve SE, Johnson HM, Kris-Etherton P, Varady K. 2017. Meal timing and frequency: implications for cardiovascular disease prevention: a scientific statement from the american heart association. Circulation. 135:e96–e121. doi: 10.1161/CIR.0000000000000476.
- Statistics ABo. 2019. Australian standard classification of cultural and ethnic groups (ASCCEG). Canberra, Australia: Commonwealth of Australia.
- Stephen AM. 2007. The case for diet diaries in longitudinal studies. Int J Soc Res Methodol. 10:365–377. doi: 10.1080/13645570701677128.
- Taherdoost H. 2016. Validity and reliability of the research instrument; how to test the validation of a questionnaier/survey in a research. Int J Acad Res Manage. 5:28–36. doi: 10.2139/ssrn.3205040.
- Terada T, Mistura M, Tulloch H, Pipe A, Reed J. 2019. Dietary behaviour is associated with cardiometabolic and psychological risk indicators in female hospital nurses—a post-hoc, cross-sectional study. Nutrients. 11:2054. doi: 10.3390/nu11092054.
- Veronda AC, Allison KC, Crosby RD, Irish LA. 2020. Development, validation and reliability of the chrononutrition profile - questionnaire. Chronobiol Int. 37:375–394. doi: 10.1080/07420528.2019.1692349.
- Wang L, Chan V, Allman-Farinelli M, Davies A, Wellard-Cole L, Rangan A. 2022. Wearable cameras reveal large intra-individual variability in timing of eating among young adults. Nutrients. 14:4349. doi: 10.3390/nu14204349.
- Wang S, Wang H, Deng X, Lei X. 2023. Validation of the munich chronotype questionnaire (MCTQ) in chinese college freshmen based on questionnaires and actigraphy. Chronobiol Int. 40:661–672. doi: 10.1080/07420528.2023.2202246.
- Xiao Q, Garaulet M, Scheer F. 2019. Meal timing and obesity: interactions with macronutrient intake and chronotype. Int J Obes (Lond). 43:1701–1711. doi: 10.1038/s41366-018-0284-x.