
 ?Mathematical formulae have been encoded as MathML and are displayed in this HTML version using MathJax in order to improve their display. Uncheck the box to turn MathJax off. This feature requires Javascript. Click on a formula to zoom.
ABSTRACT
We have investigated the magnitude of circadian variation in Isokinetic and Isometric strength of the knee extensors and flexors, as well as back squat and bench press performance using the MuscleLab force velocity transducer. Ten resistance-trained males (mean±SD: age 21.5 ± 1.1 years; body mass 78.3 ± 5.2 kg; height 1.71 ± 0.07 m) underwent a) three to four familiarization sessions on each dynamometer and b) four sessions at different times of day (03:00, 09:00, 15:00 and 21:00 h). Each session was administered in a counterbalanced order and included a period when Perceived onset of mood states (POMS), then rectal and muscle temperature (Trec, Tm) was measured at rest, after which a 5-min standardized 150 W warm-up was performed on a cycle ergometer. Once completed, Isokinetic (60 and 240°·s−1 for extension and flexion) and Isometric dynamometry with peak torque (PT), time-to-peak-torque (tPT) and peak force (PF) and % activation was measured. Lastly, Trec and Tm were measured before the bench press (at 30, 50 and 70 kg) and back squat (at 40, 60 and 80 kg) exercises. A linear encoder was attached to an Olympic bar used for the exercises and average force (AF), peak velocity (PV) and time-to-peak-velocity (tPV) were measured (MuscleLab software; MuscleLab Technology, Langesund, Norway) during the concentric phase of the movements. Five-min recovery was allowed between each set with three repetitions being completed. General linear models with repeated measures and cosinor analysis were used to analyse the data. Values for Trec and Tm at rest were higher in the evening compared to morning values (Acrophase Φ: 16:35 and 17:03 h, Amplitude A: 0.30 and 0.23°C, Mesor M: 36.64 and 37.43°C, p < 0.05). Vigor, happy and fatigue mood states responses showed Φ 16:11 and 16:03 h and 02:05 h respectively. Circadian rhythms were apparent for all variables irrespective of equipment used where AF, PF and PT values peaked between 16:18 and 18:34 h; PV, tPV and tPT peaked between 05:54 and 08:03 h (p < 0.05). In summary, circadian rhythms in force output (force, torque, power, and velocity) were shown for isokinetic, isometric dynamometers and complex multi-joint movements (using a linear encoder); where tPV and tPT occur in the morning compared to the evening. Circadian rhythms in strength can be detected using a portable, low-cost instrument that shows similar cosinor characteristics as established dynamometers. Hence, muscle-strength can be measured in a manner that is more directly transferable to the world of athletic and sports performance.
Introduction
Laboratory-based research has consistently shown muscle power output and force production values are higher in the mid-afternoon, or early evening than in the morning. This work is predominately on male participants, but not exclusively (Giacomoni et al. Citation2005); in a temperate environment (around 17–20°C). This daily variation is regardless of whether muscle force output is measured using isokinetic dynamometry (for leg extensors or flexors), or whether force is measured using isokinetic or isometric maximal voluntary contraction (MVC, Blain et al. Citation2006; Edwards et al. Citation2013; Robinson et al. Citation2013; Sedliak et al. Citation2008). Diurnal variation appears to be present irrespective of the speed of contraction, or muscle group measured (such as hand, elbow, leg or back; Drust et al. Citation2005; Reilly and Waterhouse Citation2009). However, the observed daily variation can be influenced by factors such as a lack of rigor and standardisation in the method employed, number of participants and choice of population as well as a lack of control for important factors, which specifically relate to investigations of chronobiological nature and other considerations (Bambaeichi et al. Citation2005; Edwards et al. Citation2024; Giacomoni et al. Citation2005). Bruggisser et al. (Citation2023) highlighted that the main biases in individual studies are “bias in measurement of the outcome” and “bias in selection of the reported result;” with a lack of well-controlled studies. These concerns are not new in exercise related chronobiological studies (Araujo et al. Citation2011; Drust et al. Citation2005; Knaier et al. Citation2022; Reilly et al. Citation2000; Winget et al. Citation1985; Youngstedt and O’Connor Citation1999) and recent systematic reviews highlight a rigorous approach needs to be adopted by future investigations regarding measuring possible daily variations in human exercise performance (Bommasamudram et al. Citation2022; Ravindrakumar et al. Citation2022).
Time-of-day variation of muscle force output is mainly investigated in single-joint, isokinetic and isometric methods (Callard et al. Citation2000; Edwards et al. Citation2013; Giacomoni et al. Citation2005). However, the physical demands of sport require athletes to move and function in multiple directions, at varying rates of speed and periods of time. Strength and conditioning coaches routinely use multi-joint exercises (back squat and bench press) to monitor and evaluate muscle force output, to train athletes to meet the sporting challenges (Baechle and Earle Citation2015). The validation of several accurate and reliable force-velocity linear encoders which can evaluate dynamic muscle work, has enabled research to be performed within a standardised laboratory environment with immediately accessible results (Bosco et al. Citation1995; Jennings et al. Citation2005; O’Donnell et al. Citation2017). As these dynamometers are relatively low cost and easy to transport, athletes, coaches and sport scientists have taken great interest in using these devices as means of determining and monitoring athlete performance (Chiu et al. Citation2003; García-Ramos et al. Citation2016; Harris et al. Citation2010).
There is convincing evidence to support both diurnal and circadian variation of muscle force output (Drust et al. Citation2005) and the reliability of isokinetic and isometric maximum voluntary contraction (MVC) methods to measure these differences accurately (Drouin et al. Citation2004; Morton et al. Citation2005). The MuscleLab force-velocity linear encoder (Ergotest version 4010, Norway), which measures average force (N), along with peak velocity (m.s−1) and time to peak velocity (s) has been shown to be able to detect diurnal variation (at 07:00 and 17:00 h) in multi-joint muscle force output at different masses (low and high relative to body weight) during a (upper body) bench press and (lower body) back squat and inclined leg press (Brotherton et al. Citation2019; Robertson et al. Citation2018). Average force and peak velocity increase from morning to evening by 2.5 and 12.7% and time-to-peak velocity decreased by 16.6%, for bench press (for 20 and 60 kg). Similarly, average force and peak velocity increased from morning to evening by 1.9 and 8.3% and time to peak velocity decreased by 9.8%, for back squat (for 30 and 70 kg; Robertson et al. Citation2018). Further this encoder has shown to be sensitive to measure effects on diurnal variation in muscle strength with partial sleep deprivation (Brotherton et al. Citation2019; Gallagher et al. Citation2023), warm-up (Pullinger et al. Citation2019) and dietary supplementation with Zinc Magnesium Sulphate (Gallagher et al. Citation2024). To the best of our knowledge there has never been a study that investigated circadian variation parameters in single-joint, isokinetic and isometric methods in comparison with in multi-joint muscle force-velocity linear encoder outputs. Such a circadian study would enable better understanding of the full rhythm over the 24-h solar day, rather than just two time-points that have been pragmatically selected in diurnal variation research over the last 50 years (Drust et al. Citation2005). As well as the interchangeability of dynamometers, enabling future chronobiology research to investigate intervention strategies on strength outcomes using sport-specific movement tasks.
Therefore, the aims of this study were to use a well-controlled and scientifically thorough protocol (allowing recovery and enable maximal physical effort) and, a) assess the sensitivity of the force-velocity linear encoder to circadian variations in upper and lower body movements, and b) compare the circadian characteristic outputs for Biodex Isokinetic and Isometric MVC methods as well as the Muscle Lab force-velocity linear encoder [such as peak torque (PT), time-to-peak-torque (tPT), peak force (PF), % activation, average force (AF), peak velocity (PV) and time-to-peak-velocity (tPV)].
Methods
Participants
Ten healthy active males (mean ± SD: age 21.5 ± 1.1 years; body mass 78.3 ± 5.2 kg; height 1.71 ± 0.07 m) recruited from the University Sports Scholarship Scheme participated in this study. Inclusion criteria were healthy males (18–30 years), with previous weight/strength training experience (≥2 years). Participants habitually retired between 22:00–23:30 h and rose at 06:00–07:30 h and agreed to retire to bed at 22:30 and rise at 06:30 h. None of the participants were receiving any pharmacological treatment (including non-steroidal anti-inflammatory drugs, NSAIDs) throughout the study period. Habitual caffeine consumption was assessed using the caffeine consumption questionnaire (CCQ) and those with >150 mg per day were excluded (Landrum Citation1992). Further, all participants expressed no preference to training regarding time of day by a weekly self-reported 2-week training diary. Recruiting participants with this specific type of exercise history meant that the known neuromuscular facilitative responses, which are typically associated with acute increases in muscular strength amongst untrained individuals due to neural adaptations and responses were reduced (Hakkinen Citation1989). Exclusion criteria included depressed mood (from the Beck depression inventory), poor sleep quality (a Pittsburgh sleep quality index global score > 5), recent shift-work or travel across multiple time-zones, and “extreme” chronotype (assessed via the Composite Morningness Questionnaire, Smith et al. Citation1989) and risk factors and/or symptoms of cardiovascular disease. Through interviews, it was established that the volunteers had minimal knowledge of the effects of time of day or time-since-sleep on human performance. Verbal explanation of the experimental procedure was provided to everyone; this included the aims of the study, the possible risks associated with participation and the experimental procedures to be utilized. Any questions were answered. Individuals then provided written, informed consent before participating in the study. The experimental procedures were approved by the Human Ethics Committee at Liverpool John Moores University (ETHICS CODE: 08/SPS/030). The study was conducted in accordance with the ethical standards of the journal and complied with the principles of the Declaration of Helsinki.
Research design
Each participant first completed familiarisation sessions (detailed below), followed by 4 experimental sessions at 03:00, 09:00, 15:00 and 21:00 h. These experimental sessions were counterbalanced in order of administration to minimise any potential learning effects (Monk and Leng Citation1982), with a minimum of 72 h to ensure recovery between trials. Groups 1–3 began the protocol on day one at staggered start times and finished 14 days later; groups 4–6 followed the same protocol but started and finished a day later. Participants were asked to avoid any strength training during the entire experimental condition and to avoid taking part in any physical training or hard activity sessions of an aerobic or anaerobic nature. Participants were also required to avoid all alcohol consumption 24 h prior to each test.
Familiarisation session
Before commencing the main experiment, participants completed between three to five familiarisation sessions (mean ± SD: 4 ± 1; for an explanation of this, see below) each separated by at least three days. The participants completed a minimum of four familiarisation sessions of all the dynamometry measures, before being considered as ready to participate in the study. A coefficient of variation value less than or equal to 10% for both flexion and extension measures between the last and penultimate measures was our criteria for familiarisation, for some participants this was achieved in four of five sessions, which falls in alignment with the recommendations given by Atkinson and Nevill (Citation1998). Familiarisation sessions took place at 12:00 h under standard laboratory conditions (lighting = 200–250 lux, temperature = 20–22°C, mean humidity = 50 ± 5%), over a two-week period and finishing one week before the study commenced to minimize learning effects. Participants arrived one hour before the start of the test and rested in a supine position, to minimise the influence of prior muscle activity. Rectal temperature (Trec) was then measured using a soft flexible rectal probe (Mini-thermistor, Grant Instruments Ltd, Shepreth, UK) inserted ~10 cm beyond the external anal sphincter. While volunteers remained in a standardised position (i.e., semi-supine but awake), Trec was recorded continuously over 30 min by means of a Squirrel 1000 data logger (Grant Instruments Ltd, Shepreth, UK) and the average value of the last 5-min was retained for subsequent analysis. Following the completion of temperature measurement, participants completed the familiarisation in the following order.
Biodex II isokinetic dynamometry (biodex. Corporation, Shirley, NY, USA)
The position of the volunteer in the Isokinetic chair was standardized in accordance with the guidelines set by the manufacturers. The range of motion was standardised from 0° to 90° of knee flexion (0° corresponding to the full extension of the leg). Flexion and Extension measurements of maximal voluntary contraction (MVC) of the right knee were taken at both 60 and 240°·s−1 as these are generally considered as the two contrasting performance velocities, with a 5-min rest allowed between the two sets of measurements.
Isometric percutaneous stimulation (digimeter, DS7, Hertfordshire, UK)
Participants were then familiarised with the procedure of performing isometric MVCs of the quadriceps muscles (4 s duration), both with and without twitch interpolation. During the initial session, participants practiced performing MVCs without twitch interpolation, to become accustomed to the practice of achieving and maintaining voluntary force for the time required. This session was also used to obtain maximal current tolerance and establish the supra-maximal current amplitude for superimposition during an MVC. With the subject at rest, the amperage of a 240 V square-wave pulse (100 μs, 1 Hz) was progressively increased until the point when further increases in intensity caused no further increase in resting twitch force was reached (Morton et al. Citation2005; Newman et al. Citation2003).
Twitch interpolation
The quadriceps were electrically stimulated using two moistened surface electrodes (Chattanooga, USA, 7 × 12.7 cm) which were positioned proximally over the vastus lateralis and distally over the vastus medialis. The skin was prepared prior to placement of each electrode by shaving and light abrasion of the skin, followed by cleaning with an isopropyl alcohol swab. A permanent marking pen was used to mark and identify the position of each electrode to minimise electrode placement variability from session to session (Giacomoni et al. Citation2005; Keogh et al. Citation1999). Two impulses were delivered before and after the contractions; the other four impulses were administered during the contraction period and tested the peak value of the MVC (). The peak forces of the pre- and post-contraction twitches were then averaged, allowing comparison of resting twitch amplitudes in both an unpotentiated and potentiated condition respectively (Oskouei et al. Citation2003). The amplitude of supra-maximal superimposed current was identified for each subject in familiarisation sessions and corresponded to 10% above the level required to evoke a resting muscle twitch of maximal amplitude (Todd et al. Citation2004).
Figure 1. A typical MVC with twitches superimposed. Panel a illustrates the timing of the twitches whilst panel b illustrates the participants achieved force rate.
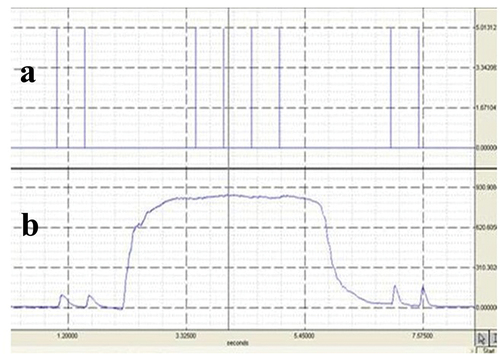
Data were acquired for eight seconds and analysed with a commercially designed software programme (AcqKnowledge III, Biopac Systems, Massachusetts). The calculation of voluntary activation was conducted according to an interpolated twitch ratio (as recommended by Merton Citation1954) whereby the size of the interpolated twitch is expressed as a ratio of the amplitude elicited by the same stimulus delivered to a relaxed potentiated muscle. The average force during the 100 m.s−1 period before the application of each stimulus during the contraction was recorded, and subsequently the maximal force recorded during the 100 m.s−1 period after each stimulus had been applied. The highest 100 m.s−1 mean pre-stimulus force (taken as MVC force) and the resulting maximal post-stimulus force were used to calculate the size of the interpolated twitch, by subtraction of the mean pre-stimulus force from the maximal post-stimulus force.
During familiarisation sessions, participants alternated between performing MVCs with and without twitch interpolation, so that approximately three trials of each were performed within each session. This approach was suggested by Morton et al. (Citation2005) who reported that many subjects performed weaker contractions when they were expecting stimulation (attributed to the potential apprehension due to the prospect of receiving noxious stimuli) compared to when they were not expecting stimulation. Familiarisation sessions were conducted until the participant’s MVC force and voluntary activation demonstrated a plateau effect and overall percentage muscle activation was repeatedly above 90% (again, compliant with observations made by Morton et al. Citation2005). This level of initial consistency was typically achieved within three to five sessions, after which participants were then considered eligible to participate. Standardised strong verbal encouragement during each familiarisation session/trial and real-time visual feedback of their performance (see ) was provided to the participants via the computer display onto a large screen placed in front of them.
Back squat and bench press (muscle lab, ergotest version 4010, Norway)
Participants were familiarised with this part of the protocol three times prior to commencement of the testing cycle. Each participant was asked to perform the back squat with incrementing loads (60, 80 and 100 kg) for one repetition at each load and 5-min rest was allowed between each effort. Likewise for bench press, each participant performed one repetition against each incrementing load (40, 60 and 80 kg) and again five minutes rest was given between each working effort. This was done so that the upper loads required for the experimental trials (back squat 80 kg; bench press 70 kg) were known to be comfortably within each of the participants’ physical capabilities and as such there was minimal likelihood of them failing to perform the required efforts for data collection. Each of the participants performed the two exercises in same order, back squat and then bench press, performing three lifts at each exercise against progressively increasing loads (back squat: 40, 60 and 80 kg. bench press: 30, 50 and 70 kg). The individual’s own body mass was factored into the back squat exercise, as this is a whole-body movement, but not into the bench press. The MuscleLab force-velocity linear encoder was attached to an Eleiko Olympic bar (20 kg) which was set upon rests within a standard squat rack so that the participant had a 90° knee flexion position (settings measured and recorded during the familiarisation process). From this position, the participant was instructed to drive the bar upwards as forcefully as possible; the value recorded during the test was for the concentric phase of the action only. The MuscleLab system measured both the average force produced, the peak velocity and time-to-peak velocity for each individual lift. This process was repeated three times, with 5-min rest allowed between each individual lift, and against the progressive workloads as described above. For the bench press, the bar was set so that it rested just above (~2.5 cm) the participant’s chest and, again, the instruction given was to push against the bar as forcefully as possible. Again, this was repeated three times against the workloads described above, with 5-min rest between each push.
The highest of the three average force outputs (and associated peak velocity and time to peak velocity values) was used for analysis for each mass on the bar for both bench press and back squat respectively. Only the lower and highest loads of the back squat and bench tests were analysed. This was to allow the participant to perform at greater velocities (lowest load) and challenging overall muscle force output when the ability to move quickly has been reduced (at the highest loads). The middle load was used purely for the purpose of preparing the participant within the trial for the incremental increase in demand, to both reduce the potential for injury and to allow them to adjust more progressively to an increase external load. To reduce the likelihood of injury, two people were positioned either side of the participants as they performed their lifts, to intervene if there was a problem. In addition, there were safety supports in place on every occasion (so that, if any participant had to release the weight for any reason, it would not fall upon them).
Protocol and measurements
Immediately following the familiarisation process, each participant spent approximately 12 h completing the laboratory protocol. Participants were required to retire at 22:30 h and rise at 06:30 h for the 09:00, 15:00 and 21:00 h testing. For the 03:00 h session they rose at 06:30 h and stayed awake until 03:00 h; and be in the laboratory 30 min prior to the start of each session. Participants came into the morning session having fasted and were not allowed to consume food 4 h before the other sessions. On arrival participants completed a Profile of Mood States (POMS) questionnaire (McNair and Lorr Citation1971), then compliance to the protocols sleeping, food intake and exercise restrictions were assessed verbally. A rectal probe (Trec) was self-fitted, then volunteers were allowed 30-min for acclimation to the laboratory to reduce any transient influences of the pre-laboratory environment on the measures. Trec was measured using a soft flexible rectal probe (Mini-thermistor, Grant Instruments Ltd, Shepreth, UK) inserted ~10 cm beyond the external anal sphincter. While volunteers remained in a standardised position (semi-supine and awake), Trec was recorded continuously for a 30 min period by means of a Squirrel 1000 data logger (Grant Instruments Ltd, Shepreth, UK), with the average value recorded over the last 5-min being retained for analysis. This standard body position was used since core body temperature is subject to other influences than that produced by the endogenous 24 h period oscillator, such as muscle activity, feeding and sleep (Bougard et al. Citation2009; Edwards et al. Citation2002). As with the familiarisation period, all procedures were conducted under standard laboratory conditions for lighting, humidity and temperature as previously described. The daily energy intake on test days was controlled and limited to 2500 Kcal, which complies with the British Nutrition Foundation’s recommended daily calorific intake for a mature man (www.nutrition.org.uk/home.asp, accessed on 17.04.2023). Water and non-caffeinated/non-alcoholic, calorie-free beverages were allowed ad libitum up to a total volume of 3 L per day.
Trec and muscle temperature (Tm) were assessed first at rest and then prior to each of the performance test measures (Biodex isokinetic Dynamometry, both speeds, isometric percutaneous stimulation and back squat/bench press) using a needle thermistor inserted into the vastus lateralis (13050, ELAB, Denmark). The area was marked with a permanent marker to minimise site variation between testing sessions. The depth of insertion was standardized at 3 cm (in compliance with procedures set out by Gregson et al. Citation2005). Muscle temperature was recorded using an ELAB electronic measuring system (CTF 9004, ELAB, Denmark). Participants were required to perform a standardized 5-min warm-up on a cycle ergometer (Monark 817E, Stockholm, Sweden) at 150 W. Following the warm-up procedure, the methods for assessing muscle force output were performed (see ).
Figure 2. Schematic of the research design and experimental protocol, the thermometer image represents Trec and Tm taken.
Statistical analysis
Power analysis using the G*Power 3.1.9.6 software (Faul et al. Citation2007): We took the data from diurnal variation values previously published for average power outputs for bench press using linear encoders for the “high” weight on the bar (Robertson et al. Citation2018). If we consider the peak and trough of the rhythm over a 24 h cycle for bench press a sample size of 10 will have 80% power to detect a difference in means of 10.6 (e.g. a First condition mean, μ₁, of 680.5 and a Second condition mean, μ₂, of 691.1), assuming a standard deviation of differences of 10.5, using a paired t-test with a 5% two-sided significance level. Except for the cosinor analysis (which was analysed by a program written by Prof Jim Waterhouse), the Statistical Package for the Social Sciences (SPSS), version 29, for Windows were used. All data were checked for normality using the Shapiro-Wilk test. Differences between conditions were evaluated using a general linear model with repeated measures, within subject factor “time of day” (4 levels). To correct violations of sphericity, the degrees of freedom were corrected in a normal way, using Huynh-Feldt (ε > 0.75) or Greenhouse-Geisser (ε < 0.75) values for ε, as appropriate. Graphical comparisons between means and Bonferroni pairwise comparisons were made where main effects were present. For the general linear force-velocity dynameter only the data obtained from the first and final lifts of the back squat and bench tests were analysed, as they represent the two extremities of the force-velocity relationship: lesser resistances typically allowing for greater peak velocities and greater resistances usually leading to larger average force values. The α-level of statistical significance was set at p < 0.05. Effect sizes (ES) were calculated from the ratio of the mean difference to the pooled standard deviation. The magnitude of the ES was classified as trivial (≤0.2), small (>0.2–0.6), moderate (>0.6–1.2), large (>1.2–2.0) and very large (>2.0) based on guidelines from Batterham and Hopkins (Citation2006). The results are presented as the mean ± the standard deviation throughout the text unless otherwise stated. Ninety-five percent confidence intervals are presented where appropriate. A single cosine curve with a period of 24 h (Nelson et al. Citation1979) was fitted to each set of time series data by least-squares linear regression analysis. The main parameters derived from the fitted curve were: mesor (mean of the fitted curve), acrophase (clock time of the peak of the curve referenced to local 00:00 h), and amplitude (half the difference between the peak and trough values of the fitted curve); in addition, the amplitude/mesor ratio and the percentage of the total variance accounted for by the fitted curve were calculated. Population cosinor analysis was used to describe all the data; in addition to describing the mesor, acrophase and amplitude of the population curve, the standard error of the mesor and the 95% confidence intervals for the mesor and acrophase were calculated. Observed power (OP) is given, this is an estimate of the power of a test given an observed effect size.
Results
Resting Trec and Tm temperatures
Significant circadian rhythms were shown in both Trec and Tm resting temperatures where acrphase (Φ), mesor (M) and amplitudes (A) for Trec and Tm were (Φ) 16:35 and 17:03 h; (M) 36.64 and 37.43°C and (A) 0.30 and 0.23°C, respectively (). Daily variations in Trec and Tm were found (ES = 0.73, OP = 1.0, p < 0.001; and ES = 0.63, OP = 0.99, p < 0.001; ). Pairwise comparisons showed higher resting Trec and Tm values at 15:00 h compared to those observed at the other times with biggest difference at 03:00 h (0.56°C, CI = 0.27 to 0.85°C; p < 0.001; 0.66°C, CI = 0.26 to 1.06°C; p = 0.002, respectively).
Figure 3. Mean (95%CI) values for both resting rectal and muscle temperature for the four times of day.
Table 1. Population cosinor results for rectal temperature, resting muscle temperature, and all POMS category scores during the live normal protocol (four times of measurement). 95% confidence intervals are inserted when significance observed. Bold values indicate statistical significance (p < 0.05).
Trec and Tm temperatures during the protocol (only Tm was investigated by cosinor analysis)
Significant circadian rhythms were shown in Tm temperatures taken before the four methods (pre 60/240/iso/ML) to measure force during the protocol, where acrphase (Φ), mesor (M) and amplitudes (A) for were (Φ) ~16:30; (M) ~37.30°C and (A) ~0.36°C respectively (). Daily variations in Trec and Tm were found (ES = 0.40, OP = 0.85, p = 0.008; and ES = 0.85, OP = 1.0, p < 0.001). Pairwise comparisons showed lower Trec values at 03:00 than 15:00 or 21:00 h (−0.34°C,CI = −0.10 to −0.84°C; p = 0.006 and −0.34°C,CI = −0.01 to 0.67°C; p = 0.044 respectively). Tm values were lower at 03:00 than 09:00, 15:00 or 21:00 h (−0.34°C, CI = 0.10 to 0.57°C; p = 0.006; −0.24°C, CI = −0.47 to −0.87°C; p < 0.001; and −0.58°C, CI = −0.49 to −0.79°C; p < 0.001 ). Tm values were lower at 09:00 than 15:00 or 21:00 h (−0.33°C, CI = 0.10 to 0.57°C; p = 0.006; and −0.24°C, CI = −0.01 to −0.46°C; p = 0.036). Trec values were seen to rise from the first measure to third, then remain stable within the protocol (0.10°C, CI = 0.02 to 0.17°C; p = 0.016). Tm values rose from the first measure to the last (0.39°C, CI = 0.18 to 0.59°C; p < 0.001). There was no interaction observed such that the profiles of temperature increase and fall in parallel regardless of time of day, or measure during the protocol (p > 0.05).
Table 2. Population cosinor results for pre-test muscle temperature and all biodex isokinetic dynamometry results during the protocol (four times of measurement). Bold values indicate statistical significance (p < 0.05).
Table 3. Population cosinor results for pre-test muscle temperature and all isometric percutaneous stimulation results during the protocol (four times of measurement).
Table 4. Population cosinor results for pre-test muscle temperature and all muscle lab.
Strength and power measures
Biodex Isokinetic Dynamometry: extension at 60°·s−1 and 240°·s−1
Cosinor analysis revealed that muscle force output values for knee extension PT and tPT values at both 60°·s−1 and 240°·s−1 demonstrated significant circadian rhythms (). Daily variations for knee extension PT and tPT values at both 60°·s−1 and 240°·s−1 were found (ES = 0.83, OP = 1.0, p < 0.001; and ES = 0.82, OP = 1.0, p < 0.001). Pairwise comparisons showed higher Pt and lower values for extension tPT at both 60°·s−1 and 240°·s−1 at 21:00 h than morning (03:00 h, 27.0 N.m−1, CI = 14.4 to 39.5 N.m−1, p < 0.001; −68.5 m.s−1, CI = −97.0 to −40.0 m.s−1; p < 0.001 and 09:00 h, 19.5 N.m−1, CI = 10.5 to 28.5 N.m−1, p < 0.001; −42.0 m.s−1, CI = −55.6 to −28.3 m.s−1; p < 0.001). As well as afternoon (15:00 h, 9.8 N.m−1, CI = 1.4 to 18.2 N.m−1, p = 0.021; −22.5 m.s−1, CI = −34.6 to −10.4 m.s−1; p<0.001; ). Lower values for extension PT and higher tPT at both 60°·s−1 and 240°·s−1 at 03:00 h and 09:00 h (−7.5 N.m−1, CI = −12.5 to −2.5 N.m−1, p = 0.004; 26.6 m.s−1, CI = 4.0 to 49.1 m.s−1; p=0.02), as well as 15:00 h were found (−27.0 N.m−1, CI = −39.5 to −14.4 N.m−1, p < 0.001; 46.0 m.s−1, CI = 16.6 to 75.4 m.s−1; p = 0.003). Lastly, pairwise comparisons showed higher values for extension Pt and lower for tPT at both 60°·s−1 and 240°·s−1 at 15:00 h than 09:00 h (9.7 N.m−1, CI = 3.7 to 15.8 N.m−1, p = 0.003; −19.5 m.s−1, CI = −35.6 to −3.3 m.s−1; p = 0.017). There was a statistically significant main effect for speed of movement, with pairwise comparison revealing higher extension PT and tPT values at 60°·s−1 than at 240°·s−1 59.5 N.m−1, CI = 49.1 to 69.8 N.m−1, p = 0.0001; 213.5 m.s−1, CI = 171.2 to 255.7 m.s−1, p < 0.001). There was a significant interaction observed for extension tPT, where both profiles fell from 09:00 to 21:00 h, however the rate of rise from 21:00 to 03:00 h in the 60°·s−1 profile was significantly greater than that of compared to 240°·s−1 (243.0 m.s−1, CI = 193.4 to 292.6 m.s−1, p < 0.001).
Biodex Isokinetic Dynamometry: flexion 60°·s−1 and 240°·s−1
Cosinor analysis revealed that muscle force output values for knee flection “peak” and “time-to-peak” torque at both 60°·s−1 and 240°·s−1 demonstrated significant circadian rhythms (). Daily variations for knee flexion PT and tPT values at both 60°m.s−1 and 240°m.s−1 were found (ES = 0.67, OP = 0.98, p = 0.001; and ES = 0.68, OP = 0.98, p = 0.001). Pairwise comparisons showed higher Pt and lower values for flexion tPT at both 60°·s−1 and 240°·s−1 at 21:00 h than morning (03:00 h, 15.1 N.m−1, CI = 4.4 to 25.8 N.m−1, p = 0.006; −203.5 m.s−1, CI = −330.4 to −76.6 m.s−1; p = 0.003 and 09:00 h, 11.1 N.m−1, CI = 1.0 to 21.2 N.m−1, p = 0.029; −147.0 m.s−1, CI = −276.3 to −17.7 m.s−1; p = 0.024). Only higher Pt values for flexion at both 60°·s−1 and 240°·s−1 at 21:00 h than 15:00 h were observed (5.3 N.m−1, CI = 0.4 to 10.2 N.m−1, p = 0.031). Lower values for flexion PT and higher tPT at both 60°·s−1 and 240°·s−1 at 03:00 h and 09:00 h (−4.0 N.m−1, CI = −6.6 to −1.3 N.m−1, p = 0.004; 56.5 m.s−1, CI = 33.0 to 80.0 m.s−1; p<0.001), as well as 15:00 h were found (−9.7 N.m−1, CI = −16.5 to −2.9 N.m−1, p = 0.006; 96.5 m.s−1, CI = 67.0 to 126.0 m.s−1; p < 0.001). Lastly, pairwise comparisons showed higher values for tPT at both 60°·s−1 and 240°·s−1 at 09:00 than 15:00 h (40.0 N.m−1, CI = 21.4 to 58.6 N.m−1, p < 0.001). There was a statistically significant main effect for speed of movement, with pairwise comparison revealing higher flexion PT and tPT values at 60°·s−1 than at 240°·s−1 23.6 N.m−1, CI = 18.3 to 28.9 N.m−1, p < 0.001; 159.3 m.s−1, CI = 37.9 to 280.6 m.s−1, p = 0.016). There was a significant interaction observed for extension tPT, where the rate of rise from 09:00 to 21:00 h in the 240°·s−1 profile was significantly greater than that compared to 60°·s−1 (29.0 m.s−1, CI = 6.3 to 51.7 m.s−1, p = 0.012), both profiles fell from 21:00 to 03:00 h (p < 0.001). There was no significant interaction observed for flexion PT and tPT, where 240°·s−1 and the 60°·s−1 profiles fell and rose in the same manner (p > 0.05).
Isometric percutaneous stimulation: peak muscle force output and percentage activation
Cosinor analysis revealed that PF output and %A values for isometric percutaneous stimulation demonstrated a significant circadian rhythm (). Daily variations in PF output and %A were found (ES = 0.67, OP = 0.998, p < 0.001; and ES = 0.74, OP = 1.0, p < 0.001). Pairwise comparisons showed higher PF output and %A values for isometric percutaneous stimulation at 21:00 h compared to those observed in the morning (03:00 and 09:00 h, 150.7 N, CI = 54.9 to 246.5 N; p = 0.00392.0 N, CI = 9.1 to 174.9 N; p = 0.028; and 15.4%, CI = 6.4 to 24.4%; p = 0.002; 8.2%, CI = 0.8 to 8.2%; p = 0.017 respectively). Pairwise comparisons showed higher PF and % A output at 15:00 vs 03:00 h (124.6 N, CI = 33.9 to 215.3 N; p = 0.008; 10.9%, CI = 3.5 to 18.4%; p = 0.005 respectively). Lastly, %A values were higher at 21:00 than 03:00 h (4.4%, CI = 0.8 to 8.2%; p = 0.017).
Muscle lab: bench press: average force, peak velocity and time-to-peak velocity
Cosinor analysis revealed that AF, PV and tPV values bench press first load (30 kg) and last load (70 kg) demonstrated a significant circadian rhythm (). Daily variations in AF, PV and tPV were found (ES = 0.61, OP = 0.92; ES = 0.92, OP = 1.0 and ES = 0.82, OP = 1.0, p < 0.05; ). Pairwise comparisons showed higher values for AF, PV and lower values for tPV for back squat at 21:00 h compared to those observed 09:00 h (20.0 N, CI = 13.9 to 26.1 N; p < 0.001; 0.22 m.s−1, CI = 0.15 to 0.30 m.s−1; p < 0.001 and −0.15 s,CI = −0.24 to −0.07 s; p = 0.001, respectively) and 15:00 h (11.5 N, CI = 8.7 to 14.3 N; p < 0.001; 0.12 m.s−1,CI = −0.06 to 0.19 m.s−1; p < 0.001; −0.06 s,CI = −0.09 to −0.04 s; p < 0.001, respectively). Higher values for AF, PV and lower values for tPV for bench press at 21:00 h compared to those observed at 03:00 h were found (53.8 N, CI = 10.9 to 96.8 N; p < 0.001; 0.34 m.s−1, CI = 0.25 to 0.42 m.s−1; p < 0.001; −0.21 s,CI = −0.30 to −0.12 s; p < 0.001, respectively). Further, lower values for PV and higher values for tPV for back squat at 03:00 h compared to those observed 09:00 h (−0.12 m.s−1,CI = −0.16 to −0.07 m.s−1; p < 0.001, 0.06 s, CI = 0.03 to 0.10 s; p < 0.001, respectively) and 15:00 h were found (−0.21 m.s−1,CI = −0.29 to −0.14 m.s−1; p < 0.001, 0.15 s, CI = 0.07 to 0.23 s; p < 0.001). Lastly, lower values for AF, PV and higher values for tPV for bench press at 09:00 h were present, compared to those observed at 03:00 h (−8.6.3 N,CI = −13.6 to −3.6 N; p=0.002; −0.08 m.s−1,CI = −0.15 to −0.05 m.s−1; p < 0.001, 0.09 s, CI = 0.02 to 0.16 s; p = 0.015, respectively). A main effect for mass on the bar was found where higher AF, tPV and lower AP values at 70 kg than at 30 kg (361.8 N, CI = 347.6 to 376.0 N, p < 0.001, 0.46 s, CI = 0.30 to 0.62 s, p < 0.001; and −0.78 m.s−1,CI = −1.02 to −0.54 m.s−1; p = 0.007). Significant interactions were observed for PV and tPV (PV, ES = 0.29, OP = 0.60, p = 0.046 and tPV, ES = 0.50, OP = 0.83, p = 0.009), where for PV profiles of the two loads increase from 09:00 to 21:00 h. At 21:00 to 03:00 h values at the higher mass decrease to lower values than the lower mass on bar. Profiles of tPV fall from 09:00 to 21:00 h for both low and high masses on the bar. At 21:00 to 03:00 h the rate of increase at the higher mass is greater than the lower mass on bar ().
Figure 4. Mean (95%CI) values for both back squat and Bench Press (both loads) for the four times of day. # represents main effect for load, * represents main effect for time of day, † represents and interaction for time of day by load.
Muscle lab: back squat: average force, peak velocity and time-to-peak velocity
Cosinor analysis revealed that AF, PV and tPV values back squat first load (30 kg) and last load (70 kg) demonstrated a significant circadian rhythm (). Daily variations in AF, PV and tPV were found (ES = 0.86, OP = 1.0; ES = 0.91, OP = 1.0 and ES = 0.84, OP = 1.0, p < 0.05; ). Pairwise comparisons showed higher values for AF, PV and lower values for tPV for back squat at 21:00 h compared to those observed 09:00 h (51.0 N, CI = 34.0 to 68.0 N; p < 0.001; 0.20 m.s−1, CI = 0.14 to 0.25 m.s−1; p < 0.001 and −0.12 s,CI = −0.18 to −0.06 s; p < 0.001, respectively) and 15:00 h (24.8 N, CI = 13.9 to 35.6 N; p < 0.001; 0.12 m.s−1,CI = −0.07 to 0.16 m.s−1; p < 0.001; −0.60 s,CI = −0.08 to −0.04 s; p < 0.001, respectively). Higher values for AF, PV and lower values for tPV for back squat at 21:00 h compared to those observed at 03:00 h were found (83.6 N, CI = 31.5 to 116.0 N; p < 0.001; 0.31 m.s−1, CI = 0.23 to 0.39 m.s−1; p < 0.001; −0.18 s,CI = −0.26 to −0.10 s; p < 0.001, respectively). Further, lower values for AF, PV and higher values for tPV for back squat at 03:00 h compared to those observed 09:00 h (−32.6 N, CI = 7.6 to 57.6 N; p = 0.011; −0.12 m.s−1,CI = −0.15 to −0.08 m.s−1; p < 0.001, −0.06 s, CI = 0.03 to 0.09 s; p < 0.001, respectively) and 15:00 h were found (−58.9 N,CI = −27.8 to −89.9 N; p < 0.001; −0.19 m.s−1,CI = −0.26 to −0.13 m.s−1; p < 0.001, 0.12 s, CI = 0.05 to 0.19 s; p < 0.001, respectively). Lastly, lower values for AF, PV and higher values for tPV for back squat at 09:00 h were present, compared to those observed at 03:00 h (−26.3 N,CI = −36.4 to −16.1 N; p < 0.001; −0.08 m.s−1,CI = −0.12 to −0.04 m.s−1; p < 0.001, 0.06 s, CI = 0.02 to 0.11 s; p = 0.006, respectively). A main effect for mass on the bar was found where higher AF, tPV and lower AP values at 70 kg than at 30 kg (335.1 N, CI = 303.9 to 366.3 N, p < 0.001, 0.31 s, CI = 0.23 to 0.38 s, p < 0.001; and −0.25 m.s−1, CI = −0.41 to −0.09 m.s−1; p = 0.007). Significant interactions were observed for tPV only (ES = 0.55, OP = 0.93, p = 0.003), where for tPV profiles of the two loads decreased from 09:00 to 21:00 h for both low and high masses on the bar. At 21:00 to 03:00 h the rate of increase at the higher mass is greater than the lower mass on bar ().
Profile of mood states
During the protocol there was a significant time of day variation for the subjective ratings of fatigue (p < 0.05) and vigour (p < 0.05) measured in arbitrary units (AU). Where vigour showed an inverse profile to that of fatigue; fatigue peaked in the early hours of the morning, whilst vigour scores peaked at a similar time to the rhythm of core temperature. No other variables (anger, depression, calm, confusion, tension and happy) showed any time-of-day effects (p > 0.05; see ). Cosinor analysis revealed that there was a circadian rhythm observed for three of the eight POMS factors: fatigue, vigour and happy (fatigue: mesor = 6.4, amplitude = 2.3, acrophase = 02:05 h, p < 0.05; vigour: mesor = 3.1 AU, amplitude = 2.2 AU, acrophase = 16:11 h, p < 0.05; happy: mesor = 4.0 = amplitude = 1.5, acrophase = 16:03 h, p < 0.05).
Discussion
We found that in a well-controlled and scientifically thorough protocol (that allowed recovery between each session and physical effort), that the Muscle-lab force-velocity linear encoder (Ergotest, version 4010, Norway) can detect significant circadian variations in muscle force output when used with back squat and bench press (multi-joint) exercises. Further, this piece of apparatus can detect rhythms for the three dimensions of muscle force output: AF, PV and tPV. Previously only a diurnal variation in muscle force output using force-velocity linear encoder when used with back squat, bench press or leg press has been shown (Pullinger et al. Citation2019; Brotherton et al. Citation2019, Robertson et al. Citation2018; Gallagher et al. Citation2023). Like others a main effect for “load” was found for both back squat and bench press where AF and tPV increased and PV values decreased, from lower to higher loads on the bar. Hence the lower resistance (mass on bar) allows for greater peak velocities and greater resistances commonly leading to larger average force values. Like Robertson et al. in the current study an interaction was found for “time of day” and “load” on the bar where participants produced maximal rates of velocity in less time during the heavier lifts, in both lower and upper body exercise in the evening. Although, the mechanisms regarding development of RFD remain largely unknown (Rodríguez-Rosell et al. Citation2017), this evening superiority in rate of force development (RFD) provides an insight as to how greater peak velocities and power outputs in the evening are achieved. This circadian effect on RFD may be linked with a selective effect on fast twitch protein isoforms (e.g. IIa or x myosin heavy chain profile) or on the processes of excitation contraction coupling (Malik et al. Citation2020). Such an observation provides a possible insight regarding the planning and timing of training sessions that specifically aim to develop RFD. Where a training session which is focussed on gross muscle force output towards an evening bias of scheduling, as the ability to generate greater overall velocity. Therefore, greater overall force, would appear to occur at that time.
In our strength conditioned individuals, when comparing the circadian characteristics outputs for Biodex Isokinetic and Isometric MVC methods as well as the Muscle Lab force-velocity linear encoder, measures of “peak torque” and “peak velocity” were consistently higher in the evening (Φ ~17:00 h). “Time-to-peak” torque/velocity was repeatedly slower for both Biodex Isokinetic Dynamometry (both speeds; 60 and 240°·s−1) and Muscle Lab force-velocity linear encoder (back squat and bench press) during the morning (Φ ~06:00–08:00 h). These diurnal variations agree with the literature (Blain et al. Citation2006; Callard et al. Citation2000; Edwards et al. Citation2013; Giacomoni et al. Citation2005; Sedliak et al. Citation2008) and the agreement of Muscle Lab circadian characteristics for muscle force output other measurements in this study (Biodex isokinetic dynamometry and percutaneous stimulation) suggests that a move away from laboratory-based, and single-joint, methods of measurement of muscle force output is viable. And that measures of muscle force output can now be measured, in a manner which is more directly transferable to the world of athletic and sports performance.
Circadian rhythms in resting Trec were found with Acrophase of 16:35 h were found, in agreement with others (Giacomoni et al. Citation2005). However a unique finding of this study was that vastus lateralis muscle temperature (3-cm depth) taken at rest (and then subsequently prior to each of the testing measures) exhibited a significant daily variation with an acrophase at 17:03 h, mesor of 37.43°C and amplitude of 0.23°C. Diurnal variation in local muscle temperature of similar magnitude (~0.31°C in vastus lateralis, Edwards et al. Citation2013), but this was after 5-mins of warm-up at 150 w, on a cycle ergometer. To our knowledge, this is the first time that a circadian rhythm of resting and pre-exercise state muscle temperature has been shown. The acrophases and amplitudes were not different for Tm and Trec (~43 min, p = 0.595 and ~ 0.07°C, p = 0.435), however mesor was higher in Tm and Trec (~0.79°C, p < 0.001). At present the endogenous component to muscle temperature has yet to be explored, certainly muscle temperature might differ from that of the core due to exposure to the environment. Whilst the participants of this study were given 30-min to acclimatise to the laboratory environment it could be that a much longer time is required to fully account for such potential influences. As such, it should be considered here that the influence of the environment may be a masking effect on observed temperature values.
The exact mechanisms for the observed rhythm in muscle performance are unknown. We have covered this previously (Edwards et al. Citation2013) but in brief it has been attributed to i) input from the body clock and proteins and peripheral clocks – that is, an endogenous component to the daily variation in muscle force production – has been suggested to be important (Zhang et al. Citation2009). The evidence relating to this is limited as no such study standardising the exogenous component has been undertaken in humans. ii) The causal link between core temperature and performance has been investigated, although this has been shown to be complex, due to a multiplicity of components and mechanisms which require further research (Edwards et al. Citation2013). Further, iii) peripheral such as tendon compliance (or decrease in stiffness), or muscle-related variables (contractility – time-to-peak velocity in agreement with the current study’s findings, metabolism, morphology of muscle fibres [contracted fascicle pennation angles, where maximal muscle force is expected to increase with increases in muscle fibre pennation angle; Pearson and Onambele Citation2005], accrued damage during exercise and local muscle temperature which we have shown to have circadian rhythm – but the strength of its endogenous component is unknown), which can be influenced by hormonal (such as testosterone and cortisol; Hayes et al. Citation2010; Sedliak et al. Citation2008) and ionic muscle process variations (Reilly and Waterhouse Citation2009; Tamm et al. Citation2009), and/or iv) central/neurological factors (central nervous system command, alertness, motivation, and mood; Castaingts et al. Citation2004; Giacomoni et al. Citation2005; Racinais et al. Citation2005, Citation2010) have been suggested.
A significant time-of-day effect for the perception of mood state (POMS) variables fatigue, vigour and happy (see ), with vigour and happy revealing an inverse profile to that of fatigue. These observations coincided with the measured factors of muscle force output, with fatigue corresponding with the earliest time-points and lowest muscle force values, and both vigour and happy corresponding with the later time-points and highest values of muscle force output. These results lend support towards the statements made by Reilly and Watherhouse (Citation2009), who proposed that there might be times of day when an individual just cannot muster a maximal effort.
Lastly, the decision to use the four time-periods employed in this study was regarding a) the fact that is quite common for most team events (e.g. rugby and football) to “kick-off” at 15:00 h, and so the endeavour was to collect data at a time which had greater meaning in a sporting application context (Drust et al. Citation2005) and b) in an attempt to consider the periods described by Reilly and Waterhouse (Citation2009) and Waterhouse et al. (Citation2005): 03:00–06:00 h (temperature minimum); 09:00–12:00 h (temperature rising most quickly); 15:00–18:00 h (temperature maximum); 21:00–24:00 h (temperature falling most quickly), as opposed to simply the two most contrasting points of the previously measured rhythm of Trec temperature (06:00 and 18:00 h). As we were able to detect rhythmicity across all factors of measurement to similar levels in the literature to those measuring at six time points our use of four time points and the times of day used did not compromised the thoroughness of this investigation
Limitations
We have shown clear circadian variation for muscle performance using the linear encoder. However, to measure the endogenous component to muscle force output and power, requires either using a constant routine or ultra-short wake-cycle experimental designs. In our study, we recruited intermediate chronotypes, future work could investigate the sensitivity of linear encoders to find a daily variation for muscle performance using outright morning or evening types. Although, rigour was applied to the research design where the present study used a counterbalanced design and considered all factors such as prior training history and status, calorific intake, light and room temperature (within the test laboratories). The only parameter which was not directly recorded or controlled was sleep and this was due to the “live-normal” conditions of the protocol. Lastly, although we targeted the body temperature minimum as a time point we only used 4 time-of-day points which is the lowest number to employ cosinor analysis to data – however we found the same peaks in rhythms as others using isometric and isokinetic dynamometry that used six time of day time points.
Summary
Irrespective of the type of testing modality, similar circadian characteristics outputs for Biodex Isokinetic and Isometric MVC methods as well as the Muscle Lab force-velocity linear encoder muscle force output were found. The MuscleLab linear encoder provides a suitable tool for measuring circadian variations in muscle force output on multi-joint movements which more closely resemble athletic performance. Further, factors such as the perception of fatigue, vigour and happiness, which demonstrate circadian rhythmicity may play some role in an individual’s ability to muster a maximum physical effort at specific times of day.
Practical implications
The present study agrees with the notion of an evening preference for strength training, supporting the idea such training should be undertaken in the early to late evening (~17:00 to ~ 19:00 h). Due to the diurnal nature of the current investigation, it is not possible to quantify how much of this is due to the endogenous component of circadian rhythmicity.
The agreement of Muscle Lab circadian characteristics for muscle force output other measurements in this study (Biodex isokinetic dynamometry and percutaneous stimulation) suggests that a move away from laboratory-based, single-joint and methods of measurement of muscle force output is viable. Where factors can now be measured in a manner, which is more directly transferable to the world of athletic and sports performance.
The components of muscle force output (“average force,” “peak velocity,” and “time-to-peak” velocity) have divided peak times; with the peak in “time to peak velocity” occurring in the morning, whilst “average force” and “peak velocity” both peak in the early evening (approximately 18:00 h). Such an observation could have a dramatic impact on the physical preparation and exercise training regimes of athletes who look to specifically influence an adaptive response to rate of force development training.
Acknowledgments
We would like to thank the participants who participated in the study. We would also like to acknowledge the intellectual input of Professor James M. Waterhouse who sadly passed away in October 2016.
Disclosure statement
No potential conflict of interest was reported by the author(s).
Additional information
Funding
References
- Araujo LG, Waterhouse J, Edwards B, Rosa Santos EH, Tufik S, de Mello MT. 2011. Twenty-four-hour rhythms of muscle strength with a consideration of some methodological problems. Biol Rhythm Res. 42:473–490. doi: 10.1080/09291016.2010.537444.
- Atkinson G, Nevill AM. 1998. Statistical methods for assessing measurement error (reliability) in variables relevant to sports medicine. Sports Med. 26:217–238. doi: 10.2165/00007256-199826040-00002.
- Baechle TR, Earle RW. 2015. Essentials of strength training and conditioning. 4th ed. Champaign, IL: Human Kinetics.
- Bambaeichi E, Reilly T, Cable N, Giacomoni M. 2005. The influence of time of day and partial sleep loss on muscle strength in eumenorrheic females. Ergonomics. 48:1499–1511. doi:10.1080/00140130500101437. PMID: 16338716.
- Batterham AM, Hopkins WG. 2006. Making meaningful inferences about magnitudes. Int J Sports Physiol Perform. 1:50–57. doi:10.1123/ijspp.1.1.50. PMID: 19114737.
- Blain H, Carriere I, Peninou G, Micallef JP, Colvez A. 2006. Reliability of a new instrument for measuring maximum rising strength. Am J Phys Med Rehabil. 85:502–508. doi:10.1097/01.phm.0000219246.26002.1b. PMID: 16715019.
- Bommasamudram T, Ravindrakumar A, Varamenti E, Tod D, Edwards BJ, Irene G, Peter IG, Pullinger SA. 2022. Daily variation on performance measures related to time-trials: A systematic review. Chronobiology International. 39:1167–1182. doi:10.1080/07420528.2022.2090373. Epub 2022 Jul 11. PMID: 35815685.
- Bosco C, Belli A, Astrua M, Tihanyi J, Pozzo R, Kellis S, Tsarpela O, Foti C, Manno R, Tranquilli C. 1995. A dynamometer for evaluation of dynamic muscle work. Eur J Appl Physiol Occup Physiol. 70:379–386. doi:10.1007/BF00618487. PMID: 7671871.
- Bougard C, Bessot N, Moussay S, Sesboue B, Gauthier A. 2009. Effects of waking time and breakfast intake prior to evaluation of physical performance in the early morning. Chronobiol Int. 26:307–323. doi:10.1080/07420520902774532. PMID: 19212843.
- Brotherton EJ, Moseley SE, Langan-Evans C, Pullinger SA, Robertson CM, Burniston JG, Edwards BJ. 2019. Effects of two nights partial sleep deprivation on an evening submaximal weightlifting performance; are 1 h powernaps useful on the day of competition? Chronobiol Int. 36:407–426. doi:10.1080/07420528.2018.1552702. Epub 2019 Jan 10. PMID: 30626222.
- Bruggisser F, Knaier R, Roth R, Wang W, Qian J, Scheer FAJL. 2023. Best time of day for strength and endurance training to improve health and performance? A systematic review with meta-analysis. Sports Med Open. 19:34. doi:10.1186/s40798-023-00577-5. PMID: 37208462; PMCID: PMC10198889.
- Callard D, Davenne D, Gauthier A, Lagarde D, Van Hoecke J. 2000. Circadian rhythms in human muscular efficiency: Continuous physical exercise versus continuous rest. A crossover study. Chronobiol Int. 17:693–704. doi:10.1081/CBI-100101075. PMID:11023216.
- Castaingts V, Martin A, VanHoecke J, Perot C. 2004. Neuromuscular efficiency of the triceps surae in induced and voluntary contractions: Morning and evening evaluations. Chronobiol Int. 21:631–643. doi:10.1081/CBI-120039207. PMID:15470959.
- Chiu LZ, Fry AC, Weiss LW, Schilling BK, Brown LE, Smith SL. 2003. Postactivation potentiation response in athletic and recreationally trained individuals. Strength Cond Res. 17:671–677. doi:10.1519/00124278-200311000-00008. PMID:14636093.
- Drouin JM, Valovich TC, Shultz SJ, Gansneder BM, Perrin DH. 2004. Reliability and validity of the biodex system 3 pro isokinetic dynamometer velocity, torque and position measurements. Eur J Appl Physiol. 91:22–29. doi: 10.1007/s00421-003-0933-0.
- Drust B, Waterhouse J, Atkinson G, Edwards B, Reilly T. 2005. Circadian rhythms in sports performance: An update. Chronobiol Int. 22:21–40. doi:10.1081/CBI-200041039. PMID:15865319.
- Edwards B, Waterhouse J, Reilly T, Atkinson G. 2002. A comparison of the suitabilities of rectal, gut, and insulated axilla temperatures for measurement of the circadian rhythm of core temperature in field studies. Chronobiol Int. 19:579–597. doi:10.1081/CBI-120004227. PMID:12069039.
- Edwards BJ, Harris C, Jackman Z, Linares-Alcolea R, Matta R, Pullinger SA, Doran DP, Pullinger SA, Burniston JG, Doran DA. 2024. Is there a diurnal variation in 4-km cycling time trial performance, where a standardised approach has been employed? BRR. 55:184–209. doi:10.1080/09291016.2024.2316401. In press.
- Edwards BJ, Pullinger SA, Kerry JW, Robinson WR, Reilly TP, Robertson CM, Waterhouse JM. 2013. Does raising morning rectal temperature to evening levels offset the diurnal variation in muscle force production? Chronobiol Int. 30:486–501. doi:10.3109/07420528.2012.741174. PMID: 23281719.
- Faul F, Erdfelder E, Lang AG, Buchner A. 2007. G*power 3: A flexible statistical power analysis program for the social, behavioral, and biomedical sciences. Behav Res Methods. 39:175–191. doi: 10.3758/BF03193146.
- Gallagher C, Austin V, Dunlop K, Dally J, Taylor K, Pullinger S, Edwards BJ. 2024. Effects of supplementing zinc magnesium aspartate on sleep quality and submaximal weightlifting performance, following two consecutive nights of partial sleep deprivation. Nutrients. 16:251. doi: 10.3390/nu16020251.
- Gallagher C, Green CE, Kenny ML, Evans JR, McCullagh GDW, Pullinger SA, Edwards BJ. 2023. Is implementing a post-lunch nap beneficial on evening performance, following two nights partial sleep restriction? Chronobiology International. 40:1169–1186. doi: 10.1080/07420528.2023.2253908.
- García-Ramos A, Stirn I, Strojnik V, Padial P, De la Fuente B, Argüelles-Cienfuegos J, Feriche B. 2016. Comparison of the force-, velocity-, and power-time curves recorded with a force plate and a linear velocity transducer. Sports Biomech. 15:329–341. doi:10.1080/14763141.2016.1161821. PMID: 27239893.
- Giacomoni M, Edwards B, Bambaeichi E, Waterhouse J, Reilly T. 2005. Gender differences in the circadian variations in muscle strength assessed with and without superimposed electrical twitches. Ergonomics. 48:1473–1487. doi:10.1080/00140130500101452. PMID:16338714.
- Gregson W, Batterham A, Drust B, Cable NT. 2005. The influence of pre-warming on the physiological responses to prolonged intermittent exercise. J Sports Sci. 23:455–464. doi: 10.1080/02640410410001730214.
- Hakkinen K. 1989. Neuromuscular and hormonal adaptations during strength and power training. J Sports Med Phys Fitness. 29:9–26. PMID: 2671501.
- Harris NK, Cronin J, Taylor K-L, Jidovsteff B, Sheppard JM. 2010. Understanding position transducer technology for strength and conditioning practitioners. Strength Cond J. 32:66–79. doi: 10.1519/SSC.0b013e3181eb341b.
- Hayes DL, Bickerstaff GF, Baker JS. 2010. Interactions of cortisol, testosterone, and resistance training: Influence of circadian rhythms. Chronobiol Int. 27:675–705. doi:10.3109/07420521003778773. PMID: 20560706.
- Jennings CL, Viljoen W, Durandt J, Lambert MI. 2005. The reliability of the FitroDyne as a measure of muscle power. J Strength Cond Res. 19:859–863. doi:10.1519/00124278-200511000-00023. PMID:16287353.
- Keogh JWL, Wilson GJ, Weatherby RP. 1999. A cross sectional comparison of different resistance training techniques in the bench press. Journal Of Strength And Conditioning Research. 13:247–258. doi: 10.1519/00124278-199908000-00012.
- Knaier R, Qian J, Roth R, Infanger D, Notter T, Wang W, CAJOCHEN C, SCHEER FAJL. 2022. Diurnal variation in maximum endurance and maximum strength performance: A systematic review and meta-analysis. Medicine & Science In Sports & Exercise. 54:169–180. doi: 10.1249/MSS.0000000000002773.
- Landrum RE. 1992. College students’ use of caffeine and its relationship to personality. Coll Stud J. 26:151–155.
- Malik Z, Bowden Davies K, Hall E, Barrett J, Pullinger S, Erskine R, Shepherd S, Iqbal Z, Edwards B, Burniston J. 2020. Diurnal differences in human muscle isometric force in vivo are associated with differential phosphorylation of sarcomeric M-Band proteins. Proteomes. 8:22. doi:10.3390/proteomes8030022. PMID: 32859009; PMCID: PMC7565642.
- McNair DM, Lorr M. 1971. Profile of mood states manual. San Diego (CA): Educational and Industrial testing services.
- Merton PA. 1954. Voluntary strength and fatigue. J Physiol. 123:553–564. doi: 10.1113/jphysiol.1954.sp005070.
- Monk TH, Leng VC. 1982. Time of day effects in simple repetitive tasks: Some possible mechanisms. Acta Psychol. 51:207–221. doi: 10.1016/0001-6918(82)90035-X.
- Morton JP, Atkinson G, MacLaren DPM, Cable NT, Gilbert G, Broome C, McArdle A, Drust B. 2005. Reliability of maximal muscle force and voluntary activation as markers of exercise-induced muscle damage. Eur J Appl Physiol. 94:541–548. doi: 10.1007/s00421-005-1373-9.
- Nelson W, Tong YLJ, Lee JK, Halberg F. 1979. Methods for cosinor-rhythmometry. Chronobiologia. 6:305–323. PMID: 548245.
- Newman SA, Jones G, Newham DJ. 2003. Quadriceps voluntary activation at different joint angles measured by two stimulation techniques. Eur J Appl Physiol. 89:496–499. doi: 10.1007/s00421-003-0836-0.
- O’Donnell S, Tavares F, McMaster D, Chambers S, Driller M. 2017. The validity and reliability of the GymAware linear position transducer for measuring counter-movement jump performance in female athletes. Measurement In Physical Education And Exercise Science. 22:101–107. doi: 10.1080/1091367X.2017.1399892.
- Oskouei MAE, van Mazijk BCF, Schuiling MHC, Hezrog W. 2003. Variability in the interpolated twitch torque for maximal and sub-maximal voluntary contractions. J Appl Physiol. 95:1648–1655. doi: 10.1152/japplphysiol.01189.2002.
- Pearson SJ, Onambele GNL. 2005. Acute changes in knee-extensors torque, fiber pennation, and tendon characteristics. Chronobiol Int. 22:1013–1027. doi:10.1080/07420520500397900. PMID: 16393705.
- Pullinger S, Robertson CM, Oakley AJ, Hobbs R, Hughes M, Burniston JG, Edwards BJ. 2019. Effects of an active warm-up on variation in bench press and back squat (upper and lower body measures. Chronobiol Int. 36:392–406. doi: 10.1080/07420528.2018.1552596.
- Racinais S, Connes P, Bishop D, Blonc S, Hue O. 2005. Morning versus evening power output and repeated-sprint ability. Chronobiol Int. 22:1029–1039. doi:10.1080/07420520500397918. PMID: 16393706.
- Racinais S, Oksa J. 2010. Temperature and neuromuscular function. Scan J Med Sci Sports. 20:1–18. doi:10.1111/j.1600-0838.2010.01204.x. PMID: 21029186.
- Ravindrakumar A, Bommasamudram T, Tod D, Edwards BJ, Chtourou H, Pullinger SA. 2022. Daily variation on performance measures related to anaerobic power and capacity: A systematic review. Chronobiol Int. 39:421–455. doi:10.1080/07420528.2021.1994585. PMID: 34978950.
- Reilly T, Atkinson G, Waterhouse J. 2000. Chronobiology and physical performance. In: Garrett W Jr Kirkendall D, editors. Exercise and sport science. Vol. 24. Philadelphia (PA): Lipcott Williams and Wilkins; p. 351–372.
- Reilly T, Waterhouse J. 2009. Sports performance: Is there evidence that the body clock plays a role? Eur J Appl Physiol. 106:321–332. doi:10.1007/s00421-009-1066-x. PMID: 19418063.
- Robertson CM, Pullinger SA, Robinson WR, Smith ME, Burniston JG, Waterhouse JM, Edwards BJ. 2018. Is the diurnal variation in muscle force output detected/detectable when multi-joint movements are analysed using the musclelab force-velocity encoder? Chronobiol Int. 35:1391–1401. doi: 10.1080/07420528.2018.1485685.
- Robinson WR, Pullinger SA, Kerry JW, Giacomoni M, Robertson CM, Burniston JG, Waterhouse JM, Edwards BJ. 2013. Does lowering evening rectal temperature to morning levels offset the diurnal variation in muscle force production? Chronobiol Int. 30:998–1010. doi:10.3109/07420528.2013.793197. PMID: 23863092.
- Rodríguez-Rosell D, Pareja-Blanco F, Aagaard P, González-Badillo JJ. 2017. Physiological and methodological aspects of rate of force development assessment in human skeletal muscle. Clin Physio Funct Imaging. 38:743–762. doi:10.1111/cpf.12495. Epub ahead of print.
- Sedliak M, Finni T, Peltonen J, Häkkinen JK. 2008. Effect of time-of-day-specific strength training on maximum strength and EMG activity of the leg extensors in men. J Sports Sci. 26:1005–1014. doi:10.1080/02640410801930150. PMID: 18608836.
- Smith C, Reilly C, Midkiff K. 1989. Evaluation of three circadian rhythm questionnaires with suggestions for an improved measure of morningness. J Appl Psych. 74:728–738. doi:10.1037/0021-9010.74.5.728. PMID: 2793773.
- Tamm AS, Largerquist O, Ley AL, Collins DF. 2009. Chronotype influences diurnal variations in the excitability of the human motor cortex and the ability to generate torque during a maximum voluntary contraction. J Biol Rhythms. 24:211–224. doi:10.1177/0748730409334135. PMID:19465698.
- Todd G, Gorman RB, Gandevia SC. 2004. Measurement and reproducibility of strength and voluntary activation of lower limb muscles. Muscle Nerve. 29:834–842. doi: 10.1002/mus.20027.
- Waterhouse J, Drust B, Weinert D, Edwards B, Gregson W, Atkinson G, Kao S, Aizawa S, Reilly T. 2005. The circadian rhythm of core temperature: Origin and some implications for exercise performance. Chronobiol Int. 22:207–226. doi:10.1081/cbi-200053477. PMID: 16021839.
- Winget CM, DeRoshia CW, Holley DC. 1985. Circadian rhythms and athletic performance. Med Sci Sports Exerc. 17:498–516. doi:10.1249/00005768-198510000-00002. PMID: 3906341.
- Youngstedt SD, O’Connor PJ. 1999. The influence of air travel on athletic performance. Sports Med. 28:197–207. doi:10.2165/00007256-199928030-00004. PMID: 10541442.
- Zhang X, Dube TJ, Esser KA. 2009. The role of clock genes in 685 cardiometabolic disease: Working around the clock: circadian rhythms and skeletal muscle. J Appl Physiol. 107:1647–1654. doi:10.1152/japplphysiol.00725.2009. PMID: 19696362.