
Abstract
Objective: To determine whether completing a pre-enrollment Web-based alcohol brief motivational intervention (BMI) increased student retention and reduced student alcohol-related violations. Participants: Fall 2011 (3,364) and Fall 2012 (3,111) entering cohorts of all first-year students at a midwestern state university. Method: Students completing the brief intervention (BI) were compared to students not completing the BI. Retention was tracked for four years for the 2011 cohort and three years for the 2012 cohort. Campus and community alcohol violations were tracked for two academic years following enrollment. Kaplan–Meier survival analysis and Cox regression were used to test retention survival. Logistic regression was used to test campus and community violations. Results: Students in both cohorts who completed the BI had significantly higher retention and significantly fewer alcohol-related violations than noncompleters. Conclusions: Population-level Web-based BIs help prevent student dropout and decrease alcohol-related violations, with impacts extending multiple years. Web-based BI is an efficacious population-level prevention tool.
Multiple studies have documented the extensive harms experienced by college students as a function of excessive and problematic drinking, including increased injury and death.Citation1,Citation2 Studies have also documented academic consequences of excessive and problem drinking, including missing classes and assignments and lower GPA.Citation2,Citation3 Only a small number of studies, however, have looked at how student drinking impacts retention and dropout. Scott et alCitation4 found that drinking did not predict dropout in the freshmen year, but more recently, Liguori and LonbakenCitation5 found that excessive and heavy episodic (binge) drinking was associated with higher likelihood of dropping out. In the only study to look longitudinally across all four years of college, Martinez et alCitation6 found that heavy drinking was associated with dropping out. In addition to higher rates of dropping out, studies have found that 5–8% of students had involvement with campus security or community police for violation of alcohol laws and policies.Citation2
Beyond the personal harms to the student from legal consequences or dropping out, the cost of student dropouts for institutions is substantial. In a comprehensive study of 1,669 US postsecondary institutions, RaismanCitation7 estimated that postsecondary institutions lose almost $16.5 billion annually from student dropouts. The loss on average was $13,267,214 for a public school and $8,331,593 for a private school. Thus, student dropout represents a significant loss of revenue for institutions.Citation8 This revenue loss is especially critical for public institutions, as state support has been dropping as a proportion of revenue.Citation8 These trends have made student retention a high priority for postsecondary administrators and educators. Alcohol violations also cost institutions in terms of policing, security, health and counseling services, and administration of sanctions associated with the violation.
Because of the heavy personal and institutional costs associated with problem drinking, interventions that reduce heavy episodic drinking may reduce problems and associated costs from dropout and sanctions. Brief intervention (BI) [also known as screening and brief intervention (SBI), brief motivational intervention (BMI), or brief alcohol intervention (BAI) has been shown to be an effective approach to reduce high-risk drinking and associated harms among college students. The BIs were Tier 1 approaches in the NIAAA tiers of effectiveness and are higher effectiveness approaches in the recent College AIM.Citation9 The BI use is increasing in various forms across postsecondary institutions.
The BI consists of a structured set of questions designed to identify individuals at risk for alcohol use problems. Screening questions ask about drinking and related harms to determine whether individuals are misusing alcohol. Answers to screening questions are then evaluated and shared with the person. In face-to-face clinical or counseling sessions, the BI lasts 5–15 minutes. The purpose is to increase the person’s awareness of her/his personal alcohol use and subsequent consequences and risks and use this information to motivate the person to either reduce risky drinking or seek treatment, hence the common reference to this technique as BMI.
The BI originated in clinical alcohol treatment, where it was found effective for reducing drinking and harms for heavy drinkers.Citation10,Citation11 In the 1990s, BI was introduced into college environments for intervention with high-risk and problem drinkers.Citation12–14 As in clinical settings, BI in college was initially delivered face to face. The most well-known and frequently used face-to-face college BIs are the Brief Alcohol and Screening Intervention for College Students (BASICS) for individual counseling and the group counseling adaptation of BASICS, the Alcohol Skills Training Program (ASTP).Citation13,Citation14 The target population for BASICS and ASTP was students sanctioned for alcohol offensesCitation15 or otherwise identified as high-risk drinkers through assessments or surveys.Citation13,Citation14 Numerous studies and reviews have documented the effectiveness of face-to-face college BI for reducing drinking and self-reported harms, sometimes over extended time periods.Citation10,Citation16
The BASICS and ASTP used screening questions about quantity and frequency of drinking, harms experienced from drinking, and risk factors, both biological (family drinking history) and behaviors (eg, drinking and driving). Motivational feedback discussed in the face-to-face session typically included information about the quantity/frequency of consumption, peak blood alcohol levels, comparison of the student’s self-reported consumption with general or local drinking norms, money spent on alcohol, risk factors (eg, tolerance, dependence, and genetic risk), and associated risk behaviors (eg, drinking and driving; smoking). As research identified student misperceptions about drinking as a key factor in problem drinking, screening questions were expanded to include student perceptions of their fellow students’ drinking.Citation12,Citation17
In the 2000s, studies began examining whether the personalized motivational feedback components of BI might be effective by themselves. Evaluations of personalized motivational feedback – first in mail form and later in email format – found that simply providing students with feedback (eg, quantity/frequency of consumption, peak blood alcohol levels, comparison drinking norms, risk factors, and misperceptions) by itself was nearly as effective as face-to-face BASICS or ASTP counseling sessions at reducing consumption, heavy episodic drinking, and self-reported harms.Citation10,Citation17,Citation18 With the Web expansion, the mail and email approaches were quickly adapted into self-contained Web-administered BIs, such as e-CHECK UP TO GO® (e-CHUG), that contained a section for students to input their drinking, harms, and risk information and then immediately receive the personalized motivational feedback via email, download, or online.Citation18,Citation19 Reviews of Web-based BIs have typically found them to be effective.Citation20–23
Originally, BI was targeted to college students who were high-risk drinkers, often identified via sanctions or by known high-risk group membership, such as Greek students. As such, BI is a clinical treatment given to problem drinkers needing intervention. As the use of BI spread, however, its administration was expanded, typically in the form of pre-enrollment or freshmen year delivery, to the general student population, which included abstainers and students not meeting problem drinking criteria. This expansion moved BI from a treatment intervention to a prevention tool. Sometimes these pre-enrollment interventions were extensions of existing BIs that were moved from treatment to prevention use with minimal modification, for example, e-CHUG.Citation24 Also, a BI component was included in broader pre-enrollment alcohol education programs such as AlcoholEDU® and Alcohol-Wise®.
Findings for the effectiveness of these pre-enrollment or general student prevention approaches are less clear than for BI in clinical settings. Fewer systematic peer-reviewed studies of pre-enrollment and freshman BI exist, especially for the commercial education programs. Existing studies have generally found short-term reductions in drinking and harms, but not always.Citation25–28 Student attrition has been a major methodological problem. Although all or most students may take the BI or educational program initially, follow-up response rates, even in the short term, have been around 50% or less. Long-term high-quality cohort data have been lacking.Citation29
The lack of strong evidence that pre-enrollment prevention BI reduces drinking does not mean these programs are unsuccessful. Most entering first-year students are either abstainers or do not drink excessively if they drink. Thus, reductions in drinking may not appear in evaluations of pre-enrollment BIs. The goals for pre-enrollment BI extend beyond intervention with problem drinkers to include reducing drinking uptake by new students who are abstainers and helping new students who are low-risk drinkers to resist increasing their alcohol use after moving to the new environment of college.
Along with these goals for students, another reason for pre-enrollment population-level alcohol prevention BI is to reduce negative academic consequences, especially dropping out of school and institutional or community violations that place students at risk for dropping out. There have been only limited examinations of these types of outcomes. Abrams et alCitation30 found that students who completed a pre-enrollment alcohol education program (AlcoholEDU®) were less likely to seek medical treatment for alcohol-related incidents than noncompleters. Doumas et alCitation31 found that heavy drinking students completing the e-CHECK UP TO GO® had fewer judicial sanctions than those not completing e-CHECK UP TO GO®. Lane and SchmidtCitation32 found that students taking a BI or alcohol education program during their first semester had higher retention than control students not receiving any alcohol programing. These studies suggest that pre-enrollment BI may help reduce legal violations and dropouts.
If pre-enrollment BI can help reduce violations and dropouts, their positive impacts on students for staying in school and reducing institutions’ costs may be justification enough for employing them, even if there is minimal or unclear impact on individual student drinking. However, there are no studies examining the impact of pre-enrollment BI on long-term student retention or on the number of student campus and community alcohol violations.
The present study
The objective of this study was to examine whether completing a pre-enrollment BI increases student retention and reduces alcohol-related campus and community violations. In Fall 2009, the University of Nebraska – Lincoln (UNL) began using the “Year 1 College Alcohol Profile” (Y1-CAP) as a Web-based pre-enrollment prevention BI for incoming first-year students. Following participation in the Robert Wood Johnson Foundation funded A Matter of Degree Program in the 1990s, heavy episodic (binge) drinking rates at UNL declined substantially.Citation33 By the early 2000s, entering first-year cohorts had high levels of abstinence and low levels of heavy episodic drinking. First-year students often have misperceptions about the amount of drinking that takes place among their peers.Citation12,Citation17 Administrators at UNL saw an opportunity to provide feedback about the low drinking norms at UNL to incoming students through a BI to correct these misperceptions.
Existing commercial Web-based BIs at the time were not customizable to the specific first-year student drinking norms that UNL wanted to use to address misperceptions. This led to the development of the Y1-CAP, which was customized for entering college freshman using the norm reference information based on the drinking of students at UNL rather than national norms with separate tracks for men and women. Also, Y1-CAP contained a separate abstainer track that reinforced the decision to abstain. Although unique at the time, most commercial Web-based BIs and alcohol education programs now provide similar features and capabilities for using local normative data.
The Y1-CAP incorporated motivational feedback information similar to the screening information obtained for face-to-face BIs such as BASICS or ASTP.Citation34 Students entered typical weekly drinking in the past month using the Daily Drinking Questionnaire.Citation35 Harms were entered using the Rutgers’ Alcohol Problem Index (RAPI).Citation36 Students also were asked to indicate (a) frequency of drinking and driving and riding with an intoxicated driver in the past month, (b) family history of alcohol problems, (c) perceptions of fellow first-year student drinking, (d) personal approval of drinking and driving and being intoxicated on a date, and (e) monthly spending on alcohol.
Based on these student inputs, feedback was provided on quantity/frequency of consumption (average drinks per occasion and per week; times drinking per month), peak blood alcohol levels (BAC), and reported harms. These were compared to norms for first-year students at the University. Student normative perceptions were compared to actual drinking and injunctive norms to correct misperceptions. Information about risks associated with reported drinking levels and drinking and driving was provided. Additional information was provided on protective strategies, campus/community alcohol policies and enforcement, as well as campus resources and contact information for campus prevention and counseling services.
The Y1-CAP is administered prior to the fall semester. Incoming first-year students under age 21 and their parents receive letters from the Vice Chancellor for Student Affairs directing them to the Web address for the Y1-CAP. The letter expresses that he/she (or their student, in the parent letter) is expected to complete the Y1-CAP prior to coming to campus. Noncompleting students are sent up to two follow-up email reminders at approximately 10-day intervals. The Y1-CAP is closed after the first week of classes. The Vice Chancellor’s correspondence represents a “soft” mandate in that there is no consequence for noncompletion. As a result of the soft mandate, there are still around 10–20% of students who do not complete the Y1-CAP. This study capitalized on this noncompletion to conduct a natural quasi-experiment. The Y1-CAP completers and noncompleters were compared to determine whether those students who completed the Y1-CAP had better long-term retention and fewer alcohol-related violations and sanctions than students who did not do the Y1-CAP.
For this study, two entering cohorts of first-year students were examined: Fall 2011 and Fall 2012. For retention, enrollment was tracked for four years for the 2011 cohort and three years for the 2012 cohort. For campus and community alcohol violations, violations were tracked for two academic years following enrollment.
Study hypotheses were as follows:
Hypothesis 1: Students completing the Y1-CAP will have higher retention (lower likelihood of dropping out).
Hypothesis 2: Students completing the Y1-CAP will have fewer (a) campus judicial sanctions and (b) community alcohol violations.
Method
Participants
Participants were the cohorts of entering first-year students at the UNL in 2011 and 2012. These cohorts included all first-year students except for varsity athletes in 2012. The 2011 cohort was 3,364 students and the 2012 cohort was 3,111 students. Specific demographics for both samples broken down by Y1-CAP BI completion and Y1-CAP noncompletion are shown in .
Table 1. Sample demographics.
Measures
Retention
Student retention was measured by subsequent semester enrollment. For the Fall 2011 cohort, these semesters were Fall 2012, Spring 2013, Fall 2013, Spring 2014, Fall 2014, and Spring 2015. For the Fall 2012 cohort, these semesters were Fall 2013, Spring 2014, Fall 2014, and Spring 2015. Enrollment records were obtained from the University Registrar Office.
Campus judicial sanctions and community violations
Student campus judicial sanctions for alcohol-related violations were obtained from the University Dean of Students, Office of Student Judicial Affairs. Student off-campus alcohol citations were obtained from the city police department. Through an agreement with the University, the city police department forwards all minor in possession, driving under the influence, and disorderly house citations involving University students to the University. Campus judicial sanctions for alcohol and off-campus alcohol citations were tracked for the students’ first two enrollment years. For the 2011 cohort, these were the 2011–2012 (Year 1) and 2012–2013 (Year 2) calendar (July 1–June 30) years. For the 2012 cohort, these were the 2012–2013 (Year 1) and 2013–2014 (Year 2) calendar (July 1–June 30) years.
Y1-CAP administration procedures
The Y1-CAP was administered pre-enrollment via a Web-based platform as previously described. All procedures were approved by the University’s Institutional Review Board.
Results
Student enrollment retention
Retention was tested with survival analysis. Survival analysis analyzes the time (t) until the occurrence of an event. In this study, the event was dropping out of the university with two categories: dropped out and remained enrolled. Student enrollment was determined starting with the next academic year after initial enrollment (Fall 2012 for the 2011 cohort; Fall 2013 for the 2012 cohort) and then for each subsequent semester through Spring 2015. Survival time (retention) was defined as the number of semesters that student remained enrolled. Semesters were recorded in months starting at 12 (for the next academic year) and then at six-month increments (18, 24, 30, etc) for successive spring and fall semesters. For the 2011 cohort, this continued through the spring semester of what would be the student’s senior year (48 months). For the 2012 cohort, this continued through the spring semester of what would be the student’s junior year (36 months). Students who were still enrolled Spring of 2015 constituted the enrolled group; students who were not enrolled at any time period constituted the dropout group. Students were counted as dropping out at their initial nonenrollment semester regardless of whether they subsequently reenrolled. Two statistical indicators were computed. The survival function is the probability of still being enrolled at each semester. The hazard function is the probability that a student will dropout at the next semester, given that they have remained enrolled to the current semester (eg, will dropout Spring 2014 given that they were enrolled in Fall 2013).
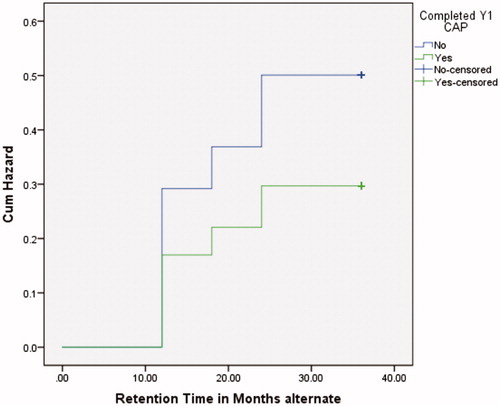
Kaplan–Meier survival curvesCitation37 were used to compare the survival of students who completed the Y1-CAP and those who did not. For the 2011 cohort, the survival function is shown in and the hazard function is shown in . Students who completed Y1-CAP had significantly higher retention than noncompleters (Mantel–Cox log-rank test, χ2 (1) = 10.42, p = .001). For the 2012 cohort, the survival function is shown in and the hazard function is shown in . Students who completed Y1-CAP had significantly higher retention than noncompleters (Mantel–Cox log-rank test, χ2 (1) = 48.50, p < .0001).
Figure 1. 2011 Cohort survival function.
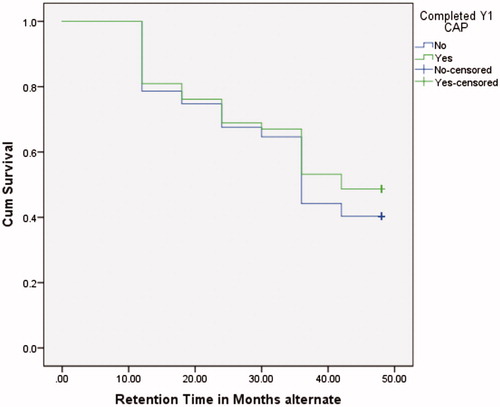
Figure 2. 2011 Cohort hazard function.
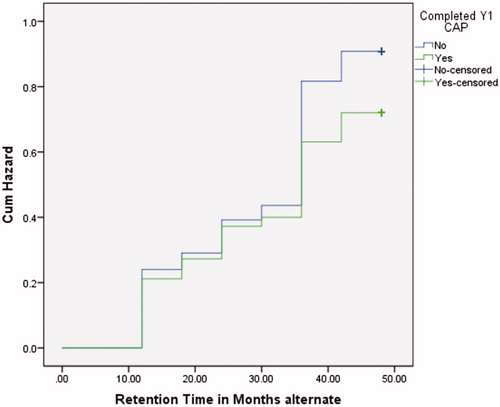
Figure 3. 2012 Cohort survival function.
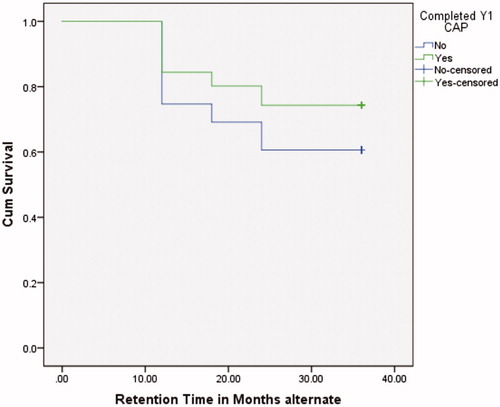
Figure 4. 2012 Cohort hazard function.
Because Y1-CAP completers and noncompleters differed in key demographic variables of race/ethnicity (white vs. non-white), residency (Nebraska resident vs. nonresident student), and gender (men vs. women), Cox regression was used to test for the impact of Y1-CAP completion on survival controlling for these. Regressions were run hierarchically, with demographic variables entered on the first step and Y1-CAP completion entered on the second step. Significance of Y1-CAP completion was determined from Step 2 change.
For the 2011 cohort, the final Cox regression () was marginally not significant (−2 log-likelihood = 27,914.27, χ2 (4) = 9.14, p = .058). However, the Step 2 change testing the effect of Y1-CAP completion was significant (χ2 (1) = 8.23, p = .004). This confirmed Kaplan–Meier survival analysis findings as students completing Y1-CAP had significantly higher odds of retention than noncompleters with race, residency, and gender controlled.
Table 2. Cox regression 2011 and 2012 cohorts’ survival.
For the 2012 cohort, the overall Cox regression () was significant (−2 log-likelihood = 14,056.16, χ2 (4) = 45.54, p < .0001). The Step 2 change testing the effect of Y1-CAP completion was significant (χ2 (1) = 36.25, p < .0001). This confirmed Kaplan–Meier survival analysis findings as students completing Y1-CAP had significantly higher odds of retention than noncompleters when race, residency, and gender were controlled.
Campus judicial alcohol-related sanctions and off-campus alcohol citations
For the 2011 cohort, students completing the Y1-CAP had significantly fewer Year 1 campus alcohol-related judicial sanctions (: χ2 (1) = 11.70, p = .001) and off-campus alcohol citations (: χ2 (1) = 23.99, p < .0001) than noncompleters. In Year 2, students completing the Y1-CAP continued to have significantly fewer campus alcohol judicial sanctions (: χ2 (1) = 10.98, p < .0001) and off-campus alcohol citations (: χ2 (1) = 10.49, p = .001) than noncompleters.
Table 3. University alcohol-related judicial sanctions and off-campus alcohol citations by Y1-CAP completion.
For the 2012 cohort, students completing the Y1-CAP had significantly fewer Year 1 campus alcohol-related judicial sanctions (: χ2 (1) = 9.20, p = .002) and off-campus alcohol citations (: χ2 (1) = 13.75, p < .0001) than noncompleters. In Year 2, however, students completing the Y1-CAP did not significantly differ from noncompleters for either campus judicial sanctions (: χ2 (1) = 0.11, p = .741) or off-campus citations (: χ2 (1) = 0.92, p = .337).
Because the Y1-CAP completers and noncompleters differed in key demographic variables of race/ethnicity (white vs. non-white), residency (Nebraska resident vs. nonresident student), and gender (men vs. women), logistic regression was used to test for the impact of Y1-CAP completion on campus judicial alcohol sanctions and off-campus alcohol citations controlling for these. Regressions were run hierarchically, with demographic variables entered on the first step and Y1-CAP completion entered on the second step. Significance of Y1-CAP completion was determined from Step 2 change.
For the 2011 cohort, the final logistic regression () for alcohol-related judicial sanctions was significant in Year 1 (−2 log-likelihood = 2,023.33, χ2 (4) = 18.69, p = .001) and Year 2 (−2 log-likelihood = 633.23, χ2 (4) = 16.76, p = .002). The Step 2 change testing the effect of Y1-CAP completion controlling for race, residency, and gender was significant in Year 1 (χ2 (1) = 10.03, p = .002) and Year 2 (χ2 (1) = 7.76, p = .005). The Y1-CAP completion reduced the odds of a Year 1 campus alcohol-related judicial sanction by approximately 40% and odds of a Year 2 judicial sanction by approximately 55%.
Table 4. Logistic regression 2011 cohort university alcohol-related judicial sanctions and off-campus alcohol citations.
The final logistic regression () for off-campus alcohol citations for the 2011 cohort was significant in Year 1 (−2 log-likelihood = 1,485.93 (4) = 30.84, p < .0001) and Year 2 (−2 log-likelihood = 690.27, χ2 (4) = 30.92, p < .0001). The Step 2 change testing the effect of Y1-CAP completion controlling for race, residency, and gender was significant in Year 1 (χ2 (1) = 19.45, p < .0001) and Year 2 (χ2 (1) = 6.64, p = .01). The Y1-CAP completion reduced the odds of a Year 1 off-campus alcohol citation by about 55% and odds of a Year 2 off-campus citation by approximately 50%.
For the 2012 cohort, the final logistic regression () for alcohol-related judicial sanctions was significant in Year 1 (−2 log-likelihood = 1,732.50, χ2 (4) = 21.88, p = .001) and Year 2 (−2 log-likelihood = 738.85, χ2 (4) = 14.10, p = .007). The Step 2 change testing the effect of Y1-CAP completion controlling for race, residency, and gender was significant in Year 1 (χ2 (1) = 7.20, p = .007) but not significant in Year 2 (χ2 (1) = 0.04, p = .839). The Y1-CAP completion reduced the odds of a campus alcohol-related judicial sanction in Year 1 by approximately 33% but did not affect judicial sanctions in Year 2.
Table 5. Logistic regression 2012 cohort university alcohol-related judicial sanctions and off-campus alcohol citations.
The final logistic regression () for off-campus alcohol citations for the 2012 cohort was significant in Year 1 (−2 log-likelihood = 1,038.33, χ2 (4) = 16.43, p = .002) and Year 2 (−2 log-likelihood = 692.58, χ2 (4) = 19.60, p = .001). The Step 2 change testing the effect of Y1-CAP completion when controlling for race, residency, and gender was significant in Year 1 (χ2 (1) = 11.69 p = .001) but not significant in Year 2 (χ2 (1) = 0.64, p = .425). The Y1-CAP completion reduced the odds of a Year 1 off-campus alcohol citation by about 50% but did not affect off-campus citations in Year 2.
Comment
Student enrollment retention
The Y1-CAP completion had significant impact on student retention. Students completing Y1-CAP in both the 2011 and 2012 cohorts were less likely to dropout than noncompleters. The effect of Y1-CAP completion was most pronounced for the 2012 cohort where survival effects were seen at the end of the first year with survival increasing with each successive semester. With demographics controlled, Cox regression showed the odds of dropping out were reduced by almost 40% for 2012 Y1-CAP completers. Impacts were smaller for the 2011 cohort and took longer to appear. There was only a minimal survival advantage for Y1-CAP completers through their first three academic years. Only at fall semester of their senior (fourth) year did significant survival and hazard ratio differences appear. These continue and increase for the senior spring semester. Cox regression with demographics controlled was significant but there were only 17% reduced odds of dropping out for Y1-CAP completers.
There were no obvious differences in demographics between the 2011 and 2012 cohorts. There were no changes in admissions standards or policies in the two years. So it is unclear why the effects on retention were so much larger for the 2012 cohort.
Campus judicial alcohol-related sanctions and off-campus alcohol citations
Completion of Y1-CAP reduced the likelihood of students having alcohol-related campus or community violations. In both the 2011 and 2012 cohorts, students completing Y1-CAP had about one-third the campus alcohol-related judicial sanctions and about one-half the off-campus alcohol citations in their first year as those noncompleters. When race, gender, and instate residency were controlled, odds were about .6 for a campus alcohol judicial sanction and about .5 for an off-campus alcohol citation for Y1-CAP completers relative to noncompleters. Results were similar in Year 2 for the 2011 cohort as Y1-CAP completers had less than one-half of the campus judicial sanctions and less than one-half of the off-campus alcohol citations as noncompleters. The Y1-CAP completers had odds of a judicial sanction about .4 and odds of an off-campus citation about .5 relative to noncompleters.
Findings suggest that Y1-CAP completion reduces the likelihood that students’ will suffer either campus or community legal consequences from their drinking. Results were more pronounced for the students’ first year, but freshmen year is particularly high risk for negative consequences from drinking, whether legal or personal.Citation38 So reductions of close to 50% in legal consequences during this time are meaningful. The Y1-CAP impact was similar in Year 2 for only the 2011 cohort. Total campus judicial alcohol-related sanctions and off-campus alcohol citations, however, were considerably lower in Year 2 for both the 2011 and 2012 cohorts. This was especially true for the 2012 cohort where the overall rates of sanctions and citations in Year 2 were under 4%, leaving less room for any possible Y1-CAP effects.
Study limitations
The primary study limitation is lack of a fully randomized trial for comparison. Although demographic differences can be controlled, we have no way of knowing whether students taking Y1-CAP differed in their drinking or other meaningful mediators from the noncompleters in ways that might have affected their retention or likelihood of alcohol-related violations. That is problematic for any population-level intervention. Although future randomized trials might provide more conclusive evidence for pre-enrollment BI effectiveness, a randomized trial loses whatever population-level cohort effects might be present from 80% to 90% of students having taken the same BI and receiving consistent feedback.
A second limitation related to the population-level nature of the Y1-CAP BI, which was aimed at all entering students, is that the Y1-CAP treatment group was considerably larger than the non-Y1-CAP control group. Any systematic differences between Y1-CAP completers and noncompleters may have been magnified by the sample size differences.
There are many factors that influence whether students continue in school or dropout. Although we could control for some common demographic influences, we do not have information on other important factors like socioeconomic status. Therefore, while we can show that students taking Y1-CAP had fewer campus or community violations and higher retention, we cannot determine how much of a factor Y1-CAP was relative to other possible influences.
Finally, although not a limitation of the study itself, Y1-CAP like all Web-based BIs relies on students providing true and accurate responses to the screening input questions. There is no medical professional to discuss the screening information and provide feedback. As a result, there is no opportunity to question or verify screening inputs. We would assume that students who are not accurate in their responses or who provide deliberately inaccurate information do not receive full benefit from the BI. We have no way of knowing how many students might have provided inaccurate information. Despite this potential confound, the findings still indicate that Y1-CAP had a population-level positive impact.
Summary and conclusion
The Y1-CAP is typical of current pre-enrollment, population-level BIs. The findings support that these types of pre-enrollment, population-level BI can help increase student retention and decrease student alcohol-related campus and community violations. Impacts appear to extend beyond the first year and affect retention throughout an entire four-year enrollment. Although absolute differences are not large, the economic impacts from student attrition are potentially significant. The difference in retention between Y1-CAP completers and noncompleters translates into approximately $1,429,296 dollars for one year of lost student tuition and fee revenue at the university. This is a significant economic loss.
Interestingly, the impacts of Y1-CAP completion on alcohol-related judicial sanctions and off-campus alcohol citations were stronger in the 2011 cohort than in the 2012 cohort, whereas the impacts on retention were more pronounced in the 2012 cohort. Clearly, other factors moderate or mediate effects from Y1-CAP completion and need further exploration.
Overall, findings add support for the efficacy of pre-enrollment Web-based BI as population-level prevention tools. Along with prior findings that pre-enrollment BI may reduce drinking and heavy episodic drinking,Citation25–28 study findings show important impacts on academic and personal harms. Like Lane and Schmidt,Citation32 this study found that taking a pre-enrollment Web-based BI decreased dropping out. Consistent with Abrams et al,Citation30 these findings suggest that students taking pre-enrollment BI have reduced alcohol-related harms. These results support the utility of implementing pre-enrollment BI in postsecondary settings as valuable prevention tools for reducing negative impacts of alcohol on students. Increasing student retention and reducing legal and judicial consequences are important in their own right.
Additionally, the findings support that implementing a pre-enrollment BI may significantly reduce institutional costs associated with student dropout and student legal and institutional alcohol-related violations. We do not know whether the Y1-CAP had any effect on individual student heavy episodic drinking or other alcohol-related risks. The findings, however, suggest that taking the Y1-CAP had positive effects on student retention and on reducing student alcohol-related violations regardless of whether it did or did not change student drinking. This suggests that implementation of a pre-enrollment BI can have important benefits for administrators and educators.
Conflict of interest disclosure
The authors have no conflicts of interest to report. The authors confirm that the research presented in this article met the ethical guidelines, including adherence to the legal requirements, of the United States and received approval from the Institutional Review Board of the University of Nebraska – Lincoln.
Additional information
Funding
References
- Hingson R, Zha W, Smyth D. Magnitude and trends in heavy episodic drinking, alcohol-impaired driving, and alcohol-related mortality and overdose hospitalizations among emerging adults of college ages 18–24 in the United States, 1998–2014. J Stud Alcohol Drugs. 2017;78(4):540–548.
- White A, Hingson R. The burden of alcohol use: excessive alcohol consumption and related consequences among college students. Alcohol Res. 2014;35(2):201–218.
- Thombs DL, Olds RS, Bondy SJ, Winchell J, Baliunas D, Rehm J. Undergraduate drinking and academic performance: a prospective investigation with objective measures. J Stud Alcohol Drugs. 2009;70(5):776–785.
- Scott DM, Spielmans GI, Julka DC. Predictors of academic achievement and retention among college freshmen: a longitudinal study. Coll Stud J. 2004;38(1):66–80.
- Liguori G, Lonbaken B. Alcohol consumption and academic retention in first-year college students. Coll Stud J. 2015;49(1):69–77.
- Martinez JA, Sher KJ, Wood PK. Is heavy drinking really associated with attrition from college? The alcohol-attrition paradox. Psychol Addict Behav. 2008;22(3):450–456.
- Raisman N. The Cost of College Attrition at Four-Year Colleges & Universities: An Analysis Of 1669 Us Institutions. Virginia Beach, VA: The Educational Policy Institute, Policy Perspective; 2013.
- Hinrichs P. Trends in Revenues at US Colleges and Universities, 1987–2013. Federal Reserve Bank of Cleveland. Economic Commentary. 2017; March 23, 2017. Available at: https://ideas.repec.org/a/fip/fedcec/00066.html.
- National Institute on Alcohol Abuse and Alcoholism. Planning Alcohol Interventions Using NIAAA’s College AIM Alcohol Intervention Matrix. Washington, DC: National Institute on Alcohol Abuse and Alcoholism; 2015.
- Saunders JB, Kypri K, Walters ST, Laforge RG, Larimer ME. Approaches to brief intervention for hazardous drinking in young people. Alcohol Clin Exp Res. 2004;28(2):322–329.
- WHO Brief Intervention Study Group. A cross-national trial of brief interventions with heavy drinkers. Am J Public Health. 1996;86(7):948–955.
- Agostinelli G, Brown JM, Miller WR. Effects of normative feedback on consumption among heavy drinking college students. J Drug Educ. 1995;25(1):31–40.
- Baer JS, Marlatt GA, Kivlahan DR, Fromme K, Larimer ME, Williams E. An experimental test of three methods of alcohol risk reduction with young adults. J Consult Clin Psychol. 1992;60(6):974–979.
- Marlatt GA, Baer JS, Kivlahan DR. Screening and brief intervention for high-risk college student drinkers: results from a 2-year follow-up assessment. J Consult Clin Psychol. 1998;66(4):604–615.
- DiFulvio GT, Linowski SA, Mazziotti JS, Puleo E. Effectiveness of the Brief Alcohol and Screening Intervention for College Students (BASICS) program with a mandated population. J Am Coll Health. 2012;60(4):269–280.
- Larimer ME, Cronce JM. Identification, prevention and treatment: a review of individual-focused strategies to reduce problematic alcohol consumption by college students. J Stud Alcohol Suppl. 2002;Supplement(s14):148–163. doi: 10.15288/jsas.2002.s14.148.
- Neighbors C, Larimer ME, Lewis MA. Targeting misperceptions of descriptive drinking norms: efficacy of a computer-delivered personalized normative feedback intervention. J Consult Clin Psychol. 2004;72(3):434–447.
- McCambridge J, Bendtsen M, Karlsson N, White IR, Nilsen P, Bendtsen P. Alcohol assessment and feedback by email for university students: main findings from a randomised controlled trial. Br J Psychiatry. 2013;203(05):334–340.
- Walters ST, Vader AM, Harris TR. A controlled trial of web-based feedback for heavy drinking college students. Prev Sci. 2007;8(1):83–88.
- Carey KB, Scott-Sheldon LAJ, Carey MP, DeMartini KS. Individual-level interventions to reduce college student drinking: a meta-analytic review. Addict Behav. 2007;32(11):2469–2494.
- Bewick BM, Trusler K, Barkham M, Hill AJ, Cahill J, Mulhern B. The effectiveness of web-based interventions designed to decrease alcohol consumption—a systematic review. Prev Med. 2008;47(1):17–26.
- Bhochhibhoya A, Hayes L, Branscum P, Taylor L. The use of the internet for prevention of binge drinking among the college population: a systematic review of evidence. Alcohol Alcohol. 2015;50(5):526–535.
- Carey KB, Scott-Sheldon LAJ, Elliott JC, Bolles JR, Carey MP. Computer delivered interventions to reduce college student drinking: a meta-analysis. Addiction. 2009;104(11):1807–1819.
- Walters ST, Neighbors C. Feedback interventions for college alcohol misuse: what, why and for whom? Addict Behav. 2005;30(6):1168–1182.
- Larimer ME, Cronce JM. Identification, prevention, and treatment revisited: individual focused college drinking prevention strategies 1999–2006. Addict Behav. 2007;32(11):2439–2468.
- Paschall MJ, Antin T, Ringwalt CL, Saltz RF. Effects of AlcoholEDU for college on alcohol-related problems among freshmen: a randomized multi-campus trial. J Stud Alcohol Drugs. 2011;72(4):642–650.
- Paschall MJ, Antin T, Ringwalt CL, Saltz RF. Evaluation of an internet-based alcohol misuse prevention course for college freshmen: findings of a randomized multi-campus trial. Am J Prev Med. 2011;41(3):300–308.
- Scott-Sheldon LAJ, Carey KB, Elliott JC, Garey L, Carey MP. Efficacy of alcohol interventions for first-year college students: a meta-analytic review of randomized controlled trials. J Consult Clin Psychol. 2014;82(2):177–188.
- Wyatt TM, DeJong W, Dixon E. Population-level administration of AlcoholEDU for college: an ARIMA time-series analysis. J Health Commun. 2013;18(8):898–912.
- Abrams GB, Kolligian J, Mills DL, DeJong W. Failure of college students to complete an online alcohol education course as a predictor of high-risk drinking that requires medical attention. Am J Drug Alcohol Abuse. 2011;37(6):515–519.
- Doumas DM, Nelson K, DeYoung A, Renteria CC. Alcohol‐related consequences among first‐year university students: effectiveness of a web‐based personalized feedback program. J Coll Couns. 2014;17(2):150–162.
- Lane DJ, Schmidt JA. Evaluating personalized alcohol interventions. Paper presented at: The 79th Annual Meeting of the Midwestern Psychological Association; May 5, 2007; Chicago, IL.
- Newman IM, Shell DF, Major LJ, Workman TA. Use of policy, education and enforcement to reduce binge drinking among university students: the NU directions model. Int J Drug Policy. 2006;17(4):339–349.
- Miller WR, Rollnick S. Motivational interviewing: preparing people to change. New York: Guilford; 2002.
- Kivlahan DR, Marlatt GA, Fromme K, Coppel DB, Williams E. Secondary prevention with college drinkers: evaluation of an alcohol skills training program. J Consult Clin Psychol. 1990;58(6):805–810.
- White HR, Labouvie EW. Towards the assessment of adolescent problem drinking. J Stud Alcohol. 1989;50(1):30–37.
- Kaplan EL, Meier P. Nonparametric estimation from incomplete observations. J Am Stat Assoc. 1958;53(282):457–481.
- Ross V, DeJong W. Alcohol and other drug abuse among first-year college students. Washington, DC: U.S. Department of Education, Higher Education Center for Alcohol and Other Drug Prevention; 2008.