
Abstract
Background: Seasonal variation in glucose metabolism might be driven by changes in daylight. Melatonin entrains circadian regulation and is directly associated with daylight. The relationship between melatonin receptor 1B gene variants with glycemic traits and type 2 diabetes is well established. We studied if daylight length was associated with glycemic traits and if it modified the relationship between melatonin receptor 1B gene rs10830963 variant and glycemic traits.
Materials: A population-based sample of 3422 18–78-year-old individuals without diabetes underwent an oral glucose tolerance test twice, an average 6.8 years (SD = 0.9) apart and were genotyped for rs10830963. Daylight data was obtained from the Finnish Meteorological Institute.
Results: Cross-sectionally, more daylight was associated with lower fasting glucose, but worse insulin sensitivity and secretion at follow-up. Longitudinally, individuals studied on lighter days at follow-up than at baseline showed higher glucose values during the oral glucose tolerance test and lower Corrected Insulin Response at follow-up. GG genotype carriers in the rs10830963 became more insulin resistant during follow-up if daylight length was shorter at follow-up than at baseline.
Conclusions: Our study shows that individual glycemic profiles may vary according to daylight, MTNR1B genotype and their interaction. Future studies may consider taking daylight length into account.
In Western Finland, the amount daylight follows an extensive annual variation ranging from 4 h 44 min to 20 h 17 min, making it ideal to study the associations between daylight and glycemic traits. Moreover, this allows researchers to explore if the relationship between the melatonin receptor 1B gene rs10830963 variant and glycemic traits is modified by the amount of daylight both cross-sectionally and longitudinally.
This study shows that individuals, who participated in the study on lighter days at the follow-up than at the baseline, displayed to a greater extent worse glycemic profiles across the follow-up.
Novel findings from the current study show that in the longitudinal analyses, each addition of the minor G allele of the melatonin receptor 1B gene rs10830963 was associated with worsening of fasting glucose values and insulin secretion across the 6.8-year follow-up.
Importantly, this study shows that in those with the rs10830963 GG genotype, insulin sensitivity deteriorated the most significantly across the 6.8-year follow-up if the daylight length on the oral glucose tolerance testing date at the follow-up was shorter than at the baseline.
Taken together, the current findings suggest that the amount of daylight may affect glycemic traits, especially fasting glucose and insulin secretion even though the effect size is small. The association can very according to the rs10830963 risk variant. Further research is needed to elucidate the mechanisms behind these associations.
Key messages
Introduction
There is evidence that exposure to daylight and its seasonal variation affect glucose metabolism. Higher exposure to daylight is associated with decreased risk of type 2 diabetes (T2D), [Citation1], and during summer people have been reported to have better glycemic profile, lower fasting glucose and HbA1c as well as lower body mass index (BMI) [Citation2–4]. This has been ascribed to an association between daylight and insulin sensitivity but data showing this association are scarce and previous findings have been inconsistent [Citation5,Citation6]. Environmental light controls the internal timing system or circadian rhythm, which could affect glucose metabolism. This timing is disturbed in night-shift workers who have consistently been shown to be at higher risk of developing T2D [Citation7–10].
Melatonin secretion is influenced by circadian changes of the 24-h night and day cycle with the secretion being inversely related to environmental light [Citation11]. This results in the highest melatonin levels during the night-time, signaling biological night to the body. At the same time, insulin secretion is decreased at night [Citation12], thus following the opposite circadian pattern to melatonin secretion. Furthermore, it has been proposed that insulin secretion rhythm might be modulated by melatonin [Citation13]. In previous studies, melatonin concentrations have been associated with glucose tolerance, insulin secretion, insulin sensitivity as well as with T2D [Citation14–16]. Experimental studies showing impaired glucose tolerance after acute [Citation17] or longer duration [Citation18] melatonin administration lend further support to this view.
Melatonin receptors MTNR1B and MTNR1A are expressed in various tissues such as the brain, especially in the suprachiasmatic nucleus, and retina, but also in pancreatic α- and β-cells [Citation19]. Melatonin Receptor 1B gene (MTNR1B) encodes one of the two high affinity forms of melatonin receptors—MTNR1B. Genome-wide association studies have shown that the minor allele G of the MTNR1B rs10830963 variant is associated with increased fasting glucose levels and both decreased early insulin response and decreased insulin sensitivity resulting in increased risk of T2D [Citation20–24]. On the other hand, treatment with melatonin has been shown to lead to a decrease in insulin secretion but increase in insulin sensitivity [Citation18]. MTNR1B rs10830963 has been proved to be the causal variant on T2D in functional studies [Citation25].
Hence, both daylight exposure and genetic variation in the MTNR1B gene can influence the peripheral effects of melatonin and thus affect glucose metabolism. However, interaction between these factors has received little research attention.
We are aware of only one study investigating whether the effect of circadian regulating loci is season-dependent on glucose metabolism. The GLACIER study reported higher fasting glucose values during the dark season compared with the light season at baseline visit, but this finding was not seen a decade later [Citation26]. Furthermore, they categorized the year into two seasons, dark versus light, and showed that the minor allele G of rs10830963 was associated with lower 2h glucose levels during dark season at baseline visit and during both dark and light seasons at follow-up [Citation26].
Against this background, we examined in a prospective population-based cohort of adults followed up for 6.8 years who reside in Western Finland (Bothnia, Österbotten) with annual daylight time ranging from 4 h 44 min to 20 h 17 min (a) if the amount of daylight on the testing day and MTNR1B rs10830963 variant were associated with glycemic traits in cross-sectional and longitudinal analyses, and (b) if the amount of daylight modified the association of the MTNR1B rs10830963 variant with glycemic traits.
Materials
Study design and participants
The Prevalence, Prediction and Prevention of T2D (PPP-Botnia) study is a population-based study in the Botnia region of Western Finland. The PPP-Botnia study has been described in detail elsewhere [Citation27,Citation28]. In brief, 5,208 (54.7%; 2,443 men and 2,765 women) 18-78 year-old individuals randomly drawn from the Population Registry participated in the baseline study in 2004-2008 (), and 3,850 (73.9%) participated an average 6.8 (SD = 0.9; range 3-13) years later in the follow-up study in 2010–2015.
Table 1. Sample characteristics.
For this study, we included 3,422 individuals with data for the oral glucose tolerance test (OGTT) both at baseline and at follow-up, and genotype data for MTNR1B rs10830963, and who did not have diabetes at baseline. This subgroup did not differ from the whole baseline cohort, except that they had lower 120 min and Area Under the Curve (AUC) for glucose, smoked less often and used more alcohol ().
All participants gave a written informed consent, and the study protocol was approved by the Ethics Committee of the Helsinki University Central Hospital.
Glycemic traits
The subjects participated in an OGTT by ingesting 75 g of glucose after a 10–12-h overnight fast both at baseline and at follow-up. During the OGTT, venous-samples for glucose and insulin were drawn at 0, 30 and 120 min. Plasma fasting glucose (FPG) was measured with a glucose dehydrogenase method (HemoCue, Ängelholm, Sweden) and serum insulin by a fluoroimmunoassay (Delphia; Perkin-Elmer Finland, Turku, Finland).
Homeostatic Model Assessment for Insulin Resistance (HOMA-IR) [Citation29], Insulin Sensitivity Index (ISI) [Citation30] were used as indices of insulin resistance and Corrected Insulin Response (CIR) [Citation31], Disposition Index (DI) [Citation32] as indices of insulin secretion. The following formulas were used to calculate these indices: HOMA-IR = Fasting insulin [mU/l] × fasting glucose [mmol/l]/22.5; ISI = 10000/√ (fasting glucose [mmol/l] × fasting insulin [mU/l]) × (mean OGTT glucose [mmol/l] × mean OGTT insulin [mU/l]); CIR = (100 × insulin [mU/l] at 30 min)/((glucose [mmol/l] at 30 min)×(glucose [mmol/l] at 30 min–3.89 mmol/l)); DI = CIR × ISI. AUC for Insulin and Glucose were calculated as follows: AUC insulin = 15× fasting insulin [mU/l] + 15 × insulin [mU/l] at 30 min +45× insulin [mU/l] at 30 min +45× insulin [mU/l] at 120 min; AUC glucose = 15× fasting glucose +15× glucose [mmol/l] at 30 min +45× glucose [mmol/l] at 30 min +45× glucose [mmol/l] at 120 min.
Daylight
Daylight information was provided by the Finnish Meteorological Institute (FMI) Climate Service for Seinäjoki Pelmaa, which is the closest meteorological station to the PPP-Botnia study centers in Närpiö, Maalahti, Mustasaari, Vaasa and Pietarsaari. The average distance between Seinäjoki Pelmaa and the study centers is about 71 km (53 km to Vaasa and 97 km to Pietarsaari. Daylight (day length in hours) from the meteorological station was linked to the baseline and follow-up study dates. The mean daylight time at the baseline visit was 11.00 (SD = 4.51; range 4.73–20.28 hours) and at the 6.8-year follow-up 11.79 (SD = 4.56; range 4.73-20.28 hours) hours.
Genotyping of MTNR1B rs10830963
Genotyping of MTNR1B rs10830963 was performed either by mass spectrometry on the MassARRAY platform or by allelic discrimination method with a TaqMan assay on the ABI7900 platform with a genotyping success rate of >95%, as described in detail elsewhere [Citation21]. In the analytic sample, the minor allele frequency was 0.30 and there was no deviation from the Hardy–Weinberg equilibrium (p = .70).
Covariates
In cross-sectional analysis covariates were sex, age (years) and BMI (BMI; kg/m2) as calculated from measured weight (kg) and height (m), self-reported educational attainment (basic or less or missing; upper secondary school; lower tertiary school; upper tertiary school), reported current smoking status (yes versus no or former), alcohol consumption (doses/week; 1 dose = 12 g of pure alcohol), and physical activity (yes if over 30 min of physical activity was performed three or more times per week versus no if they performed less or no activity). Additionally, insomnia symptoms were treated as a covariate, and in further sensitivity analyses participants who reported a physician-diagnosed sleep apnea (n = 195) were excluded.
The longitudinal analyses were adjusted for baseline glycemic trait values, sex, age, BMI and change from baseline to follow-up in age, BMI and additionally for smoking, alcohol consumption and physical activity at both visits. Of note, we did not have educational attainment, insomnia and sleep apnea measurements at follow-up. Hence, the follow-up cross-sectional and longitudinal analyses used the baseline values of these variables as covariates.
Statistical analysis
IBM SPSS version 23.0 was used for data analysis (www.ibm.com/spss/). We used multiple linear regressions to test if daylight and rs10830963 (assuming additive genetic model in all analyses) were associated with glycemic traits cross-sectionally both at baseline and at follow-up. To test if daylight moderated the association of rs10830963 and glycemic traits, we added an interaction term daylight × rs10830963 into the linear regression model following the main effects of these variables.
We also used multiple linear regression analyses to study if change in the amount of daylight available at the dates of baseline and follow-up testing (amount of daylight at the date of baseline testing was subtracted from the respective of the follow-up testing), rs10830963 (assuming additive genetic model), or their interaction, were associated with change in glycemic traits between baseline and follow-up (baseline glycemic trait value was subtracted from the respective follow-up value). The analyses of change were adjusted for the baseline value of the outcome variable. However, we conducted these analyses also without adjusting for the baseline value. Skewed variables were log-transformed where appropriate, and daylight, daylight change, glycemic traits, and glycemic trait change variables were standardized to the mean of 0 and SD of 1 to facilitate interpretation.
The alpha level of 0.05 was set to define statistical significance.
Results
Characteristics of the study cohort are presented in . Overall, during the mean follow-up of 6.8 (SD = 0.9) years the participants’ mean BMI increased and they exercised less, their mean glucose and insulin concentrations increased, and their insulin sensitivity (HOMA-IR and ISI) and insulin secretion (CIR and DI) deteriorated. On the other hand, they smoked less and used less alcohol. Overall, the follow-up visits were conducted on dates with more daylight compared to the baseline (mean difference 52 min, SD = 6.5).
Cross-sectional analyses
Daylight and glycemic traits at the baseline and at the follow-up
The average amount of daylight was 11.0 h (SD = 4.4) at the baseline and 11.8 h (SD = 4.6) at the follow-up visit. At the follow-up, the amount of daylight was inversely related to FPG (). However, it was positively related to glucose AUC during OGTT, fasting insulin and HOMA-IR and inversely to ISI suggesting deterioration of insulin sensitivity. Furthermore, it was inversely related to the measures of insulin secretion, DI and CIR. Except for fasting glucose levels, similar effects were seen at baseline but these were not statistically significant. The analyses were adjusted for sex, age, BMI, baseline education and lifestyle factors. Taken together, in the cross-sectional analysis more daylight was associated with better FPG, but worse insulin sensitivity and insulin secretion resulting in a higher glucose response during OGTT ().
Table 2. Associations between amount of daylight and glycemic traits.
MTNR1B rs10830963 and glycemic traits at the baseline and at the follow-up
Addition of each G allele of the rs10830963 was associated with higher FPG and glucose AUC and with lower DI and CIR at baseline and at follow-up (). In addition, at baseline, each G allele of the rs10830963 was nominally positively associated with HOMA-IR and inversely with ISI, but these associations were not significant after further adjustments for education and lifestyle factors and could not be seen at the follow-up visit.
Table 3. Associations between MTNR1B rs10830963 genotype and glycemic traits (additive model).
Interactions between daylight and rs10830963 in the analyses of glycemic traits
The SNP rs10830963 did not significantly interact with daylight neither at baseline nor at follow-up in the analyses of glycemic traits using either an additive genetic model (Supplementary Table 1) or dominant genetic model (Supplementary Table 2) in the interaction analyses.
Longitudinal analyses
Associations between the change in daylight and change in glycemic traits between the baseline and the follow-up
Those who underwent OGTT on days with more daylight available at the follow-up than at the baseline, showed higher increase in AUC for glucose and decrease in CIR (). Besides this, there were no other significant associations between the change in daylight and change in fasting state values and glycemic traits between the visits.
MTNR1B rs10830963 and change in glycemic traits between the baseline and the follow-up
Longitudinally, each G allele was associated with an increase in FPG and with a decrease in DI and CIR between baseline and follow-up but not with changes in HOMA-IR or ISI (). In addition, each G allele was associated with decrease in insulin AUC, but this association did not remain significant after further adjusting for educational attainment and lifestyle factors.
Interactions between the change in daylight and rs10830963 and change in glycemic traits between the baseline and the follow-up
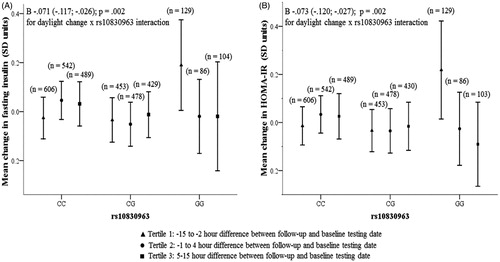
shows that the interaction of rs10830963 and change in daylight between the visits had a significant effect on the change between baseline and follow-up in fasting insulin and HOMA-IR values. To illustrate these interactions, we stratified the participants into tertiles according to change in daylight between baseline and follow-up: tertile 1—less daylight at follow-up than at the baseline (−15 h to −2 h difference), tertile 2—no or small difference in daylight between the testing days (−1 h to 4 h difference), and tertile 3—more daylight at follow-up than at baseline (5–15 h difference). In carriers of CC or CG genotypes, change in fasting insulin and HOMA-IR was independent of changes in daylight () whereas homozygous GG carriers became more insulin resistant (higher fasting insulin and HOMA-IR) at the follow-up if the daylight length got shorter. The interactions on change in fasting insulin and HOMA-IR did not change, if the data were not adjusted for baseline values, and they remained significant also in models adjusted for insomnia and participants with physician-diagnosed sleep apnea were excluded from the analyses (data not shown).
Figure 1. Change between follow-up and baseline visits in fasting insulin (panel A), HOMA-IR (panel B) according to the daylight and the MTRN1B rs10830963 genotype.
Furthermore, all the previously reported associations remained unchanged across both cross-sectional and longitudinal analyses when we made further adjustments for insomnia, and when we excluded participants who reported having a physician-diagnosed sleep apnea from the analyses (data not shown).
Discussion
The main findings of our study, conducted in a large, prospective population-based sample of individuals residing in Western Finland, are the following. First, our cross-sectional findings showed that individuals who were tested during the lighter days of the year, had lower FPG but worse insulin and glucose response to OGTT (higher glucose AUC, lower DI and CIR; higher HOMA-IR, lower ISI in fully adjusted models). Second, our findings replicate previous findings showing that each risk G allele of the MTNR1B rs10830963 was associated with higher FPG and reduced insulin secretion during OGTT (higher glucose AUC, lower DI and CIR). Thus, our results indicate the deleterious effect of MTNR1B rs10830963 risk allele G on insulin secretion that affects glucose tolerance.
We also analyzed the glycemic response in relation to the amount of daylight on two separate OGTT’s in the same individuals approximately 6 years apart. In between the visits, the overall insulin sensitivity and secretion deteriorated, which we took into account by adjusting for baseline values and changes in the covariates between the visits. Similar to the cross-sectional analysis, the longitudinal analyses showed that individuals who got tested on lighter days at the follow-up than at baseline showed worsening of glucose response to OGTT (higher AUC glucose) and insulin secretion (lower CIR) across the follow-up. The fasting glucose and insulin secretory response to glucose (DI) were also somewhat lower, but this was not statistically significant. Also longitudinally, each MTNR1B rs10830963 G allele was additively associated with worsening of insulin and glucose response to OGTT across the follow-up (higher FPG, lower DI and CIR). These findings were independent of sex, age, BMI, education and lifestyle and remained unchanged when adjusted for self-reported insomnia and when participants with physician-diagnosed sleep apnea were excluded.
Our finding that a higher amount of daylight is associated with lower FPG is in line with results from the GLACIER cohort from the Västerbotten region in Sweden which resides in a similar latitude to the PPP-Botnia region—Umeå and Vaasa being only 140 km apart. The GLACIER study showed that FPG values were lower during the spring/summer seasons compared with fall/winter seasons [Citation26]. Some other studies have also reported that FPG values are lower and impaired fasting glucose is less prevalent during summer than during winter season [Citation2,Citation33,Citation34]. However, there have been studies which have shown no seasonal differences in FPG [Citation5].
Our results and those reported previously [Citation5,Citation6] were less clear regarding insulin sensitivity. In our cross-sectional analysis at follow-up, individuals who were tested during the lighter days of the year were less insulin sensitive (higher fasting insulin levels and higher HOMA-IR, lower ISI), but when individual changes in insulin sensitivity were analyzed according to the change in daylight, no effect was found in the longitudinal analysis. Also previous studies have been divided and reports include both increased and decreased insulin sensitivity in summer compared with winter [Citation5,Citation6,Citation35]. Furthermore, in our study, the risk genotype GG of MTNR1B rs10830963 was not associated with insulin sensitivity either cross-sectionally or longitudinally.
In our study, the lower FPG on lighter days was accompanied with worse insulin and glucose response to OGTT (higher glucose AUC, lower DI and CIR), which is in contrast to earlier studies, including the GLACIER, reporting no seasonal differences in 2 h glucose levels during an OGTT [Citation5,Citation26]. However, further studies using more detailed measures on the daylight exposure (such as self-reported recreational exposure to daylight—sunbathing), which the amount of daylight or season do not directly capture, are needed.
In addition to the main effects of daylight and the MTNR1B rs10830963 genotype, our study showed in longitudinal analyses that their interaction was associated with glycemic profiles. Interestingly, this interaction showed that rs10830963 GG carriers became more insulin resistant if the OGTT was carried out on days with less daylight available in follow-up than at baseline. This is in contrast with findings from the GLACIER study which showed the lowest 2 h glucose concentrations during the dark season in individuals with the GG genotype [Citation26]. However, this interaction finding was not replicated in the GLACIER study follow-up conducted a decade later [Citation26].
Both biological and behavioral factors may influence these associations. Lower melatonin secretion has been independently associated with a higher risk of developing T2D [Citation16], whereas controversial effects (both inhibitory and stimulatory) have been reported on insulin secretion [Citation36,Citation37]. This explanation may, however, not hold true for MTNR1B rs10830963 GG genotype carriers. They have been shown to be more sensitive to melatonin and exhibit greater melatonin signaling in pancreatic islet cells [Citation18]. Hence, higher melatonin production during darker days may make the GG genotype carriers of the rs10830963 more prone to glucose intolerance.
It is also possible that one must have an underlying susceptibility to disturbances in glucose metabolism before the potential effect of melatonin on glycemic traits can be detected. For example, in a study in rats, it was found that only those at risk of T2D (diabetes-prone human islet amyloid polypeptide transgenic rats), but not wild-type rats, had disruptions in circadian rhythm followed by an experimental dark-light cycle disruption [Citation38].
Seasonal effects in glycemic traits could potentially arise from other factors in addition to the amount of daylight such as the changes in temperature that could have an effect on caloric intake and physical activity [Citation3]. Additionally, the feeding-fasting cycle could play a critical role in the circadian rhythm of metabolic processes as the dominant environmental cue [Citation39]. For example shift workers, who are exposed to light at night, have been consistently shown to have worse metabolic profiles, higher BMI and are at increased risk of T2D [Citation7,Citation8,Citation40]. Moreover, seasonal variation in diet along with caloric intake, as well as exercise may have an effect.
A strength of our study is its population-based longitudinal design, and data on the amount of daylight available both at baseline and follow-up derived from a meteorological station near PPP-Botnia study centers, and the large variation in the amount of daylight available at these latitudes. Our study also provides state-of-the-art measures on glycemic traits.
A limitation in our study is that we did not measure melatonin concentrations. However, a single point fasting melatonin value as a measure of its circadian exposure might be misleading on the variation in glucose metabolism. While seasonal concentrations of melatonin should be explored further, glucose metabolism is not only dependent on melatonin concentration but also on response to melatonin. A recent study has shown that in MTNR1B risk variant carriers, the duration of melatonin production is prolonged into the morning; risk variant carriers have later melatonin offset and a longer duration of elevated melatonin levels [Citation41]. In a subset of the PPP-Botnia study, however, there was no difference between the morning melatonin concentrations between carriers of the different rs10830963 genotypes [Citation18].
Another limitation is that we do not have data on shift work, but shift work is rare in the study region and none of the participants had worked during the two nights preceding the OGTT. Data on sleep duration was available in only a subset of the cohort [Citation42] but we were able to account for self-reported insomnia and exclude individuals who reported a physician diagnosis of sleep apnea which did not change our findings. Nevertheless, future studies are needed to determine the role of sleep on these associations. There was also a lack of data on educational attainment at the follow-up, but that is not likely to change the results as the baseline information was available and used as a covariate in the analyses. Finally, our sample comprised white Caucasians and can therefore not be generalized to other ethnic populations. We propose that further research should be designed so that there is a shorter time period between testing dates than in our study, using data from consecutive seasons when the effect of daylight on glycemic traits can be estimated more accurately.
Taken together, our findings suggest that future studies on glycemic traits may consider taking into account the length of daylight exposure on the testing day, even though the effect of daylight on glycemic traits is small in effect size.
Supplemental Material
Download MS Word (25.4 KB)Acknowledgements
We would like to thank all of the participants in the study as well as the Botnia Study Group.
Disclosure statement
The authors report no biomedical financial interests or potential conflicts of interest.
Additional information
Funding
References
- Shore-Lorenti C, Brennan SL, Sanders KM, et al. Shining the light on sunshine: a systematic review of the influence of sun exposure on type 2 diabetes mellitus-related outcomes. Clin Endocrinol (Oxf). 2014;81:799–811.
- Mavri A, Guzic-Salobir B, Salobir PB, et al. Seasonal variation of some metabolic and haemostatic risk factors in subjects with and without coronary artery disease. Blood Coagul Fibrinolysis. 2001;12:359–365.
- Ishii H, Suzuki H, Baba T, et al. Seasonal variation of glycemic control in type 2 diabetic patients. Diab Care. 2001;24:1503.
- Tseng C-L, Brimacombe M, Xie M, et al. Seasonal patterns in monthly hemoglobin A1c values. Am J Epidemiol. 2005;161:565–574.
- Berglund L, Berne C, Svärdsudd K, et al. Seasonal variations of insulin sensitivity from a euglycemic insulin clamp in elderly men. Ups J Med Sci. 2012;117:35–40.
- Chen S-H, Chuang S-Y, Lin K-C, et al. Community-based study on summer-winter difference in insulin resistance in Kin-Chen, Kinmen, Taiwan. J Chinese Med Assoc. 2008;71:619–627.
- Dumont M, Benhaberou-Brun D, Paquet J. Profile of 24-h light exposure and circadian phase of melatonin secretion in night workers. J Biol Rhythms. 2001;16:502–511.
- Pan A, Schernhammer ES, Sun Q, et al. Rotating night shift work and risk of type 2 diabetes: two prospective cohort studies in women. Plos Med. 2011;8:e1001141.
- Gan Y, Yang C, Tong X, et al. Shift work and diabetes mellitus: a meta-analysis of observational studies. Occup Environ Med. 2015;72:72–78.
- Vetter C, Dashti HS, Lane JM, et al. Night shift work, genetic risk, and type 2 diabetes in the UK Biobank. Diabetes Care. 2018;41:762–769.
- Waldhauser F, Dietzel M. Daily and annual rhythms in human melatonin secretion: role in puberty control. Ann N Y Acad Sci. 1985;453:205–214.
- Haus E. Chronobiology in the endocrine system. Adv Drug Deliv Rev. 2007;59:985–1014.
- Mulder H, Nagorny CLF, Lyssenko V, et al. Melatonin receptors in pancreatic islets: good morning to a novel type 2 diabetes gene. Diabetologia. 2009;52:1240–1249.
- McMullan CJ, Curhan GC, Schernhammer ES, et al. Association of nocturnal melatonin secretion with insulin resistance in nondiabetic young women. Am J Epidemiol. 2013;178:231–238.
- Peschke E. Melatonin, endocrine pancreas and diabetes. J Pineal Res. 2008;44:26–40.
- McMullan CJ, Schernhammer ES, Rimm EB, et al. Melatonin secretion and the incidence of type 2 diabetes. JAMA. 2013;309:1388–1396.
- Rubio-Sastre P, Scheer FAJL, Gómez-Abellán P, et al. Acute melatonin administration in humans impairs glucose tolerance in both the morning and evening. Sleep. 2014;37:1715–1719.
- Tuomi T, Nagorny CLFLF, Singh P, et al. Increased melatonin signaling is a risk factor for type 2 diabetes. Cell Metab. 2016;23:1067–1077.
- Hardeland R. Melatonin in aging and disease -multiple consequences of reduced secretion, options and limits of treatment. Aging Dis. 2012;3:194–225.
- Prokopenko I, Langenberg C, Florez JC, et al. Variants in MTNR1B influence fasting glucose levels. Nat Genet. 2009;41:77–81.
- Jonsson A, Ladenvall C, Ahluwalia TS, et al. Effects of common genetic variants associated with type 2 diabetes and glycemic traits on α- and β-cell function and insulin action in humans. Diabetes. 2013;62:2978–2983.
- Lyssenko V, Nagorny CL, Erdos MR, et al. Common variant in MTNR1B associated with increased risk of type 2 diabetes and impaired early insulin secretion. Nat Genet. 2009;41:82–88.
- Langenberg C, Pascoe L, Mari A, et al. Common genetic variation in the melatonin receptor 1B gene (MTNR1B) is associated with decreased early-phase insulin response. Diabetologia. 2009;52:1537–1542.
- Sparso T, Bonnefond A, Andersson E, et al. G-allele of intronic rs10830963 in MTNR1B confers increased risk of impaired fasting glycemia and type 2 diabetes through an impaired glucose-stimulated insulin release: studies involving 19,605 Europeans. Diabetes. 2009;58:1450–1456.
- Gaulton KJ, Ferreira T, Lee Y, et al. Genetic fine mapping and genomic annotation defines causal mechanisms at type 2 diabetes susceptibility loci. Nat Genet. 2015;47:1415–1425.
- Renström F, Koivula RW, Varga TV, et al. Season-dependent associations of circadian rhythm-regulating loci (CRY1, CRY2 and MTNR1B) and glucose homeostasis: the GLACIER Study. Diabetologia. 2015;58:997–1005.
- Isomaa B, Forsen B, Lahti K, et al. A family history of diabetes is associated with reduced physical fitness in the Prevalence, Prediction and Prevention of Diabetes (PPP)-Botnia study. Diabetologia. 2010;53:1709–1713.
- Di Camillo B, Hakaste L, Sambo F, et al. HAPT2D: high accuracy of prediction of T2D with a model combining basic and advanced data depending on availability. Eur J Endocrinol. 2018;178:331–341.
- Matthews DR, Hosker JP, Rudenski AS, et al. Homeostasis model assessment: insulin resistance and beta-cell function from fasting plasma glucose and insulin concentrations in man. Diabetologia. 1985;28:412–419.
- Bergman RN, Prager R, Volund A, et al. Equivalence of the insulin sensitivity index in man derived by the minimal model method and the euglycemic glucose clamp. J Clin Invest. 1987;79:790–800.
- Hanson RL, Pratley RE, Bogardus C, et al. Evaluation of simple indices of insulin sensitivity and insulin secretion for use in epidemiologic studies. Am J Epidemiol. 2000;151:190–198.
- Bergman RN, Ader M, Huecking K, et al. Accurate assessment of beta-cell function: the hyperbolic correction. Diabetes. 2002;51(1):S212–S220.
- Chen S-H, Jen I-A, Chuang S-Y, et al. Community-based study on summer-winter differences of component of metabolic syndrome in Kinmen, Taiwan. Prev Med. 2006;43:129–135.
- Suarez L, Barrett-Connor E. Seasonal variation in fasting plasma glucose levels in man. Diabetologia. 1982;22:250–253.
- Isken F, Abraham U, Weickert M, et al. Annual change in insulin sensitivity. Horm Metab Res. 2011;43:720–722.
- Kemp DM, Ubeda M, Habener JF. Identification and functional characterization of melatonin Mel 1a receptors in pancreatic beta cells: potential role in incretin-mediated cell function by sensitization of cAMP signaling. Mol Cell Endocrinol. 2002;191:157–166.
- Peschke E, Bach AG, Muhlbauer E. Parallel signaling pathways of melatonin in the pancreatic beta-cell. J Pineal Res. 2006;40:184–191.
- Gale JE, Cox HI, Qian J, et al. Disruption of circadian rhythms accelerates development of diabetes through pancreatic beta-cell loss and dysfunction. J Biol Rhythms. 2011;26:423–433.
- Dibner C, Schibler U. Circadian timing of metabolism in animal models and humans. J Intern Med. 2015;277:513–527.
- Morikawa Y, Nakagawa H, Miura K, et al. Shift work and the risk of diabetes mellitus among Japanese male factory workers. Scand J Work Environ Health. 2005;31:179–183.
- Lane JM, Chang A-M, Bjonnes AC, et al. Impact of common diabetes risk variant in MTNR1B on sleep, circadian, and melatonin physiology. Diabetes. 2016;65:1741–1751.
- Pyykkonen AJ, Isomaa B, Pesonen AK, et al. Sleep duration and insulin resistance in individuals without type 2 diabetes: the PPP-Botnia study. Ann Med. 2014;46:324–329.