
 ?Mathematical formulae have been encoded as MathML and are displayed in this HTML version using MathJax in order to improve their display. Uncheck the box to turn MathJax off. This feature requires Javascript. Click on a formula to zoom.
Abstract
Background
Hypoxemia often occurs in outpatients undergoing anesthesia-assisted esophagogastroduodenoscopy (EGD). However, there is a scarcity in tools to predict the hypoxemia risk. We aimed to solve this problem by developing and validating machine learning (ML) models based on preoperative and intraoperative features.
Methods
All data were retrospectively collected from June 2021 to February 2022. The most appropriate predictive features were selected by the least absolute shrinkage and selection operator, which were incorporated and modelled by 4 ML algorithms. The area under the precision-recall curve (AUPRC) was used as the main evaluation metric to select the best models, and the selected models were compared with the STOP-BANG score. Their predictive performance was visually interpreted by SHapley Additive exPlanations. The primary endpoint of this study was hypoxemia during the procedure, defined as at least one reading of pulse oximetry < 90% without probes misplacement from the anesthesia induction beginning to the end of EGD, while the secondary endpoint was hypoxemia during induction, from the induction beginning to the start of endoscopic intubation.
Results
Of 1160 patients in the derivation cohort, 112 patients (9.6%) developed intraoperative hypoxemia, of which 102 (8.8%) occurred during the induction period. In temporal and external validation, no matter whether based on preoperative variables or still based on preoperative plus intraoperative variables, our models showed excellent predictive performance for the two endpoints, significantly better than STOP-BANG score. In the model interpretation section, preoperative variables (airway assessment indicators, pulse oximeter oxygen saturation and BMI) and intraoperative variables (the induced propofol dose) made the highest contribution to the predictions.
Conclusions
To our knowledge, our ML models were the first to predict hypoxemia risk, which achieved excellent overall predictive ability integrating various clinical indicators. These models have the potential to become an effective tool for adjusting sedation strategies flexibly and reducing the workload of anesthesiologists.
This study is the first model employing ML methods based on preoperative and preoperative plus intraoperative variables for predicting the risk of hypoxemia during induction and the whole EGD procedure respectively.
Our four models achieved satisfactory predictive performance and outperformed STOP-BANG score in terms of AUPRC in the temporal and external validation cohorts respectively.
We found that the relevant variables of airway assessment should be fully taken into account when analyzing the risk factor of hypoxemia, and the effect of patients’ age on their hypoxemia risk should be considered in conjunction with the propofol dose.
KEY MESSAGES
Introduction
Drug sedation in esophagogastroduodenoscopy (EGD) could effectively improve the comfort of patients and the detection rate of digestive diseases [Citation1,Citation2]. However, it was often accompanied by potential intraoperative hypoxemia, with an incidence of about 10–70% [Citation3,Citation4], of which about one-third occur during anesthesia induction [Citation5]. Hypoxemia may further lead to cardio-pulmonary complications, such as apnea, hypotension, and myocardial ischemia [Citation6,Citation7]. In this case, predicting patients’ hypoxemia risk may assist anesthesiologists in protecting those who benefit more from preventive measurements and defend them from serious complications.
At present, there are no prediction models that focus on this field. Previous efforts have been made to identify risk factors of hypoxemia, such as body mass index (BMI) [Citation8,Citation9], obstructive sleep apnea (OSA) [Citation10], and some pre-existing diseases [Citation8]. In addition, some studies have tried to explore the performance of the STOP-BANG score in predicting hypoxemia [Citation11,Citation12]. The results show that its performance may be controversial. In fact, clinical pre-anesthetic assessment usually requires the combination of multiple indicators according to recent guidelines, including vital signs, airway assessment, and so on [Citation2]. It would put a great burden on anesthesiologists, especially under the rapid outpatient procedures. At the same time, incorporating intraoperative variables in the predictive model may bring new perspectives to anesthesiologists. Therefore, analyzing preoperative and intraoperative variables and integrating multiple indicators is important to establish a predictive model and simplify clinical work.
Machine learning (ML) has entered our eyesight for its advantage of handling large amounts of data and mining potential information from it. Furthermore, it provides the feasibility to explore the complex correlation between variables, which could be beneficial to better the prediction ability based on traditional statistical methods. In some fields, the predictive performance of machine learning models in clinical outcomes has been recognized [Citation13,Citation14]. Simultaneously, with the popularization of electronic patient record (EPR) systems and clinical equipment’s progress, the timely clinical implementation of computer algorithms has gradually become a reality.
In this study, we tried to establish ML models for dynamic predicting the occurrence of hypoxemia at different time points based on preoperative and preoperative plus intraoperative variables. Furthermore, our models were validated in the temporal validation and external validation dataset, and compared the performance to the STOP-BANG score.
Method
The Nanjing First Hospital ethics committee approved this study and waived the requirement for informed consent [grant number: KY20220509-01-KS-01]. Outpatients’ data of the derivation cohort from June to September 2021 were collected retrospectively from electronic medical records. Patients who received routine anaesthesia-assisted EGD were included according to the following criteria: ≥18 years old; American Society of Anesthesiologists (ASA) class I–III. Exclusion criteria were as follows: pregnancy, severe cardiopulmonary diseases (uncontrolled circulatory and respiratory diseases that can be life-threatening, including severe aortic stenosis, unstable angina pectoris, acute exacerbations of chronic obstructive pulmonary disease, etc.), presence of acute upper respiratory tract infection, and unavailability of complete data. Patients who were induced with etomidate were also excluded.
Procedures
The anesthesia evaluation clinic evaluated all patients before EGD. For patients with a higher risk of hypoxemia estimated by anesthesiologists empirically, preventive measures, including nasopharyngeal airway and high flow oxygen, were applied and would be sedated based on a bispectral index. Throughout the EGD procedure, patients remained in a lateral position. All patients received a 3 L/min oxygen supplement via nasal cannula for 3 min, and underwent monitoring of pulse oximeter oxygen saturation (SpO2), electrocardiogram and blood pressure during the operation. Anesthesiologists implemented anesthesia induction with propofol. The anesthesiologist assessed the depth of sedation according to the modified observer’s assessment of alertness/sedation scale (MOAA/S). Endoscopic intubation was allowed once the MOAA/S was < 2. Propofol combined with remifentanil was used to maintain a stable sedation depth of MOAA/S < 2 during the procedure. After the operation, patients were transferred to the post-anesthesia care unit when their MOAA/S score was ≥ 4 points. Protective actions during the EGD procedure were performed as follows: increasing the oxygen flow from 3 to 6 L/min once subclinical respiratory depression (90% ≤ SpO2 < 95%) occurred; increasing the oxygen flow from 3 to 6 L/min meanwhile opening the airway by the jaw-thrust manoeuvre once hypoxia (75% ≤ SpO2 < 90% for < 60 s) occurred; performing mask ventilation once severe hypoxia (SpO2 < 75% or 75% ≤ SpO2 < 90% for ≥ 60 s) occurred and implementing tracheal intubation if hypoxia still could not be corrected.
Data collection
Patients’ clinical data were collected: age; gender; BMI; drinking; ASA class; STOP-BANG score [Citation15]; pre-existing diseases, such as hypertension, diabetes, chronic obstructive pulmonary disease (COPD), and gastrointestinal surgery; hemoglobin and baseline SpO2. Patients with STOP-BANG scores ≥ 3 were defined as at high risk of hypoxemia. Besides, a total airway assessment, including neck circumference, thyromental distance (TMD), thyromental height (TMH), sternomental distance (SMD), inter-incisor distance, modified Mallampati class, etc., was performed by the anesthesiologists before the EGD procedure. Smoking was separated into never, current and quit (never smoking or previously smoked regularly and quit at least one year before admission). Preoperative electrocardiogram was recorded as normal, bradycardia, premature beat, atrial fibrillation, heart block, ST-T change and others. At least two anesthesiologists collected all data in charge of the patients.
Endpoints
The primary endpoint of this study was hypoxemia during the procedure, that is, from the anesthesia induction beginning to the end of EGD. The secondary endpoint was hypoxemia during induction, from the induction beginning to the start of endoscopic intubation. Hypoxemia was defined as at least one reading of pulse oximetry <90% without probes misplacement [Citation3,Citation9–11].
Statistical analysis
Statistical analysis was used for comparing the differences in baseline characteristics between patients with hypoxemia and non-hypoxemia in the induction and operation period. All continuous variables were first checked for normality of distribution using Shapiro–Wilk test. Continuous variables were expressed as mean (standard deviation) or median (interquartile range), while the categorical variables were expressed as numbers (percentages). Continuous variables were analyzed with Student t-test or Mann–Whitney U-test, and the categorical variables were analyzed with Chi-squared test or Fisher’s exact test. A P-value of < 0.05 (2-sided) was deemed statistically significant. The statistical analysis was performed using SPSS 24.0 software (IBM, Armonk, NY, USA).
Datasets pre-processing
The derivation cohort was randomly divided into training and internal testing cohorts in the ratio of 8:2, and the proportion of patients with hypoxemia in the induction and operation period was similar in each cohort. The training cohort was used for feature selection, model training, and parameter tuning, while the internal testing cohort was only used to evaluate the generalization ability of the model. Before being incorporated into the algorithm, all continuous variables were normalized using Z-Score normalization [Citation16] and multiple categorical variables were transformed by One-Hot encoding [Citation17].
Feature selection
In order to boost the robustness of the prediction model, the least absolute shrinkage and selection operator (LASSO) [Citation18] was used to extract optimal features from collected data. With the adjustment of hyperparameters lambda (λ), LASSO can shrink all regression coefficients towards zero and exclude many uncorrelated features by making their coefficients exactly to become zero. The goal of LASSO hyperparametric optimization is to minimize its cost function, which can be expressed as:
where the X represents a matrix of variables entering LASSO; y represents a vector of sample labels; n represents the number of samples; ω represents a coefficient vector of the LASSO regression model; λ ǁ ω ǁ1 represents the Lasso penalty with the constant λ and the L1-norm of the coefficient vector ǁ ω ǁ1. LASSO was executed four times. To early assess the risk of hypoxemia in patients in induction and throughout the operation period, only preoperative variables were included in the LASSO regression. To assess the potential correlation of variables with induction and intraoperative hypoxemia, all variables that could be obtained in the induction and operation period were included in the LASSO regression. The hyperparameter was selected from 500 numbers with values between 10−3 and 100. Based on 10-fold cross-validation, the number that minimizes the objective function was selected as the optimal hyperparameter, and this step was repeated 50 times for each LASSO to avoid the error caused by 10-fold cross-validation performed only once. All variables with non-zero coefficients after LASSO were incorporated into the prediction model. The LASSO was performed with the open-source Python 3.8 (https://www.python.org/) based on the python package Scikit-learn 0.23.2 (https://scikit-learn.org/stable/).
Training
Totally four types of models were trained using the cohort, which includes: (1) Early prediction model of intraoperative hypoxemia (Type A); (2) Late prediction model of intraoperative hypoxemia (Type B); (3) Early prediction model of induction period hypoxemia (Type C); and (4) Late prediction model of induction period hypoxemia (Type D). The two early prediction models only incorporated selected preoperative variables, while the two late prediction models incorporated selected preoperative plus intraoperative variables. Four well-accepted ML algorithms were used to build each type of prediction model, which include logistic regression (LR), random forest (RF), support vector machine (SVM), and extreme gradient boosting (XGBoost). To compensate for the potential impact of imbalanced data on model training, a cost-sensitive learning method was used to reduce the misclassification of high-risk patients with hypoxemia. The optimization of hyperparameters for each model was realized by the grid search algorithm and 10-fold cross-validation. Probability calibration was performed on all models. ML models were conducted using python package Scikit-learn 0.23.2, Xgboost 1.3.3 (https://github.com/dmlc/xgboost).
Validation
An internal testing cohort was used for internal validation to assess the generalization capability of the models initially, and the best model was selected from the results. The additional collected independent data of patients undergoing EGD in December 2021 at Nanjing First Hospital was used for temporal validation to further validate the generalizability of the selected models. Finally, another independent dataset collected at the Fourth Affiliated Hospital of Nanjing Medical University in February 2022 was used for external validation for the final assessment of the generalizability of the best model. All three datasets mentioned above were only used for the generalization evaluation of models, not for the training and parameter adjustment process.
Evaluation metrics
The performance of models was mainly assessed by the area under the precision-recall curve (AUPRC), while the area under the receiver operating characteristic curve (AUROC) was also calculated. Although the area under ROC is a common metric for evaluating the performance of binary classification models, the PRC space can reflect more detailed information on imbalanced data [Citation19], so the AUPRC may be more suitable as a primary evaluation metric for this study. In addition, the sensitivity, specificity, accuracy, F1 score and Matthews correlation coefficient (MCC) of each model were calculated under the optimal threshold determined by Youden’s index on the ROC (the relevant definitions can be found in Supplemental Materials). To evaluate the predictive performance of the STOP-BANG score and compare it with our models, we also calculated its AUPRC for the prediction of hypoxemia in intraoperative and induction. The Brier score was used to evaluate the calibration of each model. The bootstrap method (3000 iterations) was used for comparing the differences between the area under PRCs (performed with Medcalc software 20), while the Delong test was used for that between the area under ROCs [Citation20], and the Z-test was used for sensitivity, specificity, and accuracy. Finally, the model with the best performance among the four models in the internal testing cohort was selected for further analysis in model interpretation.
Interpretation
The SHapley Additive exPlanations (SHAP) method [Citation21] was used for visualizing the reasons behind model prediction to understand and validate its mechanism of risk prediction. SHAP method calculates the SHAP value based on the coalition game theory to evaluate the marginal contribution of each variable toward the final risk prediction of an individual. We rank the importance of prediction variables according to the average SHAP value of each variable in the training cohort to provide a global explanation for the prediction behavior of the model. Furthermore, three cases in the internal testing cohort were also randomly selected to show how the model produces each prediction. The SHAP method was performed using SHAP 0.39.0 library (http://github.com/slundberg/shap).
Result
Patient characteristics
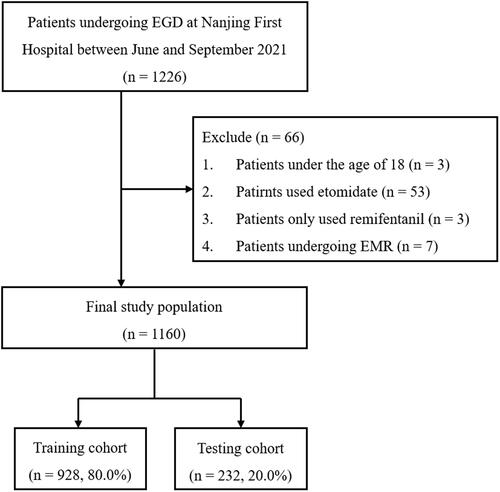
A total of 1226 patients were collected into the derivation cohort, and 1160 patients were finally included. The inclusion-exclusion flow chart is shown in . Among the included patients, 112 patients (9.6%) developed intraoperative hypoxemia, of which 102 (8.8%) had hypoxemia during the induction period. Other information about patient characteristics in this cohort is presented in Table S1, and the characteristic information about the patient from temporal and external validation cohorts can be found in Supplemental Materials.
Figure 1. Flow chart of patient inclusion and exclusion.
Features
We identified the final variables included in the four types of models by LASSO. (1) The model of Type A incorporated nine variables, which included BMI, neck circumference, ASA scores, TMD, RHTMD, TMH, modified Mallampati class, baseline SpO2, and snoring; (2) The model of Type B incorporated 13 variables, which included age, BMI, neck circumference, ASA scores, TMD, TMH, SMD, modified Mallampati class, baseline SpO2, GIT, operating time, induction propofol dose and total propofol dose; (3) The model of Type C was incorporated nine variables, which included BMI, neck circumference, ASA scores, TMD, RHTMD, TMH, RHSMD, modified Mallampati class and baseline SpO2; and (4) The model of Type D was incorporated ten variables, which included age, BMI, neck circumference, TMD, TMH, SMD, RHSMD, modified Mallampati class, baseline SpO2, and induction propofol dose. Table S4 shows the detailed coefficients of all non-zero coefficient variables after LASSO.
Performance
Among the four algorithms for the Type A model, XGBoost was chosen as the final prediction model for this type, SVM was chosen as that for Type B, XGBoost was for Type C, and LR was for Type D (Supplemental Materials). As shown in , the AUPRC and AUROC of Type A final model (XGBoost) are 0.583 (0.374–0.765) and 0.938 (0.905–0.971) respectively, while those for Type B are 0.650 (0.436–0.817) and 0.952 (0.924–0.979), for Type C are 0.525 (0.315–0.727) and 0.933 (0.898–0.969), and for Type D are 0.617 (0.395–0.799) and 0.947 (0.914–0.981). Furthermore, the optimal threshold for each model was determined by Youden’s index on ROC, and the accuracy, sensitivity, specificity, F1 score and MCC of each model on internal test cohort prediction were calculated under this threshold. The detailed results can be found in . All models have been well–calibrated ().
Figure 2. The PRC curve (a) and ROC curve (b) of 4 final models in the internal testing set. AUPRC, the area under the precision-recall curve; AUROC, the area under the receiver operating characteristic curve; LR, logistic regression; SVM, support vector machine; XGBoost, extreme gradient boosting; Type A, the early prediction model of intraoperative hypoxemia; Type B, the late prediction model of intraoperative hypoxemia; Type C, the early prediction model of induction period hypoxemia; Type D, the late prediction model of induction period hypoxemia. The single file for each plot can be found in the figure details of the supplemental materials.
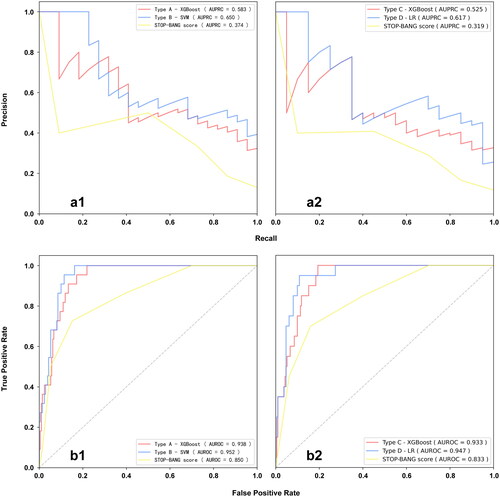
Table 1. The performance of the 4 final models under the optimal threshold in the internal testing set.
Comparison with the STOP-BANG score
We compared the selected final model’s predicted performance with the STOP-BANG score alone. As a result, the prediction of classification targets by the four models is significantly better than the STOP-BANG score in terms of AUPRC (P-value < 0.05). The detailed information for comparison with the STOP-BANG score is shown in and .
Table 2. Comparison of the performance between the prediction model and STOP-BANG score for predicting intraoperative hypoxemia.
Table 3. Comparison of the performance between the prediction model and STOP-BANG score for predicting induction period hypoxemia.
Temporal validation
The performance of the four types of models on temporal validation cohort (XGBoost for Type A, SVM for Type B, XGBoost for Type C, and LR for Type D) is respectively as follows (Table S9): the areas under PRC of 0.667 (0.474–0.817), 0.823 (0.633–0.926), 0.546 (0.342–0.735), and 0.672 (0.457–0.833); the areas under ROC of 0.946 (0.909–0.983), 0.974 (0.951–0.997), 0.946 (0.916–0.975), and 0.939 (0.890–0.988). The results of other evaluation metrics are shown in Table S10, and Figure S4 shows the PRC and ROC plots of these models on this cohort. All four types of models have a good performance in the temporal validation cohort.
External validation
The areas under the PRC of the four different types of the model (XGBoost, SVM, XGBoost, and LR) on the external validation dataset are 0.377 (0.189–0.611), 0.541 (0.318–0.749), 0.270 (0.094–0.569) and 0.543 (0.276–0.787) respectively (Table S11). Other generalization evaluation metrics are listed in Table S11 and Table S12. All types of models significantly outperformed the STOP–BANG score on PRC and ROC space (p-value < 0.05). Detailed information on comparing the model with STOP–BANG on the external validation dataset can be found in Table S13.
Interpretation
Global interpretation
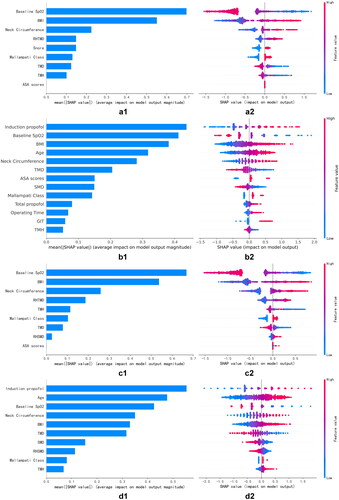
As shown in , in the global interpretation, we calculated the SHAP values for each type of selected model separately on the training cohort and averaged them, thus determining the ranking of feature importance. For model Type A (XGBoost) the baseline SpO2, BMI, and neck circumference are the three variables that influence prediction most (). The lower the baseline SpO2, the larger the BMI and the neck circumference, and the higher the risk for patients to have intraoperative hypoxemia (). For model Type B (SVM), the BMI and baseline SpO2 contribute the most to the outcome prediction (), and high BMI and low SPO2 increase the risk of intraoperative hypoxemia in patients and . For model Type C (XGBoost), baseline SpO2 and BMI are the two most influential variables in the prediction results ( and )). For model Type D (LR), induced dose of propofol, age, and baseline SpO2 were the three most important variables (). The patients higher the induction dose of propofol, older the age, and lower the baseline SpO2, are more likely to develop hypoxemia during the induction period (). It is worth noting that the impact of baseline SpO2 on the prediction results of all four types of models is important.
Figure 3. SHAP summary plot of the 4 types of the final model. (1) SHAP bar plot for the ranking of variables’ importance. The sorted result was based on the mean absolute SHAP value of each variable in every Type of final model. (2) SHAP beeswarm plot for the entire distribution of SHAP values for each variable in every Type of final model. Each line represents a variable and each dot represents a case. The redder the color of the dot, the higher the value of the variable for the case. Conversely, the bluer the color of the dot, the lower the value of the variable for the case. The abscissa represents the SHAP value, where a positive value helps the model to predict the case of developing hypoxemia, and vice versa. Type A, the early prediction model of intraoperative hypoxemia; Type B, the late prediction model of intraoperative hypoxemia; Type C, the early prediction model of induction period hypoxemia; Type D, the late prediction model of induction period hypoxemia; ASA, American Society of Anesthesiologists; BMI, Body mass index; GIT, Gastroscopy intubating times; RHSMD, Height-to-sternomental distance; RHTMD, Height-to-thyromental distance; SMD, Sternomental distance; TMD, Thyromental distance; TMH, Thyromental height. The single file for each plot can be found in the figure details of the supplemental materials.
Local interpretation
From the internal testing cohort, we randomly selected three cases for each model to reveal how they yield individual predictions, and these cases are true-positive (TP), true-negative (TN), and false-negative case (FN), respectively.
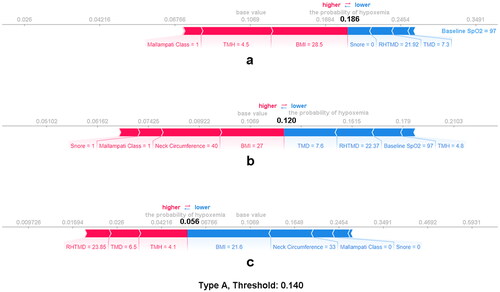
For example, as the model Type A, the XGBoost made a correct prediction for patient A1 () with the probability of 0.186 (threshold: 0.140), and the BMI of 28.5, TMH of 4.5 contributed the most to this prediction. The model also made a correct prediction for patient A2 (), mainly based on the TMD of 7.6, RHTMD of 22.37, and baseline SpO2 of 97 (probability of 0.120). Besides, the model incorrectly predicted the risk (probability of 0.056) of intraoperative hypoxemia in patient A3 (), and the primary basis for this prediction is a BMI of 21.6, a neck circumference of 33, and modified Mallampati class of 0, which means that these three variables may also be the main variables that affect the prediction accuracy of the model. The individual explanations of other types of models are mentioned in the Supplemental Materials.
Figure 4. SHAP force plot for individual case explanation on three random patients from the testing cohort of Type A model (SVM). Red represents that the variable increases the chance that the model predicts the patient developing hypoxemia, while blue represents that the variable reduces the chance that the model predicts the patient developing hypoxemia. The figure after the equal sign of the variable name represents the value of the variable (not the value of the SHAP value), and the length of the color bar represents the amount of contribution. (a) true positive case. (b) true negative case. (c) False negative case. Type A, the early prediction model of intraoperative hypoxemia.
Discussion
In this study, we found ML model could bring a novel idea in screening outpatients with a higher risk of hypoxemia who received EGD. To the best of our knowledge, this study is the first model employing ML methods combining multi-dimensional clinical data. Based on preoperative and preoperative plus intraoperative variables, we established and validated four models eventually to predict the risk of hypoxemia during induction and the whole operation respectively, and provided a visual interpretation for individual risk prediction of each patient.
In the model evaluation of our study, our models demonstrated a certain advantage over the STOP-BANG score in terms of AUPRC. All four selected ML models overperformed the STOP-BANG score significantly, regardless of the temporal and external validation dataset. This improvement may be brought about by emerging ML methods and high-quality clinical data. ML predominates in learning and handling multi-variables objectively and could provide us with suggestions from a unique perspective. At the same time, we dropped variables in the STOP-BANG score regarding subjective perceptions of patients, such as whether patients feel tired or sleepy during the daytime, which made our models work more objectively. Furthermore, it is worth noting that all items on the STOP-BANG score were given equal influence weight, counted as 0 or 1, which deviated from the real world and may also impact the predictive performance of this score [Citation22]. In the present study, this score was eliminated in performing the LASSO regression screening variables. It might indicate that the variables contained in our models are sufficient to perform the contribution of this score.
Another advantage of our study was that the model combined the relevant indicators of airway assessment. Airway assessment is one of the items of pre-sedation assessment recommended in guidelines for sedation in gastroenterological endoscopy to improve sedation safety [Citation2]. Detailed preoperative airway assessment could anticipate the risk of patients with a difficult airway, which could facilitate anesthesiologists in planning the airway management strategy. In addition to an interview of medical history, anesthesiologists usually examine the physical features of the head and neck carefully [Citation23,Citation24]. However, most of the existing studies only choose the modified Mallampati class as the main feature of airway assessment while ignoring other indicators [Citation11,Citation25,Citation26]. The present study explored the connection between hypoxemia and various physical features, such as TMD, RHTMD, neck circumference, anodontia/agomphosis, etc. Eventually, we found that neck circumference and modified Mallampati class always played important roles in prediction of final models. Some patients’ physical characteristics, such as TMD, RHTMD, SMD, and TMH, also correlated with hypoxemia. Previous research also finds that Mallampati >2 and TMD (<6.5 cm) show the excellent negative predictive value in screening difficult tracheal intubation and concludes that difficult tracheal intubation is a significant risk factor for hypoxemia [Citation27]. Prediction tools should incorporate these variables to improve predictive performance and reduce the workload for anesthesiologists to integrate data and information.
In comparing the feature contributions of the four selected models, we found that among the appended intraoperative variables, the induced propofol dose greatly affected the predicted results, while the total dose of propofol was relatively small. This may suggest that special attention should be paid to the dose of propofol during the induction period. Furthermore, the importance of age emerged with the addition of propofol doses. It also occupied an important position in both models with preoperative plus intraoperative variables. This may be related to the fact that elderly patients were more sensitive to sedative drugs and more likely to have respiratory system complications at the same dose of propofol [Citation28,Citation29]. This result suggests that we should consider the effect of age on the risk of hypoxemia in combination with sedative drugs.
Our models as a tool could assist anesthesiologists more flexibly and dynamically according to the actual clinical situation. First, anesthesiologists could use the preoperative variables model to evaluate the hypoxemia risk of patients and combine it with clinical experience to formulate a preliminary sedation strategy. Then the re-assessment was performed according to the preliminary sedation strategy and our preoperative plus intraoperative variables model. Finally, according to the results of this re-assessment combined with the feature contribution results of visual interpretation, anesthesiologists could take appropriate measures and adjust sedation strategies pertinently to reduce the hypoxemia risk of patients. Furthermore, considering that the induction of anesthesia is a high-risk period for hypoxemia [Citation5,Citation30], two prediction models for the hypoxemia risk during induction were also developed to help anesthesiologists distribute their attention reasonably to a certain extent.
Several limitations still existed in the present study. First, in order to study the effect of propofol dose on prediction better, we excluded patients induced with propofol and etomidate. However, the impact on the results might be minimal because of the limited number of patients choosing other schemes for anesthesia. Second, our intervention strategies may have led to a low incidence of hypoxemia in our cohort, which might cause some potential bias in the classification of patients’ clinical endpoints. However, this is an inherent defect of retrospective study, and this protective procedure is clinically necessary to protect the patient’s safety. The ML method we used might compensate for this to some extent because of its ability to continually learn this relevant feature from more additional real-world data. In the future study, more advanced definitions of the endpoint like an estimation of P/F ratios [Citation31] would also be considered, which could make our study more precise and satisfying. Third, the external validation dataset came from a different centre in the same region, while without validation cohorts from different regions and countries. There would be some obstacles to promoting and applying our models in other regions and countries. Accordingly, more cohorts and well-designed longitudinal studies are required to validate our models before they can be applied.
Conclusions
To our knowledge, our models were the first ML model for predicting hypoxemia risk in anesthesia-assisted EGD, which achieved excellent overall predictive ability integrating various clinical indicators, and performed better than the STOP-BANG score. These models have the potential to become an effective tool for adjusting sedation strategies flexibly and reducing the workload of anesthesiologists. In addition, we found that the relevant variables of airway assessment should be fully taken into account when analyzing the risk factor of hypoxemia. The effect of patients’ age on their hypoxemia risk may be considered in conjunction with the propofol dose.
Author contributions
Study conception/design: Yanna Si, Jianjun Zou, Hongguang Bao; Data acquisition: Zhaojing Fang, Xiuxiu Zhao; Data analysis and model construction: Daizun Zou; Interpreting results: Daizun Zou, Weigen Xiong, Zhaojing Fang; Initial drafting of manuscript: Weigen Xiong, Daizun Xiong; Critical revision of manuscript: Yanna Si, Jianjun Zou, Zhaojing Fang, Daizun Zou, Weigen Xiong.
Supplemental Material
Download MS Word (24.1 KB)Data availability statement
The data that support the findings of this study are available from the corresponding author, [Yanna Si], upon reasonable request. The related code to the study is available at https://github.com/zdznj/hypoxemia.
Disclosure statement
The authors declare that they have no competing interests.
Additional information
Funding
References
- Multisociety sedation curriculum for gastrointestinal endoscopy. Hepatology. 2012;56:e1–25.
- Gotoda T, Akamatsu T, Abe S, et al. Guidelines for sedation in gastroenterological endoscopy (second edition). Dig Endosc. 2021;33(1):21–53.
- Qadeer MA, Rocio Lopez A, Dumot JA, et al. Risk factors for hypoxemia during ambulatory gastrointestinal endoscopy in ASA I-II patients. Dig Dis Sci. 2009;54(5):1035–1040.
- Qadeer MA, Lopez AR, Dumot JA, et al. Hypoxemia during moderate sedation for gastrointestinal endoscopy: causes and associations. Digestion. 2011;84(1):37–45.
- Ehrenfeld JM, Funk LM, Van Schalkwyk J, et al. The incidence of hypoxemia during surgery: evidence from two institutions. Can J Anaesth. 2010;57(10):888–897.
- Griffin SM, Chung SC, Leung JW, et al. Effect of intranasal oxygen on hypoxia and tachycardia during endoscopic cholangiopancreatography. BMJ. 1990; 300(6717):83–84.
- Holm C, Christensen M, Rasmussen V, et al. Hypoxaemia and myocardial ischaemia during colonoscopy. Scand J Gastroenterol. 1998;33(7):769–772.
- Long Y, Liu HH, Yu C, et al. Pre-existing diseases of patients increase susceptibility to hypoxemia during gastrointestinal endoscopy. PLOS One. 2012;7(5): e37614.
- Laffin AE, Kendale SM, Huncke TK. Severity and duration of hypoxemia during outpatient endoscopy in obese patients: a retrospective cohort study. Can J Anaesth. 2020;67(9):1182–1189.
- Patel VA, Romain PS, Sanchez J, et al. Obstructive sleep apnea increases the risk of cardiopulmonary adverse events associated with ambulatory colonoscopy independent of body mass index. Dig Dis Sci. 2017;62(10):2834–2839.
- Mehta PP, Kochhar G, Kalra S, et al. Can a validated sleep apnea scoring system predict cardiopulmonary events using propofol sedation for routine EGD or colonoscopy? A prospective cohort study. Gastrointest Endosc. 2014;79(3):436–444.
- Corso RM, Piraccini E, Agnoletti V, et al. Clinical use of the STOP-BANG questionnaire in patients undergoing sedation for endoscopic procedures. Minerva Anestesiol. 2012;78(1):109–110.
- Hatib F, Jian Z, Buddi S, et al. Machine-learning algorithm to predict hypotension based on high-fidelity arterial pressure waveform analysis. Anesthesiology. 2018;129(4):663–674.
- Lee HC, Ryu HG, Chung EJ, et al. Prediction of bispectral index during target-controlled infusion of propofol and remifentanil: a deep learning approach. Anesthesiology. 2018;128(3):492–501.
- Chung F, Yegneswaran B, Liao P, et al. STOP questionnaire: a tool to screen patients for obstructive sleep apnea. Anesthesiology. 2008;108(5):812–821.
- Shalabi LA, Shaaban Z, Kasasbeh B. Data mining: a preprocessing engine. J of Computer Science. 2006;2(9):735–739.
- Okada S, Ohzeki M, Taguchi S. Efficient partition of integer optimization problems with one-hot encoding. Sci Rep. 2019;9(1):13036.
- Vasquez MM, Hu C, Roe DJ, et al. Least absolute shrinkage and selection operator type methods for the identification of serum biomarkers of overweight and obesity: simulation and application. BMC Med Res Methodol. 2016;16(1):154.
- Saito T, Rehmsmeier M. The precision-recall plot is more informative than the ROC plot when evaluating binary classifiers on imbalanced datasets. PLOS One. 2015;10(3):e0118432.
- DeLong ER, DeLong DM, Clarke-Pearson DL. Comparing the areas under two or more correlated receiver operating characteristic curves: a nonparametric approach. Biometrics. 1988;44(3):837–845.
- Sm L, Si L. A unified approach to interpreting model predictions. Proc Adv Neural Inf Process Syst. 2017;30:4768–4777.
- Chung F, Abdullah HR, Liao P. STOP-Bang questionnaire: a practical approach to screen for obstructive sleep apnea. Chest. 2016;149(3):631–638.
- Apfelbaum JL, Hagberg CA, Connis RT, et al. 2022 American society of anesthesiologists practice guidelines for management of the difficult airway. Anesthesiology. 2022;136(1):31–81.
- Artime CA, Roy S, Hagberg CA. The difficult airway. Otolaryngol Clin North Am. 2019;52(6):1115–1125.
- Liou SC, Hsu CM, Chen C, et al. Assessment of the Berlin questionnaire for evaluation of hypoxemia risk in subjects undergoing deep sedation for screening gastrointestinal endoscopy. Ther Clin Risk Manag. 2018;14:1331–1336.
- Cho J, Choi SM, Park YS, et al. Prediction of cardiopulmonary events using the STOP-Bang questionnaire in patients undergoing bronchoscopy with moderate sedation. Sci Rep. 2020;10(1):14471.
- Baillard C, Boubaya M, Statescu E, et al. Incidence and risk factors of hypoxaemia after preoxygenation at induction of anaesthesia. Br J Anaesth. 2019;122(3):388–394.
- Dundee JW, Robinson FP, McCollum JS, et al. Sensitivity to propofol in the elderly. Anaesthesia. 1986;41(5):482–485.
- Ogawa T, Tomoda T, Kato H, et al. Propofol sedation with a target-controlled infusion pump in elderly patients undergoing ERCP. Gastrointest Endosc. 2020; 92(2):301–307.
- Peterson GN, Domino KB, Caplan RA, et al. Management of the difficult airway: a closed claims analysis. Anesthesiology. 2005;103(1):33–39.
- Gadrey SM, Mohanty P, Haughey SP, et al. Overt and occult hypoxemia in patients hospitalized with COVID-19. Crit Care Explor. 2023;5:e0825.