
 ?Mathematical formulae have been encoded as MathML and are displayed in this HTML version using MathJax in order to improve their display. Uncheck the box to turn MathJax off. This feature requires Javascript. Click on a formula to zoom.
Abstract
Background/Objective
Plant-based diets reduce the risk of cardiovascular disease but also increase the risk of certain micronutrient deficiencies, particularly, of vitamin B12 (B12). The extent to which the unsupervised use of oral nutrient supplements is sufficient to prevent these deficiencies is not well established. We analyzed nutrient intake, laboratory biomarkers, supplementation behavior, and B12 status adequacy amongst young, healthy, physically active omnivores, lacto-ovo-vegetarians and vegans from Germany.
Methods
We recruited 115 participants (n = 40 omnivores; n = 37 lacto-ovo-vegetarians, and n = 38 vegans) with comparable age, sex, marital status, physical activity and educational levels through online advertisements and local newspapers in Freiburg, Germany.
Results
Energy intake and macronutrient distribution were comparable across diets. Major differences included intake of fiber, cholesterol, and several vitamins. Vegans had the lowest intake of B12 from foods (0.43 (0.58) µg/d), compared to omnivores (2.14 (2.29) µg/d) and lacto-ovo-vegetarians (0.98 (1.34) µg/day). Multivariate analysis of 36 blood biomarkers revealed that three major classes of biomarkers contributed the most to the clustering of individuals by dietary group, namely, biomarkers of B12 status (B12, holoTC, Hcy), iron (iron, ferritin, transferrin) and lipid metabolism (vitamin A, HDL, LDL, total cholesterol, TAG). This suggests that nutrients that modify the metabolic pathways represented by these biomarkers have the most penetrating effect on health status across diets. Analysis of B12 status (including 4cB12) revealed adequacy in omnivores and vegans, and a poorer B12 status amongst lacto-ovo-vegetarians. Fewer lacto-ovo-vegetarians used B12 supplements compared to vegans (51% versus 92%).
Conclusions
Even amongst homogeneously healthy Germans, each diet manifested with measurable differences in dietary intakes and biomarkers of health. Plant-based diets, in particular the vegan diet, exhibited the most favorable patterns of lipid metabolism and glycemic control, but the lowest food intake of B12. Supplementation of healthy vegans with B12 (median 250 µg B12/day, over 1 year) secured an adequate B12 status that was comparable to that of healthy omnivores.
Clinical Trial Registry: German Clinical Trial register number: DRKS00027425
Key Messages
Plant-based diets, in particular the vegan diet, exhibited the most favorable patterns of lipid metabolism and glycemic control, but the lowest food intake of B12.
Analysis of B12 status (including 4cB12) revealed adequacy in omnivores and vegans, and a poorer B12 status amongst lacto-ovo-vegetarians.
Supplementation with B12 (median 250 µg B12/day, over 1 year) in healthy physically-active vegans secured an adequate B12 status that was comparable to that of healthy omnivores.
Introduction
Within the last 20 years, plant-based nutrition has received increasing interest for its potential benefits to human and environmental health [Citation1,Citation2]. The umbrella term ‘plant-based’ describes a wide spectrum of different dietary patterns, which all center around a regular intake of plant products, emphasizing fruits, vegetables, wholegrains, legumes, nuts and seeds [Citation3,Citation4]. Among plant-based diets, vegetarian diets (which include dairy products and eggs but exclude fish and meat) and vegan diets (which exclude all animal products) enjoy uninterrupted popularity [Citation5].
Both diets have been associated with various health benefits, including a reduced risk of diabetes, ischemic heart disease, and cancer [Citation6–8]. Poorly designed, hypocaloric and non-diversified plant-based diets, however, bear the risk for severe macro- and micronutrient deficiencies [Citation9,Citation10].
In this context, vitamin B12 is a frequently discussed micronutrient of concern in vegetarians and vegans [Citation11–13]. While vitamin B12 deficiency has traditionally been reported to occur more frequently with both diets [Citation11], newer studies suggest that the plant-based community has adopted its supplementation habits, and pays increasing attention to meet vitamin B12 intake recommendation [Citation14,Citation15]. In two recent independent German studies, 88% and 91% of the respective participants supplemented vitamin B12 [Citation14,Citation15].
Notably, there are several other nutrients of concern in vegans and vegetarians, including calcium, iodine, zinc, eicosapentaenoic acid (EPA), docosahexaenoic acid (DHA) and iron [Citation16–20].
Studies that quantitatively assess nutritional status in adult vegans and vegetarians in German-speaking countries are rare [Citation21–24], and often challenged by heterogeneous health status across diets, broad age ranges wherein age-related malabsorption becomes a confounder, especially in the assessment of vitamin B12 status, a lack of laboratory measurements, and no or only qualitative nutrient supplementation recordings. As a result, many questions with regard to micro- and macronutrient status in German vegetarians and vegans remain unanswered.
To bridge this gap in knowledge, we conducted an unsupervised cross-sectional study in Freiburg, Southern Germany to compare the nutritional status of healthy, free-living individuals that consumed either an omnivorous, a lacto-ovo-vegetarian or a vegan diet for at least two years. While the major focus of the study was vitamin B12 metabolism, a micronutrient only synthesized by a small group of bacteria and archaea and scarce to non-existent in unfortified plant-based diets [Citation25], other nutrients known to exist in reduced quantities in plant-based diets were also investigated.
Materials and methods
Our cross-sectional study was performed between December 2021 and May 2022. Sixty-six percent of participants were recruited between March and May 2022. The trial was approved by the ethical committee of the University Medical Center of Freiburg, Germany (EK Freiburg 21-1442) before onset and registered at the German Clinical Trial register (DRKS00027425). We performed the study in accordance with the declaration of Helsinki and the most recent ICH guidelines (International Conference on Harmonization) for good clinical practice. Data was handled with strict confidentiality, and all participants gave written and oral consent before participation.
Course of the study
We advertised for the study in two local newspapers and various social media platforms (including Facebook and WhatsApp). Persons who expressed interest in participating in the study were recruited in a 3-step-process. In a first step, we screened interested individuals by phone. Potentially eligible individuals were then invited in a second step for a personal interview, and for a detailed assessment of inclusion and exclusion criteria at our institution (see below). Eligible individuals that provided written consent were subsequently invited for a third appointment, where biosampling took place. Participants received no financial incentive for study participation but were provided with the results of the dietary records and laboratory analyses upon request.
Inclusion and exclusion criteria
Healthy individuals aged 18 years or older were eligible for the study. Potential participants had to be proficient in German and willing to complete weighed food diaries on 4 different days. As per the study protocol, only individuals that indicated strict long-term dietary adherence (longer than 24 months) to either a vegetarian, a vegan or an omnivorous diet without interruptions were considered eligible.
The study targeted healthy, free-living individuals. In accordance with recommendations of the World Health Organization (WHO) [Citation26], individuals with a Body Mass Index (BMI) <18.6 (underweight) or >29.9 (obesity) kg/m2 were not allowed to participate. We also excluded individuals with acute and chronic illnesses, such as diabetes, thyroid disease or celiac disease. Pregnant women and lactating women were excluded, as well. In addition, we excluded individuals with (self-reported) eating disorders, individuals that participated in another clinical trial in the last 4 weeks or donated blood in the last 6 weeks. Self-reported smokers or regular alcohol consumers (>30 g/day) were denied participation. Finally, we carefully assessed regular medication and excluded all individuals taking preparations that potentially interfered with vitamin B12 metabolism (including but not limited to proton pump inhibitors and antacids).
Demographic and anthropometric assessment
A study-specific paper-based questionnaire in the German language was used to capture sociodemographic data, including sex, age upon study participation, marital status, race/ethnicity, educational achievement, and occupation as well as employment status.
Participants were measured without shoes, wearing light clothes, and with empty pockets using a calibrated digital scale and a portable stadiometer. Height and weight were measured to the nearest 1 cm and half-kilogram, respectively (one measure).
Dietary assessment
We estimated dietary intake based on a four-day weighed food diary, similar to a 2015 study in a Danish population [Citation27]. All foods were quantified to the nearest 0.1 g using calibrated precision scales (ProScale XC-2000, HBI Europe, Erkelenz, Germany or Wedo Elektronische Universalwaage Optimo 5000, Dieburg, Germany). Scales were provided for each participant.
All participants received detailed instructions in filling in the food diaries by qualified medical personnel. We instructed all participants to document the following information for all foodstuffs and beverages: time and place of consumption, brand name, exact product name, packaging details, condition at the time of purchase, organic produce status, weighed quantity and remaining quantity. When exact weighing was impossible (e.g. in the case of eating out in a restaurant or bar), semi-quantitative household recording with measures (e.g. cups, spoons) was allowed following an established approach by Alexy et al. [Citation14]. We did not consider nutritional supplements for nutrient intake calculation in this analysis and instead focused on nutrient intake from foods.
The food diary comprised two working days and two weekend days. Average daily intake (ADI) of macro- and micronutrients was estimated as follows:
We evaluated all nutritional protocols using NutriGuide® plus software (Version 4.9, Nutri-Science GmbH, Hausach, Germany). Based on Willett’s criteria, we considered only nutritional protocols with a plausible energy intake (≥800 kcal/d) for the present study [Citation28]. The data was entered and analyzed blinded for diet assignation by two independent individuals.
Social status assessment
Subjective social status was measured with the German version of the MacArthur Scale of Subjective Social Status (MASSS) [Citation29]. The MASSS is a pictorial representation that uses a symbolic ladder developed to capture the common sense of social status based on usual socioeconomic status indicators [Citation30]. It is a single-item measure that assesses a person’s perceived rank relative to others in their group [Citation31].
Supplement assessment
All participants were instructed to bring their dietary supplements on the day of examination or biosampling. On such days, every supplement was documented with the exact daily dose. We inquired about all supplements taken within the last 12 months. We also registered whether participants took multivitamin supplements (defined here as a supplement that includes more than 2 different nutrients/vitamins). In several instances, participants supplemented a specific nutrient with more than one supplement. This was often the case with vitamin B12, where many participants took a B12 supplement and an additional multivitamin supplement that also included smaller amounts of B12. In such cases, we calculated an average daily intake for the provided supplementation period.
Physical activity assessment
We assessed physical activity with the long form of the International Physical Activity Questionnaire (IPAQ) [Citation32]. The IPAQ is a validated instrument designed for population surveillance of physical activity among adults aged 15–69 years. It is a frequently used tool in population research with excellent test-retest reliability for the overall score [Citation33]. Strong positive relationships were observed between IPAQ data and activity monitor data for total physical activity and vigorous activity [Citation34]. Physical activity data collected with the IPAQ was reported as a continuous measure (in median Metabolic Equivalent minutes (MET-minutes)). MET minutes represent the amount of energy expended carrying out physical activity. We strictly followed the revised guidelines for data processing and analysis of the IPAQ (except for the truncation process in light of our very active cohort). We weighted each type of activity by its energy requirements defined in METs to yield a score in MET–minutes. METs are multiples of the resting metabolic rate. A MET-minute was computed by multiplying the MET score of an activity by the minutes performed and total MET-scores were computed based on the sum of all activities.
Biomaterial acquisition and processing
Blood was taken by venipuncture between 7:45 am and 10:30 am. Prior to that, participants were instructed to fast overnight for at least 10 h. We obtained 200 mL of blood, 10 mL of urine and at least six grams of stool from all study participants. All tubes and cryovials for serum, urine and stool were labeled without information about the participant’s diet.
Serum from each participant was collected and aliquoted in six separate 1.5-mL cryovials and stored at −80 °C until measurement or transportation to external laboratories. We aliquoted urine samples in eight 1 mL cryovials and froze them immediately at −80 °C until measurement or transportation to external laboratories. Dry ice was used for all sample transports to external laboratories. All methods were previously established and validated.
Laboratory analyses
Measurement of a differential blood count, a lipid panel (including cholesterol, high density lipoprotein cholesterol (HDL-C), low density lipoprotein cholesterol (LDL-C) and triglycerides), HbA1c, vitamin B12, holo-transcobalamin (holo-TC), creatinine, (highly sensitive) C-reactive protein, ferritin, a thyroid panel and liver enzymes was performed by the accredited Central Laboratory of the University Medical Center of Freiburg (Institute of Clinical Chemistry and Laboratory Medicine, Medical Centre – University of Freiburg, Hugstetter Str. 55, 79106 Freiburg im Breisgau, Germany).
Vitamins A, B1, B2, B6, E, and K were measured using High-Performance Liquid Chromatography (HPLC) at the accredited laboratory MVZ Clotten Labor Dr. Haas, Dr. Raif & Kollegen GbR (Merzhauser Str. 112, 79100 Freiburg im Breisgau, Germany). Selenium was measured in the certified routine laboratory Limbach (Limbach Analytics GmbH Labor, Edwin-Reis-Straße 6-10, 68229 Mannheim, Germany) using EDTA-plasma. Homocysteine (Hcy) and methylmalonic acid (MMA) were determined in EDTA-plasma by liquid chromatography tandem mass spectrometry (LC-MS/MS) in the Laboratory of Clinical Biochemistry and Metabolism, Center for Pediatrics and Adolescent Medicine, Medical Center, University of Freiburg. Supplementary Table 1 gives an overview of the methods used to determine biochemical parameters obtained in this study.
Assessment of vitamin B12 status
Vitamin B12 status was assessed by the measurement of its four biomarkers in plasma, namely, vitamin B12, holotranscobalamin (holoTC), homocysteine (Hcy) and methylmalonic acid (MMA) [Citation35]. In addition, we calculated the combined indicator of vitamin B12 status (4cB12, cB12 index), which accounts for the four biomarkers of vitamin B12 status, age and folate concentration in plasma [Citation36]. The equation of the cB12 index is as follows:
The reference ranges utilized in this study have been employed worldwide and reviewed elsewhere [Citation35,Citation37]: Hcy: 5-15 µM; MMA: < 0.260 µM; holoTC: < 35 pM, and vitamin B12: <149 pM deficiency; 149-250 pM subclinical deficiency; and >250 pM normal.
Statistical analyses
Descriptive analysis
The minimum sample size for the primary outcome of this study (cB12-index) was estimated using G*Power software. Considering a statistical power of 80%, a hypothesized large effect size, and main effect of group (omnivorous, lacto-ovo-vegetarians and vegans) with blocking factors of biological sex (female, male), BMI (normal, overweight), vitamin B12 supplementation (yes, no) and level of physical activity (low, medium and high), it was calculated that a minimum of 84 participants (28 per group) would be required to detect differences between groups at a statistical significant level of p < .05. We used histograms, box plots, and subgroup summary statistics to check for frequency distribution and normality of each variable before starting our analysis. In addition, we employed Stata’s Shapiro-Francia-Test to check for normal distribution of data. We described normally distributed variables with its mean ± standard deviation and non-normal distributed variables with its median (interquartile range). For the intergroup comparisons, we used parametric and non-parametric tests as applicable. When comparing not-normally distributed continuous variables, we used Kruskal–Wallis H test to determine if there were statistically significant differences between the 3 groups in the independent variables of interest. For normally distributed data, we used one-way analysis of variance to determine whether the mean of the dependent variable of interest was the same in the 3 groups. For comparisons of categorical variables, we used the chi-square test of association where applicable. Statistical significance was determined at α = 0.05. All descriptive analyses were performed with STATA 14 statistical software (StataCorp. 2015. Stata Statistical Software: Release 14. College Station, TX: StataCorp LP).
Multivariate analysis
A selected set of plasma laboratory biomarkers of widespread routine clinical use (see list in Supplementary Table 2) were subjected to multivariate analysis to investigate differences in the profile of participants undergoing the three different diets. For this analysis, participants 37 and 45 were removed due to missing values in vitamin A. Participants 69, 86 and 101 were removed due to missing values in most of the lab measurements.
As such, we performed probabilistic principal component analysis (PPCA) on a total of 36 laboratory markers [Citation38]. Permutational multivariate analysis of variance (PERMANOVA) [Citation39] was applied on the selected principal components (selected by maximizing the model’s Bayesian information criteria, BIC) to investigate the main effects of Diet (three levels, Omnivorous, Vegetarian and Vegan) and Sex (two levels, female and male) and their interactions on the laboratory measurement profile. If any effect was observed, post hoc tests with FDR adjustments were performed. Including age, BMI or age and BMI as covariates did not improve the model (Supplementary data, Figure S1), hence the model was established without these as covariates. For visualization, we performed nonmetric dimensional scaling (NMDS) [Citation39]. The statistical threshold for significance was set to alpha = 0.05. All multivariate analyses were carried out with R [Citation40].
Results
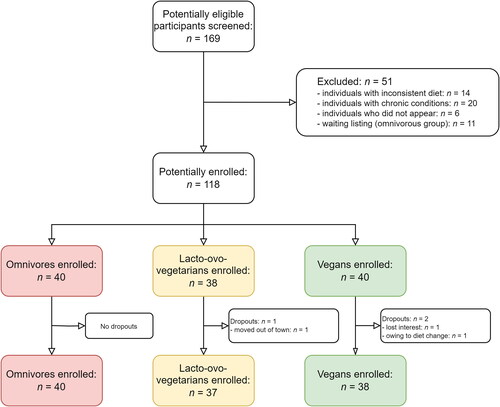
The final study sample comprised n = 115 participants, of which n = 40 were omnivores, n = 37 were lacto-ovo-vegetarians and n = 38 were vegans. displays the participant inclusion flow-chart for this study. A greater participation of females over males was seen in all dietary groups.
Figure 1. Flow diagram of eligibility criteria of the present study. A total of 40 omnivores, 37 lacto-ovo-vegetarians and 38 vegans were enrolled in the study. The resulting cohort was comprised of three dietary groups with comparable age, sex, marital status, educational level, and ethnicity.
Study population characteristics
Sociodemographic and anthropometric sample characteristics are shown in .
Table 1. Sociodemographic and anthropometric data of study participants by dietary group.
The 3 dietary groups did not differ significantly with regard to sex distribution, marital status, educational level, and race/ethnicity. Notably, the percentage of female participants tended to be higher in the lacto-ovo-vegetarian group as compared to the other groups. Anthropometric data did not reveal any statistically significant differences. Dietary adherence to the respective diet was longest in the omnivorous group (life-long) and differed significantly from the other groups (p <.001).
The number of participants intentionally consuming fortified foods also varied between groups and ranged from 12.5% in the omnivorous group to 21.1% in the vegan group. Fortified plant-based milk substitutes were the most commonly reported fortified food (n = 5 mentions in the omnivorous and lacto-ovo-vegetarian group, n = 8 mentions in the vegan group), followed by fortified salts (n = 2 mentions in the vegan group) and specially fortified tofu products (n = 1 in the lacto-ovo-vegetarian group). Results from the IPAQ showed that participants were physically active in all dietary groups. According to MET-categorization, 87.5% of omnivores, 86.5% of lacto-ovo-vegetarians and 81.6% of vegans had a high level of physical activity.
Nutrient intake
displays nutrient intake in the 3 dietary groups based on the four-day weighed food diaries.
Table 2. Nutrient intake data of study participants by dietary group.
We observed no significant intergroup differences with regard to median total energy intake and macronutrient distribution. Fiber and cholesterol intake differed significantly between groups (p = .001 and p < .001, respectively). Vegans had the highest fiber intake (median: 33.61 (19.54)) and the lowest cholesterol intake (median: 17.75 (49.40)). Saturated fatty acid (SFA) intake also differed significantly between groups (p < .001); yet there were no differences in the intakes of polyunsaturated fatty acids. Vitamin C and E intake were highest in vegans whereas Vitamin D and A were highest in omnivores. As expected, Vitamin B12 intake was highest in omnivores and lowest in vegans. Statistically significant differences were also found for folic acid and iodine intake across the 3 dietary groups.
Nutrient intake in comparison to the dietary recommendations published by the Societies for Nutrition in Germany (DGE), Austria (Österreichische Gesellschaft für Ernährung, ÖGE) and Switzerland (Schweizerische Gesellschaft für Ernährung, SGE), the so-called D-A-CH (D—Deutschland, Germany, A—Austria, CH—Confederation Helvetica, Switzerland) recommendations [Citation41], is shown in Supplementary Tables 3–5, which also includes a color-coded trend analysis.
Supplementation behavior
shows supplement intake in our cohort.
Table 3. Supplementation characteristics of study participants by dietary group.
There were no significant differences in supplement intake between the 3 dietary groups when dichotomizing (yes/no) by supplement use. A total of 77.5–94.74% of participants took supplements in each group, with a slightly higher tendency in vegans. Multivitamin intake was highest in vegans. The number of participants supplementing vitamin B12 was highest in vegans (92%), as well. Vegans took vitamin B12 on a daily basis (median) with a median dosage of 250 μg. Significant differences in supplement intakes were also observed with regard to iron, iodine, selenium, vitamin A and calcium. Supplementation of all 5 nutrients occurred significantly more frequently in vegans who supplemented these nutrients on a daily basis (median). Vitamin C supplementation tended to be more frequent in omnivores, although the difference was not statistically significant. EPA supplementation also occurred more frequently in vegans whereas no differences were found with regard to DHA intake.
Laboratory values
shows the results from the obtained laboratory values for each group.
Table 4. Laboratory measurements by dietary group.
No significant intergroup differences were observed with regard to white and red blood cell count, platelet count and hemoglobin levels. Vegans exhibited a significantly lower lymphocyte count than lacto-ovo-vegetarians and omnivores (p = .018). Vegans also had significantly lower HbA1c levels compared to omnivores (ΔHbA1c: −0.18%).
Lacto-ovo-vegetarians had the lowest vitamin B12 values, while vegans yielded the highest levels (p = .023). A comparable distribution was found with regard to holotranscobalamin II (p = .001). Significant intergroup differences were found with regard to vitamin E and vitamin K2 (p = .02 and .012, respectively). While high-density lipoprotein and triglyceride levels did not differ between groups, we found substantially lower low-density lipoprotein levels in vegans as compared to the other groups (p = .01). Omnivores had the highest levels of selenium, followed by lacto-ovo-vegetarians (p = .007). Uric acid levels were highest in vegans, followed by omnivores and lacto-ovo-vegetarians.
Multivariate analysis of plasma biomarkers
We selected a total of 36 plasma biomarkers that report on nutrient status, lipid, carbohydrate and protein metabolism, liver enzymes, renal and thyroid function and inflammation (Supplementary Table 2). To compare the profile of plasma biomarkers amongst the three dietary groups, a subset of 36 plasma biomarkers was subjected to PPCA. The PPCA model with the maximum BIC resulted in 25 principal components (Supplementary data, Figure S2). The loadings that were significantly different from zero and were larger than a pre-set cut off (following the suggestions by Nyamundanda and colleagues [Citation38], Supplementary data, Figure S3) are presented in . These laboratory measures contributed the most to explaining the variance in the PPCA. Biomarkers of vitamin B12 (vitamin B12, holoTC, Hcy), iron (iron, ferritin, transferrin) and lipid metabolism (vitamin A, HDL, LDL, total cholesterol, TAG) statuses had the most prominent contribution. Liver enzymes GOT and GPT as well as vitamin E also contributed to the metabolic differences between the dietary groups represented in plasma. Univariate analysis of these laboratory biomarkers is presented in . The overall metabolic differences that could be captured in plasma are visualized in 3-dimensional nonmetric dimension scaling analysis (NMDS) plots separated in three 2-dimensional plots (). The plasmatic metabolic compartment differed amongst dietary groups as well as between sexes.
Figure 2. Multivariate analysis of laboratory biomarkers of health. (A) Main contributing biomarkers to the variance of the first principal component resulting from the PPCA analysis. The analysis retrieved biomarkers of vitamin B12 status (vitamin B12, holoTC, Hcy), iron (iron, ferritin, transferrin) and lipid metabolism (vitamin A, HDL, LDL, total cholesterol, TAG) as most contributors to the separation across dietary types. (B) Nonmetric dimension scaling analysis (NMDS). each point represents the laboratory biomarker profile of each individual (dots) in 3-dimensions separated in six plots (NMDS2 versus NMDS1, NMDS3 versus NMDS1 and NMSD3 versus NMDS2). points closer to each other represent more similar biomarker profiles, and points away from each other represent more different biomarker profiles. Squares represent the centroid across individuals with the same diet (average across individuals for each dimension).
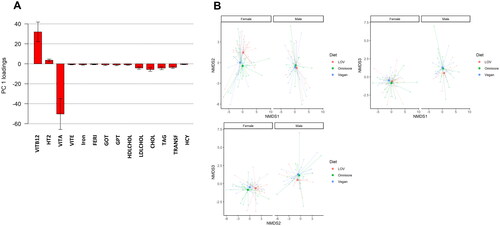
The PERMANOVA result on the resulting 25 principal components are presented in . Significant effects were observed for Diet (F = 22.69, p-value = .01) and Sex (F = 32.04, p-value = .006), without a significant interaction effect (F = 0.95, p-value = .44). Post hoc test on the levels of Diet revealed significant differences between omnivorous and vegetarian diets (p-value = .036) and between vegetarian and vegan diets (p-value = .034), but there were not significant differences between omnivorous and vegan diets (p-value = .153).
Table 5. Results of PERMANOVA analysis.
Vitamin B12 status
The assessment of vitamin B12 status requires the use of at least two of the four available biomarkers, namely, Hcy, MMA, holo-TC and vitamin B12 [Citation35]. Boxplots for the four biomarkers of vitamin B12 status for the three dietary groups are provided in . Statistically significant differences were identified for vitamin B12, holoTC and MMA, but not for Hcy. HoloTC concentrations were the lowest in the lacto-ovo-vegetarian group, and statistically different from that of omnivores and vegans. No differences in holoTC were identified between omnivores and vegans. Examination of the cB12 index retrieved statistically significant differences between dietary groups, wherein lacto-ovo-vegetarians displayed the poorest cB12 index (). No differences in the cB12 index were found between omnivores and vegans (). The majority of participants in all dietary groups exhibited a cB12 index consistent with an adequate vitamin B12 status. The lacto-ovo-vegetarian group had the highest number of individuals that classify as having decreased B12 (cB12 index −1) with a recommendation to start supplementation [Citation36].
Figure 3. Biomarkers of vitamin B12 status. (A) Plasma vitamin B12. (B) Plasma holoTC. (C) Plasma MMA. (D) Plasma Hcy. Dark red shadowing denotes values below or above reference ranges indicative of vitamin B12 deficiency. Light red shadowing depicts values that classify as low vitamin B12 or subclinical vitamin B12 deficiency. p values were adjusted for multiple comparisons using the holm method. The reference ranges utilized in this study were as follows: Hcy: 5–15 µM; MMA: <0.260 µM; holoTC: <35 pM, and vitamin B12: <149 pM deficiency; 149–250 pM subclinical deficiency; and >250 pM normal.
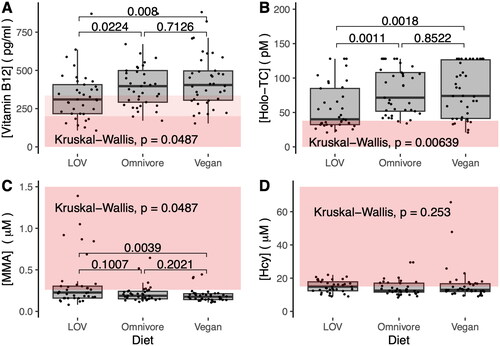
Figure 4. Combined vitamin B12 index (cB12). The status of vitamin B12 was assessed using the four-biomarker cB12 index, with adjustment for age and plasma folate concentration, as described in the studies by Fedosov et al. [Citation36]. The area shadowed with light red corresponds to a status of low vitamin B12 wherein the initiation of supplementation has been recommended [Citation36]. In this study, lacto-ovo-vegetarians followed by the vegan group possessed the greatest number of individuals with low vitamin B12.
![Figure 4. Combined vitamin B12 index (cB12). The status of vitamin B12 was assessed using the four-biomarker cB12 index, with adjustment for age and plasma folate concentration, as described in the studies by Fedosov et al. [Citation36]. The area shadowed with light red corresponds to a status of low vitamin B12 wherein the initiation of supplementation has been recommended [Citation36]. In this study, lacto-ovo-vegetarians followed by the vegan group possessed the greatest number of individuals with low vitamin B12.](/cms/asset/69d63494-3209-4ce0-be5e-12176ac94ed5/iann_a_2269969_f0004_c.jpg)
The surprising finding of an adequate vitamin B12 status in most of the vegan participants could be explained by the extensive use of vitamin B12 supplements (ca 90% of participants, median daily dosage of 250 μg, see ). As expected, vegans had the lowest intake of vitamin B12 from foods (0.43 (0.58) µg/day) compared to omnivores (2.14 (2.29) µg/day) and lacto-ovo-vegetarians (0.98 (1.34) µg/day).
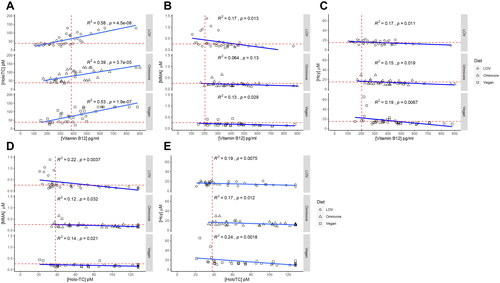
We next examined whether the different dietary patterns modified previously described relationships between the four biomarkers of vitamin B12 status [Citation42]. Plasma vitamin B12 and holo-TC were positively correlated independently of dietary pattern (). A negative correlation was identified between plasma vitamin B12 or holo-TC and the metabolites MMA and Hcy (). Notably, MMA and vitamin B12 were not correlated significantly in omnivores.
Figure 5. Correlation of biomarkers of vitamin B12 status. (A) Plasma vitamin B12 and holo-TC were positively correlated independently of dietary pattern. (B) Correlation between MMA and plasma vitamin B12. (C) Correlation between Hcy and plasma vitamin B12. (D) Correlation between MMA and plasma holoTC. (E) Correlation between Hcy and plasma holoTC. A negative correlation was identified between plasma vitamin B12 or holo-TC and the metabolites MMA and Hcy (panels B–E). MMA and vitamin B12 were negatively correlated in plant-based diets but not in omnivores. Light blue shadowing around the regression line: confidence interval. R2: coefficient of determination; p: p-value.
Discussion
The primary objective of this study was to assess the nutritional status of young healthy physically-active individuals on long-term omnivore, lacto-ovo-vegetarian and vegan diets. Vegetarian and vegan diets are associated with several health benefits but also bear the risk of nutritional deficiencies if they are poorly designed [Citation19]. A systematic review by Bakaloudi et al. showed that vegan diets in particular may come short in vitamin B12, iodine, selenium and zinc [Citation17]. However, high quality studies of vegan diets are rare, and only a few studies were not confined to analyses of nutritional protocols but also included laboratory measurements [Citation15,Citation16,Citation43].
Since the plant-based community is adopting supplementation as part of a well-planned diet, with increasing consideration of the importance of vitamin B12 [Citation14,Citation15], new studies are warranted to get insights into the current nutritional status and adequacy of vegetarian and vegan diets.
Combining clinical data with laboratory measurements, food diary analyses and meticulous supplementation assessment, we assessed the nutritional status of 115 healthy individuals in Freiburg, Southern Germany. The population under study was selected to be composed of young, non-smoking adults, thus excluding age-related malabsorption as a confounder in the analysis of vitamin B12 status [Citation37].
A vegan diet lowers lymphocyte count and increases plasma uric acid
Vegan participants in this study exhibited a lower lymphocyte count compared to ovo-lacto-vegetarians and omnivores. These findings are in line with with prior studies by others [Citation44–47]. A greater intake of vegetables (but not fruits) was associated with a lower leukocyte count in 986 healthy individuals from the PREDICT-1 nutritional intervention study [Citation48]. The gut microbiome contributed 20% of the effect of vegetable intake on leukocyte count [Citation48]. Plasma uric acid levels were highest in vegans, followed by omnivores and lacto-ovo-vegetarians, a rank-order that agrees with findings from a larger cross-sectional study [Citation49]. Greater plasma uric acid in vegans has been attributed to the lack of dairy product intake, which is thought to lower uric acid [Citation50], and to the lower calcium content of the vegan diet, which contributes to higher systemic uric acid concentration[Citation49].
Nutrient intakes denoting health-promoting and health-demoting effects
Nutrient intakes differed substantially between diets. Amongst factors regarded as health-promoting [Citation17,Citation51–54], the vegan followed by the vegetarian diet provided the greatest intakes of fiber, vitamins C, E, B6, and B9 (folate), and the lowest intakes of cholesterol and saturated fatty acids. In terms of health-demoting factors [Citation17,Citation25,Citation51–53], the vegan diet provided the lowest intakes of vitamins A, B3 (niacin), B12, and iodine. This suggests a persisting need to monitor nutrient intake in vegans, and provides an opportunity to optimize vegan diet planning with the inclusion of fortified foods and supplements.
Laboratory biomarkers in plasma identify distinct metabolic compartments between diets
Based on the observation of statistically significant differences in nutrient intakes, we set out to examine the impact of such differences on discrete markers of health that are measured routinely in plasma. In the context of having selected comparably young, healthy and physically active individuals to represent each dietary type, we examined whether the source of nutrients, namely, animal-based versus plant-based, had a detectable impact on well-established health-monitoring biomarkers available in routine diagnostic laboratories. Results from multivariate analysis revealed that three major classes of biomarkers contributed the most to the clustering of individuals by dietary group, namely, biomarkers of vitamin B12 status (vitamin B12, holoTC, Hcy), iron (iron, ferritin, transferrin) and lipid metabolism (vitamin A, HDL, LDL, total cholesterol, TAG). This suggests that nutrients that modify the metabolic pathways represented by these biomarkers have the most penetrating effect on health status across diets.
Noteworthy, all dietary groups had intakes of vitamin A below the recommended daily allowance. The use of oral supplements corrected for this lack, leading to adequate plasma vitamin A levels in all participants across diets. Importantly, relationships between vitamin B12 and markers of lipid [Citation55,Citation56] and iron metabolism [Citation57] have been described in independent studies. The molecular mechanisms underlying these associations remains to be investigated. Considering that vegan and vegetarian diets exhibited the most optimal nutrient intakes related to lipid and iron metabolism, vitamin B12 deficiency remains a major vulnerability in plant-based diets. This study also revealed vitamin A intakes were below the recommended DACH guidelines in all diets, and more prominently so in vegans. This was not reflected in the plasma levels of vitamin A, likely due to the use of multivitamin and vitamin A supplements by participants in all diets ().
The use of oral supplements enables an adequate vitamin B12 status in vegans
The vegetarian group had the greatest fraction of participants with suboptimal vitamin B12 status. Omnivores and vegans had a comparable vitamin B12 status, which was primarily sustained by dietary intake in omnivores and by the use of supplements in vegans. Noteworthy, even in the omnivorous group, which had the highest vitamin B12 intake from foods, many individuals failed to meet the current intake recommendations [Citation58]. It is conceivable that vitamin B12 content in present day foods of animal origin is lower than previously estimated. Evidence of a lower B12 content in foods of animal origin is in line with the increasing needs to supplement live-stock with vitamin B12 and other micronutrients [Citation59–61].
Of the four biomarkers of vitamin B12 status, holoTC and B12 were most strongly correlated, whereas MMA and Hcy appeared less sensitive to differences in vitamin B12 status across diets. This result alongside findings from a prior study showing a fast response of holoTC to reduced intake of vitamin B12 in individuals transitioning from an omnivore to an unsupplemented vegan diet [Citation62], suggest that holoTC may be the most sensitive biomarker to monitor vitamin B12 status in healthy individuals who follow plant-based diets.
When considering dietary intake and use of supplements together, vegetarians had the lowest overall consumption of vitamin B12. This suggests that the sourcing of nutrients, i.e. animal- or plant-based, has no overt effect on vitamin B12 assimilation. The cB12-index confirmed an adequate and well supplemented B12 status in vegans, in line with studies by Alexy et al. and Weikert et al. [Citation14,Citation15].
The tendency toward a greater use of oral vitamin B12 supplements in vegans has been also noted in studies with pediatric and adolescent populations [Citation63,Citation64] and in a recent survey in Slovak and Czech vegans [Citation65]. Prior suggestions for B12 intake range from 50 µg/d to 2000 µg/week [Citation66], while our results point at an intake of 250 µg B12/day.
Results from the present study substantiate the recommendation that healthy individuals on plant-based diets can secure an adequate vitamin B12 supply with over-the-counter oral supplements [Citation25]. Furthermore, the presence of so-called anti-nutrients in plant-based diets [Citation67], which are particularly enriched in vegan diets, did not seem to interfere with the absorption and utilization of vitamin B12 taken up as supplements. The poorer vitamin B12 status identified in lacto-ovo-vegetarians could be attributed to an excessive reliance on dairy and eggs as a source of vitamin B12, which warrants further investigation. Despite its importance, there is a lack of international consensus on the dose and frequency of vitamin B12 supplementation required to support B12 status adequacy in healthy adults on plant-based diets. Prior estimates include a daily intake of 50–100 µg/day B12 or 2000 µg per week B12 divided into two doses for healthy vegetarian adults [Citation66,Citation68], a daily dose of 50 µg sublingual B12 for vegans and vegetarians with marginally low plasma B12 [Citation69], a daily intake of 50–150 µg B12 for healthy asymptomatic individuals without malabsorption (no diet specified) [Citation70], or a daily dose of 500 µg/day B12 to treat individuals with vitamin B12 in the low normal range (no diet specified) [Citation42]. Based on the joint consideration of intake, supplement use and plasma biomarkers of B12 status, results from our study suggest that an intake of 250 µg/day B12 supports an adequate status of the micronutrient in individuals on plant-based diets.
Strengths and limitations
We used four-day weighed food diaries, which do not rely on individual memory and recall as foods are recorded at the point of consumption. This method has previously been employed successfully in a study by Kristensen et al. and is considered the gold standard for reliable dietary assessments [Citation27]. Supplement intake was meticulously assessed, screening each supplement individually and recording supplement name, content, dosage and frequency. The study cohort itself was homogeneously healthy, regardless of diet type and due to the rigorously employed in- and exclusion criteria, potential confounders were addressed. Almost 94% of participants were younger than 50 years, which excludes age-related malabsorption as a major confounder in our analysis of vitamin B12 status [Citation37]. This study assessed healthy young adult health-conscious participants, hence, the conclusions that emerge from this work are not directly transferable to other age groups and special physiological conditions, such as neonates, infants, the elderly, pregnant women, and individuals with acquired or inherited disorders that impair the absorption of vitamin B12. Our cohort had a predominance of female participants in all dietary groups, which prevented the analysis of sex-specific effects. We acknowledge the moderate sample size that did not allow further analyses stratified by subgroups, as has been done for at least some parameters in other cross-sectional studies [Citation24]. The cross-sectional nature of this study bears inherent limitations and does not allow for causal interferences.
Conclusion
This study revealed that even amongst homogeneously healthy, highly educated and physically active young Germans, omnivore, lacto-ovo-vegetarian and vegan diets result in measurable differences in dietary intakes and laboratory biomarkers of health. Plant-based diets, in particular the vegan diet, exhibited more favorable patterns of lipid metabolism and glycemic control. Our univariate and multivariate analyses showed that the risk of vitamin B12 deficiency is a major vulnerability in plant-based diets; however, this could be overcome with the use of oral over-the-counter supplements. The detailed examination of supplement use and blood biomarkers provided a first estimation that 250 µg/d oral vitamin B12 taken over the course of 1 year, supports adequate vitamin B12 status in healthy individuals adhering to plant-based diets. The significant lower use of vitamin B12 supplements in lacto-ovo-vegetarians suggests an excessive reliance on dairy and eggs as source of this micronutrient.
Areas for further research
While results from the combined assessment of dietary intake, laboratory biomarkers and supplement use showed that healthy vegans can achieve an adequate vitamin B12 status via the inclusion of oral supplements, the dose and frequency of vitamin B12 needed to supplement the broad spectrum of plant-based diets remains to be determined. This is particularly important for women of child-bearing age, including those following omnivore diets. A previous study showed that regardless of diet, 85% of lactating women categorized as having low breastmilk vitamin B12 had been taken B12 supplements at doses above the recommended daily allowance [Citation71]. As also suggested in an interventional study [Citation72], the recommended daily allowance for vitamin B12 may be currently too low in the general young healthy population, and more so during periods of higher metabolic demand or reduced absorption, as is the case of pregnancy and lactation, and advanced age, respectively.
Authors contributions
M.A.S. conceived, planned, conducted and supervised the clinical trial, analyzed data, acquired funding and wrote the manuscript.
Am performed PBMC isolation and other laboratory work, conducted the study, organized the participant schedule and supported study administration.
L.N. performed PBMC isolation and other study-related laboratory work
A.M.Z-K. performed PBMC isolation and other study-related laboratory work
M.S.A. performed Hcy and MMA measurements, performed univariate data analysis of B12 biomarkers, and multivariate analysis of laboratory biomarkers.
S.K. conceived and planned relevant study-related laboratory work
E.S. performed PBMC isolation and other study-related laboratory work
R.H. conceived, planned and conducted the clinical trial; acquired funding
M.S. was involved in organizational aspects and biosampling
C.P. planned and supervised the statistical analysis of the study and wrote the manuscript.
L.H. conceived and planned the study, supervised the measurement of B12 biomarkers and data analysis, and wrote the manuscript.
All authors read, edited and approved the final version of the manuscript.
Supplemental Material
Download MS Word (61.5 KB)Supplemental Material
Download Zip (239.1 KB)Acknowledgements
The authors are extremely grateful to the study participants for making this study possible. Maximilian A. Storz would like to express his deep gratitude to the Karl und Veronica Carstens-Stiftung in Essen, Germany.
Disclosure statement
Maximilian Andreas Storz and the study were funded by the Karl und Veronika Carstens Foundation in Essen, Germany. The authors are grateful to a research grant of the Federal Ministry of Economics and Technology (BMWi), grant Nr. 03THWBW002 (to L.H.). The funders had no role in the design of the study; in the collection, analyses, or interpretation of data; in the writing of the manuscript; or in the decision to publish the results. Otherwise, the authors declare no conflict of interest. The authors acknowledge partial funding of the article processing charge by the Baden-Wuerttemberg Ministry of Science, Research and Art and the University of Freiburg through the open access publishing funding program.
Data availability statement
Data contained in this manuscript will be made available upon reasonable request.
Correction Statement
This article was originally published with errors, which have now been corrected in the online version. Please see Correction (http://dx.doi.org/10.1080/07853890.2024.2346423)
Additional information
Funding
References
- Storz MA. What makes a plant-based diet? a review of current concepts and proposal for a standardized plant-based dietary intervention checklist. Eur J Clin Nutr. 2022;76(6):1–20. doi: 10.1038/s41430-021-01023-z.
- Craig WJ. Health effects of vegan diets. Am J Clin Nutr. 2009;89(5):1627S–1633S. doi: 10.3945/ajcn.2009.26736N.
- Kent G, Kehoe L, Flynn A, et al. Plant-based diets: a review of the definitions and nutritional role in the adult diet. Proc Nutr Soc;2022;81:62–74. doi: 10.1017/S0029665121003839.
- Satija A, Hu FB. Plant-based diets and cardiovascular health. Trends Cardiovasc Med. 2018;28(7):437–441. doi: 10.1016/j.tcm.2018.02.004.
- Statista. Veganism and vegetarianism worldwide [Internet]. 2023 [cited 2023 Mar 12]. https://www.statista.com/topics/8771/veganism-and-vegetarianism-worldwide/.
- Kaiser J, van Daalen KR, Thayyil A, et al. A systematic review of the association between vegan diets and risk of cardiovascular disease. J Nutr. 2021;151(6):1539–1552. doi: 10.1093/jn/nxab037.
- Qian F, Liu G, Hu FB, et al. Association between plant-based dietary patterns and risk of type 2 diabetes: a systematic review and meta-analysis. JAMA Intern Med. 2019;179(10):1335–1344. doi: 10.1001/jamainternmed.2019.2195.
- Dinu M, Abbate R, Gensini GF, et al. Vegetarian, vegan diets and multiple health outcomes: a systematic review with meta-analysis of observational studies. Crit Rev Food Sci Nutr. 2017;57(17):3640–3649. doi: 10.1080/10408398.2016.1138447.
- Hemler EC, Hu FB. Plant-Based diets for personal, population, and planetary health. Adv Nutr. 2019;10(Suppl_4):S275–S283. doi: 10.1093/advances/nmy117.
- Alcorta A, Porta A, Tárrega A, et al. Foods for plant-based diets: challenges and innovations. Foods. 2021;10(2):293. doi: 10.3390/foods10020293.
- Herrmann W, Schorr H, Obeid R, et al. Vitamin B-12 status, particularly holotranscobalamin II and methylmalonic acid concentrations, and hyperhomocysteinemia in vegetarians. Am J Clin Nutr. 2003;78(1):131–136. doi: 10.1093/ajcn/78.1.131.
- Pawlak R, Parrott SJ, Raj S, et al. How prevalent is vitamin B12 deficiency among vegetarians? Nutr Rev. 2013;71(2):110–117. doi: 10.1111/nure.12001.
- Selinger E, Kühn T, Procházková M, et al. Vitamin B12 deficiency is prevalent among czech vegans who do not use vitamin B12 supplements. Nutrients. 2019;11(12):3019. doi: 10.3390/nu11123019.
- Alexy U, Fischer M, Weder S, et al. Nutrient intake and status of german children and adolescents consuming vegetarian, vegan or omnivore diets: results of the VeChi youth study. Nutrients. 2021;13(5):1707. doi: 10.3390/nu13051707.
- Weikert C, Trefflich I, Menzel J, et al. Vitamin and mineral status in a vegan diet. Dtsch Arztebl Int. 2020;117:575–582.
- Schüpbach R, Wegmüller R, Berguerand C, et al. Micronutrient status and intake in omnivores, vegetarians and vegans in Switzerland. Eur J Nutr. 2017;56(1):283–293. doi: 10.1007/s00394-015-1079-7.
- Bakaloudi DR, Halloran A, Rippin HL, et al. Intake and adequacy of the vegan diet. A systematic review of the evidence. Clin Nutr. 2021;40(5):3503–3521. doi: 10.1016/j.clnu.2020.11.035.
- Neufingerl N, Eilander A. Nutrient intake and status in adults consuming plant-based diets compared to meat-eaters: a systematic review. Nutrients. 2021;14(1):29. doi: 10.3390/nu14010029.
- Dressler J, Storz MA, Müller C, et al. Does a plant-based diet stand out for its favorable composition for heart health? Dietary intake data from a randomized controlled trial. Nutrients. 2022;14(21):4597. doi: 10.3390/nu14214597.
- Plotnikoff GA, Dobberstein L, Raatz S. Nutritional assessment of the symptomatic patient on a plant-based diet: seven key questions. Nutrients. 2023;15(6):1387. doi: 10.3390/nu15061387.
- Bruns A, Mueller M, Schneider I, et al. Application of a modified healthy eating index (HEI-Flex) to compare the diet quality of flexitarians, vegans and omnivores in Germany. Nutrients. 2022;14(15):3038. doi: 10.3390/nu14153038.
- Fuschlberger M, Putz P. Vitamin B12 supplementation and health behavior of Austrian vegans: a cross-sectional online survey. Sci Rep. 2023;13(1):3983. doi: 10.1038/s41598-023-30843-1.
- Nebl J, Schuchardt JP, Wasserfurth P, et al. Characterization, dietary habits and nutritional intake of omnivorous, lacto-ovo vegetarian and vegan runners – a pilot study. BMC Nutr. 2019;5(1):51. doi: 10.1186/s40795-019-0313-8.
- Dawczynski C, Weidauer T, Richert C, et al. Nutrient intake and nutrition status in vegetarians and vegans in comparison to omnivores – the nutritional evaluation (NuEva) study. Front Nutr. 2022;9:819106. doi: 10.3389/fnut.2022.819106.
- Niklewicz A, Smith AD, Smith A, et al. The importance of vitamin B12 for individuals choosing plant-based diets. Eur J Nutr. 2023;62(3):1551–1559. doi: 10.1007/s00394-022-03025-4.
- World Health Organization. A healthy lifestyle – WHO recommendations [Internet]. 2023 [cited 2023 Aug 31]. https://www.who.int/europe/news-room/fact-sheets/item/a-healthy-lifestyle–-who-recommendations.
- Kristensen NB, Madsen ML, Hansen TH, et al. Intake of macro- and micronutrients in danish vegans. Nutr J. 2015;14(1):115. doi: 10.1186/s12937-015-0103-3.
- Willett W. Nutritional epidemiology. Vol. 40. Oxford: Oxford University Press; 2012.
- Hoebel J, Müters S, Kuntz B, et al. Messung des subjektiven sozialen Status in der Gesundheitsforschung mit einer deutschen Version der MacArthur Scale. Robert Koch-Institut, Epidemiologie und Gesundheitsberichterstattung; 2015 [cited 2023 Mar 13]. https://edoc.rki.de/handle/176904/2103.
- Giatti L, Camelo L do V, Rodrigues Jf de C, et al. Reliability of the MacArthur scale of subjective social status – Brazilian longitudinal study of adult health (ELSA-Brasil). BMC Public Health. 2012;12(1):1096. doi: 10.1186/1471-2458-12-1096.
- University © Stanford, Stanford, California 94305. MacArthur scale of subjective social status – Adult Version | SPARQtools [Internet]. 2023 [cited 2023 Mar 13]. https://sparqtools.org/mobility-measure/macarthur-scale-of-subjective-social-status-adult-version/.
- IPAQ [Internet]. 2022 [cited 2023 Mar 13]. https://sites.google.com/view/ipaq/home.
- Craig CL, Marshall AL, Sjöström M, et al. International physical activity questionnaire: 12-country reliability and validity. Med Sci Sports Exerc. 2003;35(8):1381–1395. doi: 10.1249/01.MSS.0000078924.61453.FB.
- Hagströmer M, Oja P, Sjöström M. The international physical activity questionnaire (IPAQ): a study of concurrent and construct validity. Public Health Nutr. 2006;9(6):755–762. doi: 10.1079/phn2005898.
- Hannibal L, Lysne V, Bjørke-Monsen A-L, et al. Biomarkers and algorithms for the diagnosis of vitamin B12 deficiency. Front Mol Biosci. 2016;3:27. doi: 10.3389/fmolb.2016.00027.
- Fedosov SN, Brito A, Miller JW, et al. Combined indicator of vitamin B12 status: modification for missing biomarkers and folate status and recommendations for revised cut-points. Clin Chem Lab Med. 2015;53:1215–1225.
- Green R, Allen LH, Bjørke-Monsen A-L, et al. Vitamin B12 deficiency. Nat Rev Dis Primers. 2017;3(1):17040. doi: 10.1038/nrdp.2017.40.
- Nyamundanda G, Brennan L, Gormley IC. Probabilistic principal component analysis for metabolomic data. BMC Bioinf. 2010;11(1):571. doi: 10.1186/1471-2105-11-571.
- Anderson MJ. Permutational multivariate analysis of variance (PERMANOVA). In: Wiley StatsRef: statistics reference online. Hoboken: John Wiley & Sons, Ltd; 2017. p. 1–15 [cited 2023 Jun 19]. https://doi.org/10.1002/9781118445112.stat07841
- R Core Team. R: a language and environment for statistical computing. Vienna, Austria: R Foundation for Statistical Computing; 2021 [cited 2023 June 20] https://ropensci.org/
- Deutsche Gesellschaft für Ernährung (DGE); Österreichische Gesellschaft für Ernährung (ÖGE); Schweizerische Gesellschaft für Ernährung (SGE). D-A-CH-Referenzwerte für die nährstoffzufuhr. Bonn, Germany: Neuer Umschau Buchverlag; 2018
- Smith AD, Warren MJ, Refsum H. Vitamin B12. Adv Food Nutr Res. 2018;83:215–279.
- Elorinne A-L, Alfthan G, Erlund I, et al. Food and nutrient intake and nutritional status of finnish vegans and non-vegetarians. PLOS One. 2016;11(2):e0148235. doi: 10.1371/journal.pone.0148235.
- Craddock JC, Neale EP, Peoples GE, et al. Vegetarian-based dietary patterns and their relation with inflammatory and immune biomarkers: a systematic review and meta-analysis. Adv Nutr. 2019;10(3):433–451. doi: 10.1093/advances/nmy103.
- Hänninen O, Nenonen M, Ling WH, et al. Effects of eating an uncooked vegetable diet for 1 week. Appetite. 1992;19(3):243–254. doi: 10.1016/0195-6663(92)90165-3.
- Haddad EH, Berk LS, Kettering JD, et al. Dietary intake and biochemical, hematologic, and immune status of vegans compared with nonvegetarians. Am J Clin Nutr. 1999;70(3 Suppl):586S–593S. doi: 10.1093/ajcn/70.3.586s.
- Kjeldsen-Kragh J, Haugen M, Borchgrevink CF, et al. Controlled trial of fasting and one-year vegetarian diet in rheumatoid arthritis. Lancet. 1991;338(8772):899–902. doi: 10.1016/0140-6736(91)91770-u.
- Menni C, Louca P, Berry SE, et al. High intake of vegetables is linked to lower white blood cell profile and the effect is mediated by the gut microbiome. BMC Med. 2021;19(1):37. doi: 10.1186/s12916-021-01913-w.
- Schmidt JA, Crowe FL, Appleby PN, et al. Serum uric acid concentrations in meat eaters, fish eaters, vegetarians and vegans: a cross-sectional analysis in the EPIC-Oxford cohort. PLOS One. 2013;8(2):e56339. doi: 10.1371/journal.pone.0056339.
- Dalbeth N, Palmano K. Effects of dairy intake on hyperuricemia and gout. Curr Rheumatol Rep. 2011;13(2):132–137. doi: 10.1007/s11926-010-0160-8.
- Melina V, Craig W, Levin S. Position of the academy of nutrition and dietetics: vegetarian diets. J Acad Nutr Diet. 2016;116(12):1970–1980. doi: 10.1016/j.jand.2016.09.025.
- Agnoli C, Baroni L, Bertini I, et al. Position paper on vegetarian diets from the working group of the italian society of human nutrition. Nutr Metab Cardiovasc Dis. 2017;27(12):1037–1052. doi: 10.1016/j.numecd.2017.10.020.
- Oussalah A, Rodriguez-Guéant R-M, Alpers DH, et al. Influence des régimes végétariens sur le statut nutritionnel et métabolique et le risque de malades chroniques. Bull Acad Natl Med. 2021;205(1):30–35. doi: 10.1016/j.banm.2020.10.016.
- BDA – The Association of UK Dieticians. Vegetarian, vegan and plant-based diet [Internet]. 2023 [cited 2023 Aug 31]. https://www.bda.uk.com/resource/vegetarian-vegan-plant-based-diet.html.
- Hinkel J, Schmitt J, Wurm M, et al. Elevated plasma vitamin B12 in patients with hepatic glycogen storage diseases. J Clin Med. 2020;9(8):2326. doi: 10.3390/jcm9082326.
- Oussalah A, Levy J, Berthezène C, et al. Health outcomes associated with vegetarian diets: an umbrella review of systematic reviews and meta-analyses. Clin Nutr. 2020;39(11):3283–3307. doi: 10.1016/j.clnu.2020.02.037.
- Green R. Anemias beyond B12 and iron deficiency: the buzz about other B’s, elementary, and nonelementary problems. Hematology Am Soc Hematol Educ Program. 2012;2012(1):492–498. doi: 10.1182/asheducation.V2012.1.492.3800162.
- Ströhle A, Richter M, González-Gross M, et al. The revised D-A-CH-reference values for the intake of vitamin B12: prevention of deficiency and Beyond. Mol Nutr Food Res. 2019;63(6):e1801178. Mar
- Pinchen H, Church S, Strong M, et al. Nutrient content of key cuts of pork in the UK. Nutr Bull. 2020;45(2):165–174. doi: 10.1111/nbu.12432.
- Duplessis M, Gervais R, Lapierre H, et al. Combined biotin, folic acid, and vitamin B12 supplementation given during the transition period to dairy cows: part II. Effects on energy balance and fatty acid composition of colostrum and milk. J Dairy Sci. 2022;105(8):7097–7110. doi: 10.3168/jds.2021-21678.
- Gonzalez-Rivas PA, Chambers M, Liu J. A pilot study comparing the pharmacokinetics of injectable cyanocobalamin and hydroxocobalamin associated with a trace mineral injection in cattle. J Vet Pharmacol Ther. 2021;44(3):406–410. doi: 10.1111/jvp.12967.
- Lederer A-K, Hannibal L, Hettich M, et al. Vitamin B12 status upon short-term intervention with a vegan diet—A randomized controlled trial in healthy participants. Nutrients 2019;11:2815.
- Světnička M, Sigal A, Selinger E, et al. Cross-Sectional study of the prevalence of cobalamin deficiency and vitamin B12 supplementation habits among vegetarian and vegan children in the Czech Republic. Nutrients. 2022;14(3):535. doi: 10.3390/nu14030535.
- Weder S, Keller M, Fischer M, et al. Intake of micronutrients and fatty acids of vegetarian, vegan, and omnivorous children (1–3 years) in Germany (VeChi diet study). Eur J Nutr. 2022;61(3):1507–1520. doi: 10.1007/s00394-021-02753-3.
- Latal R, Habanova M, Selinger E, et al. Cross sectional study of vitamin B12 supplementation in slovak and czech vegans. Rocz Panstw Zakl Hig. 2023;74(2):195–205.
- NutritionFacts.org [Internet]. Updated Vitamin B12 Recommendations Infographic. 2021 [cited 2023 Sep 26]. https://nutritionfacts.org/blog/updated-vitamin-b12-recommendations-infographic/
- Petroski W, Minich DM. Is there such a thing as “anti-nutrients”? A narrative review of perceived problematic plant compounds. Nutrients. 2020;12(10):2929. doi: 10.3390/nu12102929.
- Rizzo G, Laganà AS, Rapisarda AMC, et al. Vitamin B12 among vegetarians: status, assessment and supplementation. Nutrients. 2016;8(12):767. Decdoi: 10.3390/nu8120767.
- Del Bo’ C, Riso P, Gardana C, et al. Effect of two different sublingual dosages of vitamin B12 on cobalamin nutritional status in vegans and vegetarians with a marginal deficiency: a randomized controlled trial. Clin Nutr. 2019;38(2):575–583. doi: 10.1016/j.clnu.2018.02.008.
- Sukumar N, Saravanan P. Investigating vitamin B12 deficiency. BMJ. 2019;365:l1865. doi: 10.1136/bmj.l1865.
- Pawlak R, Vos P, Shahab-Ferdows S, et al. Vitamin B-12 content in breast milk of vegan, vegetarian, and nonvegetarian lactating women in the United States. Am J Clin Nutr. 2018;108(3):525–531. doi: 10.1093/ajcn/nqy104.
- Bor MV, von Castel-Roberts KM, Kauwell GP, et al. Daily intake of 4 to 7 μg dietary vitamin B-12 is associated with steady concentrations of vitamin B-12–related biomarkers in a healthy young population. Am J Clin Nutr. 2010;91(3):571–577. doi: 10.3945/ajcn.2009.28082.