
 ?Mathematical formulae have been encoded as MathML and are displayed in this HTML version using MathJax in order to improve their display. Uncheck the box to turn MathJax off. This feature requires Javascript. Click on a formula to zoom.
Abstract
Objective: To realize the changes in pulmonary hypertension (PH) patients’ right ventricular function.Methods: A total number of 74 patients with PH were included, and the parameters of standard echocardiographic were measured as well as the strain of peak longitudinal of each segment during the systole of the right ventricle to calculate the global longitudinal strain (LS) during systole of the right ventricular free wall.Results: ① As pulmonary arterial pressure increased, the right ventricular area gradually increased, and the case group showed the decreased right ventricular fractional area change (RVFAC), tricuspid annular plane systolic excursion (TAPSE), and tricuspid annular peak systolic velocity (S’) (p < 0.05). They, RVFAC, and TAPSE depicted significant differences that were statistical (p < 0.05) from the other groups. ② With increasing pulmonary arterial pressure, the right ventricular free wall’s LS gradually reduced (p < 0.05).Conclusion: ① LS right ventricular free wall is useful in detecting changes in right ventricular systolic function early on with greater sensitivity than RVFAC, TAPSE, and S’. In addition, increased right ventricular pressure loading can result in a subsequent impairment of right ventricular myocardial mechanics. ② As right ventricular pressure loading increases, right ventricular strain decreases. ③ In mild PH, the right ventricular free wall’s. LS is more sensitive than standard measures in spotting early alterations in myocardial mechanics.
Introduction
The clinical and pathophysiological illness defined by high resistance of the pulmonary and pressure of pulmonary arterial, and it can lead to right heart failure or death is pulmonary hypertension (PH). Changes in the pulmonary vessels’ function, which can be the result of many different disorders, can lead to this condition [Citation1]. Due to its gradual development and non-specific symptoms, PH is typically diagnosed in its intermediate and advanced stages. With limited interventions, the prognosis of PH is poor and is directly associated with the duration of clinical interventions. The reported survival rates for PH are 85% within 3 years, 68% within 5 years, and 49% within 7 years after diagnosis [Citation2]. Despite advances in treatment, there was no improvement in the one-year post-diagnosis survival rate from 2010 to 2019 [Citation3]. In this investigation, we employed ultrasound two-dimensional speckle tracking imaging (2D-STI) used explore the impact of increasing the pressure on the right ventricular loading on right ventricular myocardial mechanics, with the hope of laying the groundwork for early therapeutic management of PH.
1. Materials and methods
1.1. Participants
The study included the PH patients 74 admitted to Shanxi Bethune Hospital between January 2021 and August 2022; their age ranging from 22 to 68 years, with a mean of 52.38 ± 13.62 years, 32 and 42 men and women, respectively. Among them, four cases were idiopathic pulmonary hypertension, 28 cases were connective tissue disease-related pulmonary hypertension, 20 cases were chronic thromboembolic pulmonary hypertension, and 22 cases were interstitial pulmonary hypertension. All of the patients had pulmonary arterial systolic pressure (PASP) values above 40 (PASP > 40) mmHg and LVEF values greater or equal 50% (LVEF) ≥ 50% on transthoracic echocardiography. The 2015 Guidelines for the Diagnosis and Treatment of Pulmonary Hypertension from the European Society of Cardiology and the European Respiratory Society were used to diagnose all patients [Citation1]. Of these, 11 patients were not treated with targeted drugs, 37 with endothelin receptor antagonists, 39 with type-5 phosphodiesterase inhibitors, nine with prostacyclin analogues and four with Leoxin. The following conditions were used to rule out patients: Patients with: ① arrhythmia; ② left heart systemic diseases like cardiac valvular disease, coronary artery disease, and hypertension; ③ structural congenital heart malformations; ④ right ventricular outflow tract obstruction; ⑤ patients whose image quality did not meet study requirements. We recruited 40 healthy volunteers (15 and 25 men and women respectively with the age range of 21–65, with a mean age of 47.45 ± 12.33 years) to serve as the study’s control group. When comparing the two groups by age and gender, there was no discernible difference (p > 0.05).
1.2. Instruments and methods
The images were analysed offline using the QLAB 7.0 quantification software. Echocardiographic images were acquired with the Philips iE33 colour Doppler ultrasound instrument equipped with the S5-1 probe at 2.0–4.0 MHz.
Participants were instructed to maintain regular breathing while lying in the position of left lateral and an electrocardiograph was attached. Using the apical four-chamber view, in order to determine the right ventricular fractional area change (RVFAC), we separately measured end-systolic area (RVESA) and the right ventricular end-diastolic area (RVEDA) due to right ventricular predominance. In this case, RVFAC = (RVEDA-RAESA)/RVEDA > 100%. With an RVFAC < 35%, systolic dysfunction was diagnosed. Tissue Doppler imaging was used to measure echocardiography, and tricuspid annular peak systolic velocity (S’) and M-mode was used to measure tricuspid annular plane systolic excursion (TAPSE). The peak velocity of tricuspid regurgitation was determined using Doppler echocardiography, and PASP was then calculated. Right ventricular systolic pressure (RVSP) is equal to PASP, which is determined using the modified Bernoulli’s formula, without obstructing the outflow tract of the right ventricular and pulmonary valve stenosis. Maximum tricuspid regurgitation velocity (V) equals right ventricular systolic pressure (RVP) plus right atrial pressure (RAP). Here is how we rated the RAP: With the inferior vena cava (IVC) diameter being less than 2.1 centimetres and the inspiratory collapse rate was greater than 50%, the mean RAP was 3 mmHg (0–5 mmHg); when the diameter of IVC > 2.1 centimetres and the inspiratory collapse rate was less than 50%, or when the inspiratory collapse rate was less than 20% during normal breathing, the mean RAP was 8 mmHg (5–10 mmHg) [Citation1]. Based on the PASP scale, patients with PH were classified as either having mild (40–50 mmHg; A), moderate (50–70 mmHg; B), or severe (>70 mmHg; C) disease.
There were at least three cardiac cycles in each loop with a frame rate of more than 70 frames per second caught when the patient was in the end-expiratory hold position. Offline, on a Qlab workstation, we evaluated the captured photos. In order to best depict the heart’s pumping action, the endocardial surface of the right ventricular chamber was carefully traced by hand. Areas of interest were found automatically, and the software reshaped areas that didn’t quite measure up to the right ventricular wall’s thickness. The peak longitudinal strain (LS) during systole of the ventricular wall was recorded for each segment, and the software was run to automatically monitor the myocardial motion in the interested region. The right ventricular LS free wall was calculated through averaging the maximal systolic stresses in the basal, middle, and apical regions of the apical four-chamber heart.
1.3. Statistical analysis
Statistical analysis was employed through SPSS 16.0, whose results were presented as the mean ± standard deviation (). When the study’s quantitative data followed a normal distribution with homogeneous variance, researchers employed the independent sample t-test in comparing the two groups, the analysis of one-way variance was used to compare the groups that are more than two. When comparing two groups, we utilized the t-test for the least significant difference. In order to compare metrics that did not have a normal distribution or homogeneous variance, non-parametric tests were used. Chi-square analysis was used to compare count data. The analysis of the consistency of the results was conducted through the use of Bland–Altman plots. The cutoff was p < 0.05 for statistical implication.
2. Results
2.1. Comparisons of basic data
Right heart catheter data in pulmonary hypertension group: mPAP= (47.08 ± 9.84)mmHg,PAWP= (10.16 ± 2.99)mmHg,PVR=(9.86 ± 3.93)Wood unit(1Wood = 80 dyn▪s▪cm−5). With increasing pulmonary arterial pressure, patients in groups A, B, and C demonstrated an increasing tendency in rates of the heart (p < 0.05 or p < 0.01). Besides, in demographics there were no substantial changes () including LVEF, gender, systolic blood pressure, age and diastolic blood pressure (p > 0.05).
Table 1. Comparison of General information ( ± s).
2.2. Comparison of conventional right ventricle parameters
As pulmonary arterial pressure increased, the right ventricular area was enhanced gradually, while RVFAC, TAPSE, and S’ were reduced gradually among groups of A, B, and C (p < 0.05).
Pairwise comparisons among the control, the groups of A, B, and C indicated statistically substantial changes (p < 0.05) (), but RVFAC, TAPSE, and S’ did not exhibit a substantial variance statistically amongst the A and groups of control (p > 0.05).
Table 2. Comparison of common right heart echocardiographic parameters ( ± s).
2.3. Comparison of LS parameters in the right ventricle
There was a significant statistical decrease in right ventricular free wall LS as pulmonary arterial pressure rose (p < 0.05). displays the results of pairwise comparisons of global and segmental LS between the control, A, B, and C groups, showing that while the difference was not statistically significant in the LS of the apical segment amongst A and control groups, the variances were substantial statistically in the LS of the remaining segments.
Table 3. Comparison of longitudinal strain parameters in the right ventricle ( ± s).
2.4. Repeatability studies
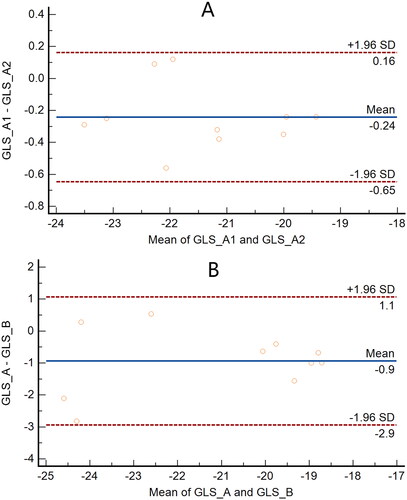
displays the findings of a Bland–Altman analysis, which show that the global LS of the right ventricle is highly reproducible both within and across observers.
Figure 1. A: the diagram of Intra-observer consistency analysis; B: Inter-observer consistency analysis diagram.
3. Discussion
PH lacks specific clinical signs and has an insidious onset, which is usually triggered by exertion and appears as fatigue, dyspnoea, chest discomfort, and syncope. Some patients also have a dry cough, exercise-induced nausea and vomiting, and severe right heart failure. Pulmonary artery rupture or dissection can result from severe pulmonary arterial dilatation [Citation4]. The timing of diagnosis and the initial symptoms of PH are related to the prognosis, and the PH diagnostic strategy emphasizes that early detection and treatment may improve the prognosis [Citation5]. Nonetheless, conventional echocardiography is insufficient for making an early clinical diagnosis of PH. Notably, the STI approach is relatively sensitive in detecting early alterations in myocardial mechanics, which can serve as a foundation for early clinical diagnosis and treatment of PH.
Clinical signs of right ventricular dysfunction, including oedema in the ankles, lower extremities, abdomen, and full body, may appear in patients with advancing PH. Myocardium and myocytes in the right ventricle undergo subtle but steady morphological and functional alterations due to chronic PH. Right ventricular cavity enlargement occurs as the thickness of the wall of the right ventricular gradually rises in reply to increased pressure loading on the right ventricle. Meanwhile, the right ventricle is eccentrically rebuilt, with spherical shape, resulting in right heart failure [Citation6,Citation7]. Since the subendocardial longitudinal myocardium controls right ventricular motion, systole in the right ventricle is accomplished mostly through longitudinal contraction [Citation8,Citation9]. Research suggests that longitudinal motion accounts for 80% of the volume of a right ventricular stroke [Citation10]. Systolic function of the right ventricle is reflected in TAPSE and tricuspid annulus velocities. The systolic function of the right ventricle can be inferred from a measurement obtained through the use of STI of the strain of longitudinal in the right ventricular free wall. Findings of the study indicated that the right atrium, right ventricular cavity, and right ventricular wall of patients with PH grew in size and thickness as right ventricular pressure loading increased. Consistent with prior research, the moderate and severe pulmonary PH groups had considerably lower RVFAC, TAPSE, and S’ than the control group, demonstrating that the systolic function of the right ventricular was impaired in PH patients [Citation11,Citation12]. In this study, although conventional echocardiographic there was no significant different among the mild PH and control groups, the LS of the right ventricular free wall was lower in the mild PH group, a recent investigation confirmed that [Citation13]. This finding proves that the LS of the right ventricle is more sensitive than traditional ultrasonography parameters, allowing for the detection of changes in the myocardial mechanics of the right ventricle that occur at an earlier stage in response to increasing pressure loading on the right ventricle.
In this study, there are a number of caveats: (i) the small sample size may reduce the power of the study and limit the universality of the results. Therefore, this is a hypothesis-generating pilot study rather than definitive research; (ii) include patients with PH from a variety of reasons may confound the results. Currently, there are five types of pulmonary arterial hypertension based on different causes, including pulmonary arterial hypertension (PAH), pulmonary hypertension due to left heart disease, pulmonary hypertension due to lung disease and/or hypoxia, pulmonary hypertension due to obstructive pulmonary artery disease, and pulmonary hypertension due to unknown factors. The results may be influenced by the fact that the baseline right heart function and structure may be different in patients with different aetiologies; (iii) there is no information available about how long the patients in the case group were followed; (iv) the study is a single-centre study, which may affect the generalizability of the findings to a broader patient population; (v) there are manufacturer-specific differences in strain measurements, leading to the potential challenges in applying the findings of this study to clinical practice.
Conclusion
Increased right ventricular pressure loading can impact right ventricular myocardial mechanics, and the LS of the right ventricular free wall is more susceptible to early changes in right ventricular systolic function than the RVFAC, TAPSE, or S’. The right ventricular strain decreases gradually with the increase of the right ventricular pressure load; When comparing the LS of the right ventricular free wall to more traditional metrics, the LS of the right ventricular free wall is more sensitive to detecting early alterations of the mechanics of the patients with right with mild PH.
Authors’ contributions
Chun-song Kang and Zhi-fen Wang conceptualized and designed the research, at the same time, they reviewed and revised the manuscript. Zhi-fen Wang drafted the initial manuscript. Hui-zhan Li, Ji-ping Xue and Ting-hua Feng collected the data. Li-li Su,Hui-zhan Li, Ji-ping Xue and Shuai Li analysed and explained the data. Li-li Su,Shuai Li and Ting-hua Feng analysed the data. All authors read and approved the final draft.
Ethics approval and consent to participate
This study was approved by the Medical Ethical Committee of Shanxi Bethune Hospital(Shanxi Academy of Medical Sciences).(SBQLL-2021-008). A written informed consent was obtained from all participants.
| Abbreviations | ||
| GLS | = | Global longitudinal strain |
| LAT | = | Lateral wall |
| LS | = | Longitudinal strain |
| PASP | = | Pulmonary arterial systolic pressure |
| PH | = | Pulmonary hypertension |
| RAP | = | Right atrial pressure |
| RV | = | Right ventricle/ventricular |
| RVEDA | = | Right ventricular end-diastolic area |
| RVESA | = | Right ventricular end-systolic area |
| RVFAC | = | Right ventricular fractional area change |
| RVSP | = | Right ventricular systolic pressure |
| STI | = | Speckle tracking imaging |
| TAPSE | = | Tricuspid annular plane systolic excursion |
Acknowledgements
We are particularly grateful to all the people who have given us help on our article.
Disclosure statement
All authors have made significant contributions to the manuscript and declare that the work is original and has not been submitted or published elsewhere. No author has any financial disclosures or conflicts of interest.
Availability of data and materials
The datasets used and analysed during the current study available from the corresponding author on reasonable request.
Additional information
Funding
References
- Galie N, Humbert M, Vachiery JL, et al. 2015 ESC/ERS guidelines for the diagnosis and treatment of pulmonary hypertension: the joint task force for the diagnosis and treatment of pulmonary hypertension of the European society of cardiology(ESC) and the European respiratory society (ERS): endorsed by: association for European paediatric and congenital cardiology (AEPC), international society for heart and lung transplantation (ISHLT). Eur Heart J. 2016;37(1):1–6. doi: 10.1093/eurheartj/ehv317.
- Benza RL, Miller DP, Gomberg-Maitland M, et al. Predicting survival in pulmonary arterial hypertension: insights from the registry to evaluate early and long-term pulmonary arterial hypertension disease management (REVEAL). Circulation. 2010;122(2):164–172. doi: 10.1161/circulationaha.109.898122.
- Hoeper MM, Pausch C, Grünig E, et al. Temporal trends in pulmonary arterial hypertension: results from the COMPERA registry. Eur Respir J. 2022;59(6):2102024. doi: 10.1183/13993003.02024-2021.
- Corrêa Rde A, Silva LC, Rezende CJ, et al. Pulmonary hypertension and pulmonary artery dissection. J Bras Pneumol. 2013;39(2):238–241. doi: 10.1590/s1806-37132013000200016.
- Maron BA, Abman SH, Elliott CG, et al. Pulmonary arterial hypertension: diagnosis, treatment, and novel advances. Am J Respir Crit Care Med. 2021;203(12):1472–1487. doi: 10.1164/rccm.202012-4317SO.
- Bronicki RA, Baden HP. Pathophysiology of right ventricular failure in pulmonary hypertension. Pediatr Crit Care Med. 2010;11(2 Suppl):S15–S22. doi: 10.1097/PCC.0b013e3181c7671c.
- von Siebenthal C, Aubert JD, Mitsakis P, et al. Pulmonary hypertension and indicators of right ventricular function. Front Med (Lausanne). 2016; 3:3:23. doi: 10.3389/fmed.2016.00023.
- Leather HA, Ama’ R, Missant C, et al. Longitudinal but not circumferential deformation reflects global contractile function in the right ventricle with open pericardium. Am J Physiol Heart Circ Physiol. 2006;290(6):H2369–H2375. doi: 10.1152/ajpheart.01211.2004.
- Haddad F, Hunt SA, Rosenthal DN, et al. Right ventricular function in cardiovascular disease, part I: anatomy, physiology, aging, and functional assessment of the right ventricle. Circulation. 2008; 117(11):1436–1448. doi: 10.1161/CIRCULATIONAHA.107.653576.
- Carlsson M, Ugander M, Heiberg E, et al. The quantitative relationship between longitudinal and radial function in left, right, and total heart pumping in humans. Am J Physiol Heart Circ Physiol. 2007;293(1):H636–44. doi: 10.1152/ajpheart.01376.2006.
- Vitarelli A, Mangieri E, Terzano C, et al. Three-dimensional echocardiography and 2D-3D speckle-tracking imaging in chronic pulmonary hypertension: diagnostic accuracy in detecting hemodynamic signs of right ventricular (RV) failure. J Am Heart Assoc. 2015;4(3):e001584. doi: 10.1161/JAHA.114.001584.
- Focardi M, Cameli M, Carbone SF, et al. Traditional and innovative echocardiographic parameters for the analysis of right ventricular performance in comparison with cardiac magnetic resonance. Eur Heart J Cardiovasc Imaging. 2015; 16(1):47–52. doi: 10.1093/ehjci/jeu156.
- Scherptong RW, Mollema SA, Blom NA, et al. Right ventricular peak systolic longitudinal strain is a sensitive marker for right ventricular deterioration in adult patients with tetralogy of fallot. Int J Cardiovasc Imaging. 2009; 25(7):669–676. doi: 10.1007/s10554-009-9477-7.