
Abstract
Background: Tuberculosis (TB) and malnutrition are major global health problems, with multidrug-resistant (MDR) TB complicating international efforts. The role of vitamin D in susceptibility to and as an adjunctive treatment for TB is being studied extensively, although no study has included MDR-TB patients in context to dietary profile with vitamin D levels and sunlight exposure.
Objective: This study aimed to estimate vitamin D serum levels and examine their association with dietary intake of vitamin D and sun exposure in patients with MDR-TB.
Methods: North Indian participants were enrolled in three groups: MDR-TB, drug-susceptible pulmonary TB (DS-PTB), and healthy controls. All consenting participants underwent the estimation of macro- and micronutrient intake and sunlight exposure using structured questionnaires. Serum biochemistry, including 25-hydroxyvitamin D and calcium levels, was measured, and the correlation between variables was determined.
Results: 747 participants were enrolled. Significant differences among the three groups were found in mean serum 25-hydroxyvitamin D levels, body mass index, macronutrient intake, dietary vitamin D and calcium content, and sun exposure index (SEI). All except sun exposure (SEI was highest in DS-PTB patients) were found to follow the trend: MDR-TB < DS-PTB < healthy controls. The mean serum vitamin D levels of all groups were deficient and correlated positively with dietary intake and SEI.
Conclusion: In this study’s we found significant association of serum vitamin D concentrations, dietary intake and sunlight exposure in MDR-TB, DS-PTB patients and healthy controls. Dietary intake may be more important than sun exposure in determining serum levels. However, the significance of this finding is uncertain. Further studies are required to confirm the association, direction, and potential for vitamin D supplementation to treat or prevent MDR-TB infection.
Introduction
Malnutrition and tuberculosis (TB) remain major problems in developing countries [Citation1]. The current annual incidence of TB globally is 8.8 million, with India accounting for 1.8 million [Citation2,Citation3]. TB is caused by Mycobacterium tuberculosis and primarily results in pulmonary infections. Among the various factors, nutrition plays a major role in susceptibility of TB, especially in developing countries such as India. It has been observed that due to low adherence to anti-tuberculosis treatment (ATT) and malnutrition, drug susceptible tuberculosis may be converted to multi-drug resistant (MDR) TB, often the most clinically severe and deadly form of the disease [Citation4]. Although recent studies showed strong association of vitamin D levels between MDR-TB patients and household contact [Citation5–7].
Malnutrition has been shown to adversely affect cell-mediated immunity, which is the key host defense mechanism against TB [Citation1]. There is evidence that at the time of diagnosis, patients with active TB often have depressed blood/serum concentrations of several micronutrients, including vitamins A, C, and E, hemoglobin, zinc, iron, and selenium, compared with healthy controls [Citation8]. Deficient dietary protein intake, hypoproteinaemia and hypoalbuminemia have also been demonstrated to have multiple detrimental effects on host resistance to TB, including macrophage dysfunction [Citation9].
Vitamin D, an immunomodulatory hormone, regulates calcium physiology and has been used as an anti-TB therapy in the form of cod liver oil [Citation10]. Vitamin D can be obtained from the diet and by the action of sunlight on the skin. Exposure of the skin to the UVB (290-315 nm) rays of sunlight induces the photolytic conversion of 7-dehydrocholesterol to previtamin D3 [Citation11]. The first step in the metabolic activation of vitamin D is hydroxylation of carbon 25, which occurs primarily in the liver. The second step in vitamin D bioactivation, the formation of 1, 25(OH)2 D from 25-(OH)2 D, occurs under physiological conditions, mainly in the kidney [Citation12] although diet al.so plays an important role, with deficiency demonstrated in patients with both lack of sunlight exposure [Citation13] and suboptimal dietary intake [Citation14]. Recently, studies have been undertaken to study vitamin D in terms of its deficiency [Citation15–18], its use as adjunctive therapy [Citation19,Citation20], and polymorphisms of the vitamin D receptor gene [Citation21–23], in individuals with active TB.
Several studies have demonstrated micronutrient deficiencies in active TB disease through the measurement of serum levels [Citation10,Citation13,Citation15]; however, to our knowledge, no study has reported an estimation of their dietary intake in MDR-TB patients. Therefore, the present study was designed to determine the correlation between serum vitamin D levels and calcium with dietary intake and sun exposure in MDR-TB patients in comparison with drug-susceptible pulmonary TB (DS-PTB) patients and healthy controls.
Methods
Study design and population
This prospective cross-sectional comparative study was conducted at the All-India Institute of Medical Sciences (AIIMS) hospital, a busy tertiary center providing services to much of northern, central, and eastern India, and the Rajan Babu Institute of Pulmonary Medicine and Tuberculosis (RBIPMT), a large MDR-TB center with inpatient and outpatient facilities, both in New Delhi, India. Newly diagnosed MDR pulmonary TB cases admitted to the RBIPMT hospital and drug-susceptible pulmonary TB patients at the AIIMS DOTS (directly observed therapy, short-course) Center, aged 18–65 years between 2006 and 2011, were consecutively screened for recruitment. All patients had a positive sputum smear (Ziehl-Neelsen method). All MDR and DS-PTB cases were confirmed by culture (Lowenstein-Jensen medium) and conventional drug susceptibility testing. Patients with liver impairment; diabetes mellitus; chronic cardiac, renal, or gastrointestinal diseases (including history suggestive of malabsorption); those infected with HIV; and pregnant and lactating mothers were excluded in the study.
Healthy controls participants was recruited from the general population with the same socioeconomic status and ethnic background as that of the patients. All were screened negative for personal and family history of TB. In addition, these individuals had undergone a tuberculin skin test, those with negative tuberculin skin tests (< 10 mm induration with 5 tuberculin units) were enrolled. In addition, they had normal serum biochemistry, liver function, complete blood count, and body mass index (BMI) ≥ 19. Participants with history of alcohol or drug abuse, or symptoms suggestive of malabsorption, and pregnant or breastfeeding mothers were excluded in this study. Participant who had taken any vitamin D or calcium supplements within one year before recruitment were also excluded from the study and control groups. Written informed consent was obtained from all the participants. The study protocol was approved by the AIIMS institutional ethics committee (Ref no.: A-08/5.5.2008).
Sample size was calculated by considering mean difference value of DS-PTB and control group over the parameter of 25 (OH)D found as 5.9 as per reference article (Rathored J et al.; Int J Tuberc Lung Dis, 2012) and estimated standard deviation of 20 with desired power of 0.80 and alpha error of 0.05 minimum sample size required as 181 per group.
Dietary and nutritional assessment
Nutritional status was assessed by use of a semi quantitative food-frequency questionnaire [Citation17,Citation24], and the average composition of the daily diet in terms of macronutrients and various micronutrients was estimated with the help of the software DietSoft® v1.1.9 [Invincible IDeAS, Noida, India, 2008-9; obtained a copyright license and done by Senior Dietician], which contains nutritional content approximations for various food items, as provided by the Indian Council of Medical Research and National Institute of Nutrition, India. Nutrient information on packed food products and the United States Department of Agriculture nutritive value for vitamin D were incorporated into the software before use [Citation25,Citation26]. Participants were weighed without shoes using digital weighing scales (Model HD-2006A1, Thiruvananthapuram, Kerala, India) with zero error, and height was measured using a stadiometer (Standard steel 214 CM Portable Plastic Stadiometer, Model: HM01 Ambala Cantt, Ambala, Haryana, India) with a 0.1 cm error to calculate BMI. All participants were assessed for malnourishment using the WHO classification based on BMI [Citation27,Citation28].
Vitamin D, calcium and parathyroid hormone levels
Immunoassays were performed in duplicate to monitor the precision of the analytical technique. A 5-10 ml blood sample was drawn in red-top tube (plain vial) from the study participants after overnight fasting without venostasis. Serum was separated in a refrigerated centrifuge (Thermofisher Scientific, Model no: multifuge X1R; Serial No: 41162997) at 2500 × g for 5 min at 4 °C and stored at −80 °C in multiple aliquots until analysis. Serum 25-hydroxyvitamin D concentrations were estimated using the Diasorin® 25-hydroxyvitamin D radioimmunoassay (RIA) (normal range:9–37.6 ng/mL) as per Goswami et al. 2000; Vupputuri et al. 2006) [Citation16,Citation29], which involves a two-step procedure. The first step involves the extraction of 25-hydroxyvitamin D from serum with acetonitrile, followed by processing according to the manufacturer’s instructions [Citation29] The detailed process is explained in Annexure 1 (Supplementary File). Serum ionised calcium was estimated with a Carelyte Electrolyte Analyser (Carewell Biotech Pvt Ltd, New Delhi, India) using an ion selective electrode method (PH- range 6.5–8.5 nmol/L.Resolution-0.01 nmol/L, CV- <1%). Samples for serum were stored at 4 °C immediately after sampling and separated from cells within 1 h and specific precaution was taken to avoid the inclusion of any air bubbles which will destroy the ionised calcium. Similarly, serum total calcium was estimated using a Hitachi Modular (Roche Diagnostics GmbH, Mannheim, Germany) using the o-cresolphthalein complexone method. Serum iPTH was measured using a radioimmunoassay (RIA; Diasorin®, Stillwater, MN, USA; reference interval:13–54 pg/mL; intra-assay and inter-assay coefficients of variation:4% and 8%, respectively).
Sunlight exposure assessment
Information regarding sun exposure was gathered via a structured questionnaire that estimated the weekly average duration of sunlight exposure, sunscreen use, and usual outdoor attire. The rule of nines was adapted to estimate the weekly body surface area (BSA) exposed to sunlight by each participant. Therefore, the sun exposure index (SEI) was calculated as the product of hours of sun exposure per week and BSA exposure to sunlight. New Delhi is at latitude 28.35° N and longitude 77.12° E, with a zenith angle of 84.5° in peak summer and 38.5° in peak winter (Meteorology Department, Delhi). The ground surface of Delhi receives 4 minimal erythemal doses (MEDs) of ultraviolet radiation per day during the summer and 1 MED/day in the winter [Citation17].
Statistical analysis
Quantitative variables like age, BMI and various biochemical parameters were compared among the three groups of participants using one-way analysis of variance (ANOVA) followed by Bonferroni correction for multiple comparisons. Odds ratios for PTB Cat I and MDR-TB association with each group were calculated using logistic regression. Data, unless otherwise stated, are presented as mean ± standard deviation (SD). Univariate logistic regression and stepwise multiple logistic regression with removal probability (pr) 0.1 and additional probability (pe) 0.5 were taken to find the odds ratio and adjusted odds ratio respectively in each group for occurring severe vitamin D deficiency due to risk factor. If normal and abnormal cut-off of the risk factor is not available then median/mean label of the deficient population was taken as a cut-off value. Spearman’s rho correlation coefficient test was used for correlation analysis. All analyses were performed using STATA version 11.0 (Stata Corporation, College Station, TX, USA). A two-sided p-value of less than 0.05 was considered statistically significant.
Results
A total of 354 MDR-TB patients, 188 DS-PTB patients, and 205 healthy controls were enrolled. All patients in the DS-PTB group underwent full demographic, dietary, and sun exposure assessments; however, only 60 were available for serum biochemistry testing, drug sensitivity testing, and TB severity grading. The baseline sputum smears bacillary load, culture results, and chest radiograph severity grading are shown in .
Table 1. Smear and culture status and disease severity in patients with MDR-TB and DS-PTB.
Physical and lifestyle parameters
The mean age, BMI, estimated nutrient intake, sunlight exposure, and serum levels of 25-hydroxyvitamin D for each group (MDR-TB, DS-PTB, and healthy controls) are compared in . The mean BMI of MDR-TB patients was significantly lower than that of DS-PTB patients and healthy controls (p < 0.001). The mean BMI of healthy controls was in the normal range, DS-PTB patients were mildly underweight, and MDR-TB patients were severely underweight, according to the WHO classification of BMI [Citation28]. Sun exposure in hours per week and sun exposure index were significantly different between groups (p < 0.001), with DS-PTB patients having a significantly higher mean for both, and the other two groups having similar, lower means. No significant difference was found among the three groups in terms of BSA exposed to sunlight (p = 0.17).
Table 2. Demographic details and comparison of daily nutrient intake and weekly sunlight exposure in MDR-TB and DS-PTB patients with healthy controls.
Dietary profile
Mean daily dietary intake of macronutrients was significantly different, including protein (p < 0.001), carbohydrate (p < 0.001), fat (p < 0.001), and total energy (p < 0.001). These levels were significantly lower in MDR-TB patients than in DS-PTB patients, which in turn were lower than those in the healthy controls (). The mean daily dietary intake of macronutrients in healthy controls was within normal limits according to the Indian normative data published by the Indian Council of Medical Research (ICMR) [Citation32].
Significant differences in dietary calcium intake were found among the MDR-TB, DS-PTB, and healthy control groups (p < 0.001; ). Calcium intake was deficient in the MDR-TB and DS-PTB groups, whereas it was sufficient in healthy controls according to the recommended daily intake for Indians given by the ICMR [Citation32]. The mean intake of dietary vitamin D was insufficient for all groups according to the dietary reference intake of vitamin D [Citation33]. A significant association between serum calcium and phytate, and serum calcium and fiber were observed in all groups.
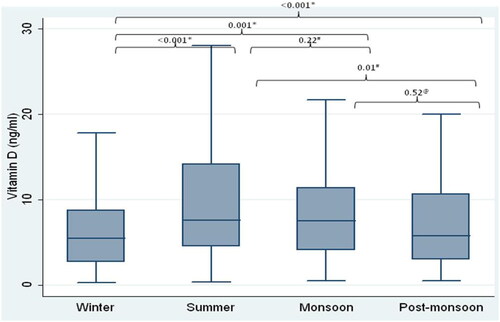
Seasonal variations in patients with MDR-PTB, PTB Cat I are compared with healthy controls and are shown in . The overall comparison of serum 25(OH)D by seasons (p < 0.001) are shown in . Winter levels were significantly lower as compared to summer (p < 0.001), monsoon (p = 0.001), and post-monsoon levels were significantly lower than summer (p = 0.01) whereas, all other comparisons revealed no significant difference, i.e. winter vs post monsoon (p = 0.46), summer vs monsoon (p = 0.22) and monsoon vs post-monsoon (p = 0.05).
Figure 1. Comparison of serum vitamin D levels during seasonal variations among different study groups. Box plot showing median (line), interquartile range (boxes), and 25% to 75% percentile (whiskers): HC, healthy controls; MDR, multi-drug resistant tuberculosis, PTB Cat I, pulmonary tuberculosis Category I; Seasons (Winter-December, January, Febuary; Summer-March, April and May; Monsoon- June, July, August and September; Post Monsoon- October, November.
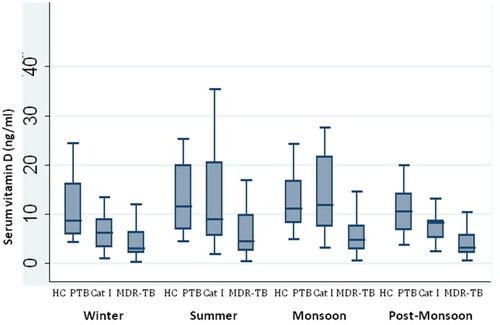
Figure 2. Overall comparison of serum vitamin D levels by seasons. Box plot showing median (line), interquartile range (boxes), and 25% to 75% percentile (whiskers); Seasons (Winter-December, January, Febuary; Summer-March, April and May; Monsoon- June, July, August and September; Post Monsoon- October, November) *p-value as compared to winter; #p-value as compared to Summer; @p-value monsoon vs post monsoon; Statistical method- Kruskal-Wallis Test (p < 0.05)and multiple comparision by Wilcoxon ranksum with Bonferroni correction (p < 0.08) were considered statistically significant.
Biochemical profile
The mean values of total serum protein, albumin, calcium, serum ionized calcium, iPTH, and 25-hydroxyvitamin D values for MDR-TB, DS-PTB, and healthy controls are summarized in . Significant differences were found in serum total protein (p < 0.001), serum ionized calcium (p < 0.001), total serum calcium (p < 0.001), serum iPTH (p < 0.001), and serum 25-hydroxyvitamin D (p < 0.001) levels, whereas no significant difference was found in serum albumin (p = 0.6) levels among the three groups. Total serum protein was significantly lower in MDR-TB patients than in the DS-PTB and healthy control groups (both groups were within normal limits). As per the serum 25-hydroxyvitamin D estimation, the mean in MDR-TB and DS-PTB reflected severe hypovitaminosis D, while the mean value of healthy controls was labelled as moderate hypovitaminosis D according to the study done by Goswami et al. in 2000 and 2008 respectively [Citation16,Citation17].
Table 3. Baseline biochemical parameters of study groups.
Dietary vitamin D intake showed a positive correlation () with serum calcium (total, ionized, and corrected; all p < 0.001), dietary calcium (p < 0.001), and serum 25-hydroxyvitamin D (p < 0.001), and a negative correlation with serum iPTH (p = 0.009). Serum 25-hydroxyvitamin D levels were positively correlated () with total, corrected, and ionized serum calcium levels (p < 0.001) and SEI (p = 0.02). A univariate logistic regression () and step wise multiple logistic regression with removal probability (pr) 0.1 and additional probability (pe) 0.5 were taken to find the odds ratio and adjusted odds ratio respectively in each group for occurring severe vitamin D due to risk factor. If normal and abnormal cut-off of the risk factor is not available then median/mean label of the deficient population were taken as a cut-off value (). Some of these factors were interrelated such as diet vitamin D, iPTH and number of hours per week, therefore, these variables were not considered in the multivariable analysis though they showed significant associations in the univariate analysis (). However, a positive correlation between serum vitamin D with dietary vitamin D levels were found in (MDR-TB, r = 0.27, p = <0.001) PTB Cat I patients (r = 0.28, p = 0.04) and healthy controls (r = 0.18, p = 0.009) and globally, a positive significant correlation was found among the groups (r = 0.47, p = <0.001 global) ().
Figure 3. Correlation of serum vitamin D levels with dietary vitamin D in MDR-TB, PTB Cat I and healthy controls. Scatter plot are shown between dietary vitamin D (μg/d) in X-axis and serum vitamin D levels (ng/ml)) in Y axis with correlation ccoefficient (r) and significance of correlation (p).
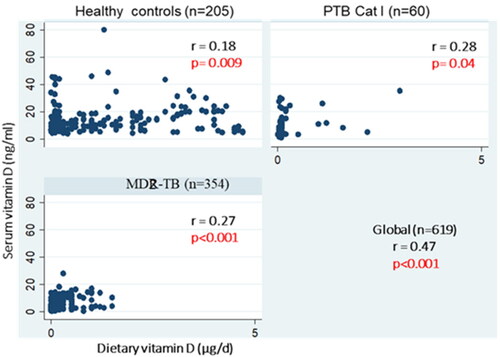
Table 4. Correlation of dietary vitamin D with other parameters in MDR-TB, DS-PTB and healthy controls.
Table 5. Correlation of serum vitamin D with other parameters in all three groups.
Table 6. Association of study parameters with severe vitamin D deficiency in patients and healthy controls (univariate analysis).
Table 7. Association of diet calcium and sun exposure with severe vitamin D deficiency in study participants (multivariate analysis).
Discussion
The multi-drug-resistant TB patients in this novel study had significantly lower mean serum 25-hydroxyvitamin D levels than individuals with drug-susceptible TB, whose serum levels were significantly lower than those of healthy controls (p < 0.001). The latter difference between patients with DS-PTB and healthy controls has been documented in several studies, including a recent meta-analysis [Citation15], but the finding of even lower levels in MDR-TB is supported by recent studies [Citation5–7] investigating this association. The means of all groups were consistent with the definition of hypovitaminosis D [Citation34] despite abundant sunlight exposure, as shown in previous studies [Citation16,Citation17]. Though abundant sunlight is present throughout the year in many parts of the world, vitamin D deficiency is a widespread problem. For vitamin D synthesis, the body is dependent on sunlight and food as vitamin D is naturally available in foods predominantly of animal origin. In India fortification with vitamin D is not done on a large scale and most of the Indian population is vegetarian so principally they are dependent on sunlight for vitamin D synthesis. This is in turn dependent on diverse factors like skin type, solar zenith angle and minimal erythemal dose [Citation35]. For an adequate synthesis of vitamin D, specific types of human skin help determine the time necessary to spend in sunlight. Indian studies have documented that Indian skin type belongs to category V which requires more time (30 min to 45 min) spent in sunshine [Citation35,Citation36]. The solar zenith angle, which predicts the absorption of UVB rays and can dramatically influence the cutaeneous synthesis of vitamin D, is dependent on latitude, time of day and season [Citation37] Along with this, outdoor attire and usage of sunscreen affects UV exposure [Citation11] The UVB rays absorption depends on the time spent in sunlight and body surface area (BSA) exposed, but the same is fewer according to Indian common attire [Citation36,Citation37] Therefore both reduced sun exposure and dietary intake of vitamin D are suggested as causes behind widespread vitamin D deficiency in India.
Dietary intake of vitamin D, as estimated by the dietician-administered questionnaire, was significantly lower in the MDR patients than in the DS-PTB group, and in turn, the drug susceptible patients’ intake was lower than that of the control group (p < 0.001). This may explain the similar trend in serum vitamin D levels, backed by a positive correlation between the two values in all three groups (; r = 0.3; p < 0.001). Some studies observed seasonal variations in vitamin D levels. They found significantly lower vitamin D levels in autumn than in winter [Citation38]). Another study observed the lowest serum 25(OH)D concentration was in winter, and the highest was in summer [Citation39] which supports the present study () whereas, Aldrees et al. found no significant seasonal variations observed in vitamin D levels [Citation40] similar to all other comparisons in present study revealed no significant difference i.e. winter vs post monsoon, summer vs monsoon and monsoon vs post-monsoon () However, the dietary phytate intake followed the same pattern (MDR-TB < DS-PTB < healthy controls; p < 0.001). Phytate is known to reduce serum vitamin D levels, which may confound the effect of dietary vitamin D on serum concentrations, making the scenario more complex [Citation41,Citation42]. Poor vitamin D intake has been previously shown in drug-susceptible patients, although opinion is divided on the importance of this factor in determining serum levels [Citation14,Citation16,Citation17]. The estimated vitamin D intake in healthy controls was lower than the American recommendations for adults [Citation33] (no vitamin D intake recommendations are given in Indian guidelines), but statistically higher than the other two groups (p < 0.001). This may reflect that, as in many Asian countries, India has low rates of food product fortification with vitamin D [Citation25].
MDR-TB patients had significantly higher mean serum iPTH concentrations than the other two groups (p < 0.001), in line with the significantly lower serum calcium and vitamin D levels. This seems to reflect normal physiological responses. Hypercalcemia in pulmonary tuberculosis is due to excessive extra-renal 1-alpha hydroxylase activity and calcium homeostasis is maintained by hormones that regulate calcium transport in the gut, kidneys, and bone. Some studies have reported hypocalcemia as a major biochemical finding in tuberculosis patients. For example, a study found that newly diagnosed tuberculosis patients had a decreased mean serum calcium level of 9.06 ± 0.96 mg/dl. [Citation43,Citation44], and another study found that 25% of pulmonary TB patients had hypercalcemia. [Citation45]
The sun exposure index was higher in DS-PTB patients than in the MDR-TB and healthy control groups (p < 0.001). This correlated positively with serum 25-hydroxyvitamin D levels (; r = 0.08; p = 0.02), although the higher exposure in DS-PTB patients than in healthy controls indicating that diet may be a stronger determinant of lower serum levels in non-drug resistant TB [Citation16].
A gross difference was found in the macro-nutritional status of MDR-TB patients compared with DS-PTB and healthy controls. MDR-TB patients had significantly lower BMI than DS-PTB patients and healthy controls, with the DS-PTB patients’ mean being lower than that of healthy controls (p < 0.001). Healthy controls had sufficient energy, protein, carbohydrate, fat, and calcium intake with regard to ICMR recommendations, while the diseased groups had significantly lower intake of all of these (p < 0.001) [Citation32]. This is consistent with previous studies [Citation8,Citation9]. It was known that when we don’t eat enough of these nutrients, our bodies cannot perform at their best and results in poor immunity which in turns have susceptibility to infections. In this study, we found the dietary intake of nutrients as well as vitamin D is not sufficient in disease group as compared to healthy control based on this finding a balanced diet al.ong with the use of products fortified with vitamin D, would be recommended.
As per RDA recommendation in 1989 [Citation46], in case of minimum sunlight exposure, a daily vitamin D supplement required is 100 IU which increased to 200 IU and 400 IU in 2006 and 2010 [Citation47] The data of present study also suggest that sunlight exposure alone is not enough to maintain normal vitamin D and serum calcium level in blood. So, in order to maintain the normal homoeostasis dietary vitamin D and calcium intake should be increased besides the sun light exposure which plays an important role in absorption of calcium in the body which positive influence in mediating T cell counterattack on infection. [Citation48]
The major finding of this study is that serum 25-hydroxyvitamin D levels in patients with multi-drug-resistant TB are significantly lower than those in drug-susceptible TB patients, who, in turn, have lower serum vitamin D levels than healthy controls. Although there is uncertainty, it has been suggested recently that the evidence is in favor of low vitamin D levels predisposing to TB, and not TB itself, causing depletion of the vitamin [Citation15]. It is possible that vitamin D deficiency could predispose to the development of multidrug resistance in drug-susceptible TB, although the potential mechanism for this is unclear. However, it is well known that ATT can itself cause vitamin D depletion [Citation15]. As the Indian TB program stipulates, patients are not routinely tested for drug resistance unless they fail standard ATT; therefore, all the MDR-TB patients recruited had previous partial or full courses of ATT. This may have contributed to the observed lower serum levels in this group, as well as the loss of appetite induced by ATT drugs, leading to reduced macro- and micronutrient intake.
It must be emphasized that the mean 25-hydroxyvitamin D level for each group was within the hypovitaminosis D category. which is widely described in healthy Indian groups [Citation16–18, Citation21, Citation25]. In light of this, interpretation must be of the impact of the degree of deficiency, as opposed to the simple presence of deficiency, which is more complicated. The study from Greenland suggested that both high and low serum vitamin D concentrations predispose patients to active TB [Citation49]. As there were significantly lower estimated amounts of energy, macronutrients, and minerals such as calcium and phosphorus in the diets of MDR-TB patients, it is also possible that severe vitamin D deficiency and MDR-TB are separate unrelated effects of overall poor nutrition, which is well described [Citation1,Citation4,Citation8].
This study suggests that diet may be a more significant factor than sun exposure in determining the above trend in serum vitamin D concentrations, although both factors displayed a significant positive correlation with serum levels, sun exposure was not consistent when the groups were compared with each other; drug-susceptible patients had a higher mean sun exposure index than the other groups, but had a significantly lower mean serum 25-hyrdroxyvitamin D level than healthy controls. MDR-TB patients had the lowest dietary vitamin D intake, but a similarly low sun exposure index to healthy controls, which may imply a combined effect of both factors, and possibly that diet is more important. In previous studies, opinions on the relative importance of each variable have been divided [Citation13–15].
To our knowledge, this study is the first to examine dietary and serum vitamin D and calcium levels, exposure to sunlight, and levels of other micronutrients and macronutrients in patients with MDR-TB. Furthermore, these parameters have been measured in drug-susceptible pulmonary TB patients and healthy controls, providing opportunities for comparison in two dimensions, that is, with those suffering from TB but without baseline multidrug resistance, and those without active TB. The comprehensive dietary history and biochemical profile enabled a detailed comparison of the groups to identify the potential reasons for the observed differences. The sample size was relatively large compared to that of previous studies, especially with regard to the dietary profile.
In addition, in our previous study, genotypic frequencies of VDR gene polymorphisms FokI and BsmI were found to differ significantly among the MDR-TB, PTB Cat I and healthy control groups. The genotype Bb showed inverse relationship with MDR-TB, Ff correlated positively with MDR-TB, and ff was highly positively related to both MDR-TB and PTB Cat I patients. Significant allelic differences were also found, with the mutant t allele of TaqI being significantly more common in MDR-TB patients; and the f allele of FokI being of significantly higher frequency in both MDR-TB and PTB Cat I disease groups. No significant difference in genotypic distribution of TaqI or allelic frequencies of BsmI was demonstrated. [Citation50]
One limitation of this study was the small number of drug-susceptible TB patients who underwent serum biochemical analysis compared to the other two groups. In addition, the cross-sectional nature of the study means that firm conclusions regarding the directionality of any association are difficult to make. In addition, the time of year was not strictly controlled when vitamin D levels were measured, which can be a confounding factor because of seasonal variability depending on sunlight intensity in non-equatorial areas.
Another limitation is that the patients and healthy controls were not actively matched in terms of diet, sun exposure or other variables which may affect vitamin D levels. This may be an issue due to the ubiquitous nature of the VDR, which regulates cell proliferation and differentiation; calcium absorption from the gut, kidneys and bone; and may also influence androgen and oestrogen activation; which means that potential gene-gene and/or gene-environment interactions would be more prone to affecting serum levels [Citation19]
In conclusion, this study demonstrated lower baseline serum vitamin D concentrations in North Indian MDR-TB patients than in untreated drug-susceptible TB patients and healthy controls. Detailed dietary and sun exposure analyses have suggested that poor dietary intake may be more important than variations in sunlight exposure. The cross-sectional nature of the study and lack of previous description of the importance of vitamin D in MDR-TB means that any firm conclusions about causality, direction, and certainty of the association are difficult to make. However, there seems to be potential for vitamin D supplementation as adjunctive therapy in non-drug resistant TB [Citation19,Citation20]; therefore, further work is required to confirm this association and the potential impact of vitamin D therapy in the treatment and/or prevention of the increasing worldwide problem of multi-drug-resistant TB.
Authors’ contributions
Jaishriram Rathored: conceptualization, methodology, data collection, visualization, investigation, and writing of original draft and editing; Surendra Kumar Sharma: study supervision and review of the original draft and gave his expert advice during the study tenure. Aarti Chauhan: dietary and nutritional assessment. Bhagteshwar Singh: helps in writing the original draft and reviewing Jayant Nagesh Banavaliker: helps in providing the samples and reviewing the original draft; V Sreenivas: helps in statistical analysis; Abhay Krishna Srivastava: helps in biochemical investigation and reviewing the original draft. All authors have reviewed and approved the final draft of the manuscript.
Supplemental Material
Download MS Word (12.6 KB)Acknowledgements
We thank all study participants and staff of the Department of Medicine, AIIMS, and RBIPMT, New Delhi, for enabling the study to run smoothly.
Disclosure statement
No potential conflict of interest was reported by the author(s).
Data availability statement
The data that support the findings of this study are available from the corresponding author, [Dr Jaishriram Rathored], upon reasonable request.
Additional information
Funding
References
- Gupta KB, Gupta R, Atreja A, et al. Tuberculosis and nutrition. Lung India. 2009;26(1):1–13. doi: 10.4103/0970-2113.45198.
- World Health Organization. Global tuberculosis control 2022. Geneva: World Health Organization; 2022.
- Central TB Division, Directorate General of Health Services, Ministry of Health and Family Welfare. TB India 2010: RNTCP status report. New Delhi: ministry of Health and Family Welfare; 2010.
- Atre SR, Mistry NF. Multidrug-resistant tuberculosis (MDR-TB) in India: an attempt to link biosocial determinants. J Public Health Policy. 2005; 26(1):96–114. doi: 10.1057/palgrave.jphp.3200014.
- Herlina N, Sinaga BYM, Siagian P, et al. Serum vitamin d level and susceptibility to multidrug-resistant tuberculosis among household contacts. IOP Conf Ser: earth Environ Sci. 2018;125:012143. doi: 10.1088/1755-1315/125/1/012143.
- Herlina N, Sinaga BYM, Siagian P, et al. Association between vitamin D levels with mdr-Tb patients with household contacts and healthy people as comparison. Proceedings of Malikussaleh International Conference on Health and Disaster Medicine. 2022;1:65–75. doi: 10.29103/micohedmed.v1i1.20.
- Shukla A, Bromage S, Dholakia Y, et al. Case-control study of vitamin D status and adult multidrug-resistant pulmonary TB. Int J Tuberc Lung Dis. 2022;26(9):826–834. doi: 10.5588/ijtld.21.0639.
- Papathakis P, Piwoz E. Academy for educational development. Nutrition and tuberculosis: a review of the literature and consideration for TB control programs. USA: Academy for Educational Development; 2008.
- Roberts T, Herselman M, Marais D, et al. Served versus actual nutrient intake of hospitalised patients with tuberculosis as compared with energy and nutrient requirements. South Afr J ClinNutr. 2005;18(2):78–93. doi: 10.1080/16070658.2005.11734043.
- Davies PD, Brown RC, Woodhead JS. Serum concentrations of vitamin D metabolites in untreated tuberculosis. Thorax. 1985; 40(3):187–190. doi: 10.1136/thx.40.3.187.
- Holick MF. Sunlight ‘D’ilemma: risk of skin cancer or bone disease and muscle weakness. Lancet. 2001; 357(9249):4–6. doi: 10.1016/S0140-6736(00)03560-1.
- Rosen CJ. Clinical practice. Vitamin D insufficiency. N Engl J Med. 2011; 364(3):248–254. doi: 10.1056/NEJMcp1009570.
- Sita-Lumsden A, Lapthorn G, Swaminathan R, et al. Reactivation of tuberculosis and vitamin D deficiency: the contribution of diet and exposure to sunlight. Thorax. 2007;62(11):1003–1007. doi: 10.1136/thx.2006.070060.
- Bose K, Bisai JS, Mukhopadhyay S, et al. M. Comparison of nutritional status between tuberculosis patients and controls: a study from North 24 Parganas District in West Bengal. India. Mal J Nutr. 2007;13(2):131–139.
- Nnoaham KE, Clarke A. Low serum vitamin D levels and tuberculosis: a systematic review and meta-analysis. Int J Epidemiol. 2008; 37(1):113–119. doi: 10.1093/ije/dym247.
- Goswami R, Kochupillai N, Gupta N, et al. Presence of 25(OH) D deficiency in a rural North Indian village despite abundant sunshine. J Assoc Physicians India. 2008;56:755–757.
- Goswami R, Gupta N, Goswami D, et al. Prevalence and significance of low 25-hydroxyvitamin D concentrations in healthy subjects in Delhi. Am J Clin Nutr. 2000;72(2):472–475. doi: 10.1093/ajcn/72.2.472.
- Harinarayan CV, Ramalakshmi T, Prasad UV, et al. High prevalence of low dietary calcium, high phytate consumption, and vitamin D deficiency in healthy South Indians. Am J Clin Nutr. 2007;85(4):1062–1067. doi: 10.1093/ajcn/85.4.1062.
- Wejse C, Gomes VF, Rabna P, et al. Vitamin D as supplementary treatment for tuberculosis: a double-blind, randomized, placebo-controlled trial. Am J Respir Crit Care Med. 2009;179(9):843–850. doi: 10.1164/rccm.200804-567OC.
- Martineau AR, Timms PM, Bothamley GH, et al. High-dose vitamin D3 during intensive phase treatment of pulmonary tuberculosis: a double-blind randomised controlled trial. Lancet. 2011;377(9761):242–250. doi: 10.1016/S0140-6736(10)61889-2.
- Wilkinson RJ, Llewelyn M, Toossi Z, et al. Influence of vitamin D deficiency and vitamin D receptor polymorphisms on tuberculosis among Gujarati Asians in west London: a case-control study. Lancet. 2000;355(9204):618–621. doi: 10.1016/S0140-6736(99)02301-6.
- Bornman L, Campbell SJ, Fielding K, et al. Vitamin D receptor polymorphisms and susceptibility to tuberculosis in West Africa: a case-control and family study. J Infect Dis. 2004;190(9):1631–1641. doi: 10.1086/424462.
- Lombard Z, Dalton D-L, Venter PA, et al. Association of HLA-DR, -DQ, and vitamin D receptor alleles and haplotypes with tuberculosis in the Venda of South Africa. Hum Immunol. 2006;67(8):643–654. doi: 10.1016/j.humimm.2006.04.008.
- Sudha V, Radhika G, Sathya RM, et al. Reproducibility and validity of an interviewer-administered semi-quantitative food frequency questionnaire to assess dietary intake of urban adults in Southern India. Int J Food Sci Nutr. 2006;57(7-8):481–493. doi: 10.1080/09637480600969220.
- Puri S, Marwaha RK, Agarwal N, et al. Vitamin D status of apparently healthy schoolgirls from two different socioeconomic strata in Delhi: relation to nutrition and lifestyle. Br J Nutr. 2008;99(4):876–882. doi: 10.1017/S0007114507831758.
- Yetley EA. Assessing the vitamin D status of the US population. Am J Clin Nutr. 2008;88(2):558S–564S. doi: 10.1093/ajcn/88.2.558S.
- World Health Organization. Physical status: the use and interpretation of anthropometry. Report of a WHO Expert Committee. World Health Organ Tech Rep Ser. 1995;854:1–452.
- WHO Expert Consultation. Appropriate body-mass index for Asian populations and its implications for policy and intervention strategies. Lancet. 2004;363(9403):157–163. doi: 10.1016/S0140-6736(03)15268-3.
- Vupputuri MR, Goswami R, Gupta N, et al. Prevalence and functional significance of 25-hydroxyvitamin D deficiency and vitamin D receptor gene polymorphisms in Asian Indians. Am J Clin Nutr. 2006;83(6):1411–1419. doi: 10.1093/ajcn/83.6.1411.
- World Health Organization. Laboratory services in tuberculosis control part II: microscopy. Italy: World Health Organization; 1999.
- National Tuberculosis Association of the USA. Diagnostic standards and classification of tuberculosis. New York: National Tuberculosis Association; 1961.
- Gopalan C, Sastri B, Balasubramaniam, editors. Nutritive value of Indian foods. Hyderabad, India: National Institute of Nutrition, Indian Council of Medical Research; 1996.
- Ross A. Institute of medicine (U. S.). DRI, dietary reference intakes: calcium, vitamin D. Washington D.C.: National Academies Press; 2011.
- Lips P. Vitamin D deficiency and secondary hyperparathyroidism in the elderly: consequences for bone loss and fractures and therapeutic implications. Endocr Rev. 2001;22(4):477–501. doi: 10.1210/edrv.22.4.0437.
- Harinarayan CV, Joshi SR. Vitamin D status in India-its implications and remedial measures. J Assoc Physicians India. 2009;57:40–48.
- Sahu M, Bhatia V, Aggarwal A, et al. Vitamin D deficiency in rural girls and pregnant women despite abundant sunshine in Northern India. Clin Endocrinol. 2009;70(5):680–684. doi: 10.1111/j.1365-2265.2008.03360.x.
- Holick MF. Vitamin D: a millenium perspective. J Cell Biochem. 2003;88(2):296–307. doi: 10.1002/jcb.10338.
- Nowak J, Hudzik B, Jagielski P, et al. Lack of seasonal variations in vitamin D concentrations among hospitalized elderly patients. Int J Environ Res Public Health. 2021;18(4):1676. doi: 10.3390/ijerph18041676.
- Sistani SS, Moghtaderi A, Dashipoor AR, et al. Seasonal variations of 25-OH vitamin D serum levels in multiple sclerosis patients with relapse using MRI. Eur J Transl Myol. 2019;29(3):8361. doi: 10.4081/ejtm.2019.8361.
- Aldrees T, Alohali S, Albosaily A, et al. Seasonal variations in serum levels of vitamin D and other biochemical markers among KSA patients prior to thyroid surgery. J Taibah Univ Med Sci. 2020;15(6):522–528. Sep 22 doi: 10.1016/j.jtumed.2020.08.006.
- Mellanby E. An experimental investigation of rickets. Nutr Rev. 1976;34(11):338–340. doi: 10.1111/j.1753-4887.1976.tb05815.x.
- Clements MR. The problem of rickets in UK Asians. J Human Nutrition Diet. 1989;2(2):105–116. doi: 10.1111/j.1365-277X.1989.tb00015.x.
- Rohini K, Bhat S, Srikumar PS, et al. Assessment of serum calcium and phosphorus in pulmonary tuberculosis patients before, during and after chemotherapy. Indian J Clin Biochem. 2014;29(3):377–381. doi: 10.1007/s12291-013-0383-3.
- Okogun G, Jemikalajah J, Ogbebor O. Total serum calcium and inorganic phosphate levels in tuberculosis patients in Benin City, Nigeria. Sierra Leone J Biomed Res. 2011; 2(2):2. doi: 10.4314/sljbr.v2i2.63997.
- Rajendra A, Mishra AK, Francis NR, et al. Severe hypercalcemia in a patient with pulmonary tuberculosis. J Family Med Prim Care. 2016;5(2):509–511. doi: 10.4103/2249-4863.192327.
- National Research Council (NRC). Food and Nutrition Board recommended dietary allowances. 10th ed. Washington (DC): National Academy Press; 1989. pp. 82. https://www.scirp.org/reference/referencespapers?referenceid=2589479
- ICMR_RDA_BOOK_2010.pdf. [Internet]. [cited 2023 Nov 20]. Available from: https://www.enacnetwork.com/files/pdf/ICMR_RDA_BOOK_2010.pdf.
- Ganmaa D, Uyanga B, Zhou X, et al. Vitamin D supplements for prevention of tuberculosis infection and disease. N Engl J Med. 2020;383(4):359–368. doi: 10.1056/NEJMoa1915176.
- Nielsen NO, Skifte T, Andersson M, et al. Both high and low serum vitamin D concentrations are associated with tuberculosis: a case-control study in Greenland. Br J Nutr. 2010;104(10):1487–1491. doi: 10.1017/S0007114510002333.
- Rathored J, Sharma SK, Singh B, et al. Risk and outcome of multidrug-resistant tuberculosis: vitamin D receptor polymorphisms and serum 25(OH)D. Int J Tuberc Lung Dis. 2012;16(11):1522–1528. Nov doi: 10.5588/ijtld.12.0122.