
Abstract
Background
A growing number of studies show that people with similar blood glucose levels have different levels of glycosylated haemoglobin (HbA1c), and relying only on HbA1c may lead to clinical decision-making errors. The haemoglobin glycation index (HGI) quantifies the difference in HbA1c among individuals and is strongly linked to the risk of cardiovascular disease. However, the connection between this phenomenon and the poor outcomes of patients with acute decompensated heart failure (ADHF) is currently unknown.
Patients and Methods
This retrospective, single-centre-based cohort study included 1531 hospitalized patients with ADHF from September 2010 to January 2020. The HGI is calculated from the difference between the observed and predicted HbA1c values [predicted HbA1c = 0.024 × fasting plasma glucose (FPG) (mg/dL)+3.1]. The endpoints examined in the study included all-cause death, cardiovascular (CV) death, and major adverse cardiac events (MACE). We fitted multivariable-adjusted Cox proportional hazard models to investigate the association between the HGI and clinical outcomes.
Results
During the five-year follow-up, 427 (27.9%) patients died from all causes, 232 (15.6%) from CV death, and 848 (55.4%) from MACE. The restricted cubic spline analysis also showed that the cumulative risk of all-cause and CV deaths decreased linearly with increasing HGI. According to multivariate Cox proportional hazard models, the highest tertile of the HGI was associated with a lower incidence of all-cause and cardiovascular deaths [all-cause death, adjusted hazard ratio (HR): 0.720, 95% confidence interval (CI): 0.563–0.921, p = 0.009; CV death, adjusted HR: 0.619, 95% CI: 0.445–0.861, p = 0.004]. A 1% increase in the HGI was associated with a 12.5% reduction in the risk of all-cause death and a 20.8% reduction in the risk of CV death.
Conclusions
A high HGI was directly associated with a reduction in all-cause and CV deaths but was not associated with MACE. These findings may be helpful in the management of patients with ADHF.
KEY MESSAGES
Recent studies have demonstrated that significant discrepancies between HbA1c and actual blood glucose levels may lead to clinical decision-making errors.
The inconsistency of previous research results suggests that the HGI may have different predictive ability in populations with different diseases.
Introduction
Glycosylated haemoglobin (HbA1c) is an established means of monitoring average blood glucose levels and a surrogate marker of the effect of glucose control [Citation1]. HbA1c is not only used for the diagnosis and treatment of diabetes but also plays an important role in the individualized management of patients with heart failure (HF) [Citation2]. Individuals with HF and diabetes have worse cardiac function and higher cardiovascular mortality and hospitalization risk than individuals without diabetes [Citation3]. In addition, high HbA1c is related to high mortalities in nondiabetic patients with an LVEF ≤ 45% [Citation4]. In chronic HF complicated with type 2 diabetes, the relationship between HbA1c and mortality is U-shaped, and the risk is the lowest in patients with modest blood glucose control (HbA1c 7.1 ∼ 8.0%) [Citation5]. Interestingly, Eshaghian et al. reported that an increase in the HbA1c level was related to an improvement in the survival of patients with advanced HF complicated with diabetes [Citation6]. While the conclusions of previous studies on the relationship between HbA1c and HF are not entirely consistent, it is undeniable that reasonable control of blood glucose and HbA1c is quite important for patients with HF.
In the past few years, however, questions have been raised about the use of HbA1c as an unassailable yardstick. Previous studies have shown significant differences in HbA1c levels between individuals with similar glucose profiles, limiting the use of HbA1c as a one-size-fits-all measure [Citation7,Citation8]. A number of factors, such as race, age, genetic variation, red blood cell lifespan, iron deficiency, and anaemia, contribute to the mismatch between HbA1c and blood glucose levels [Citation9–13]. Therefore, the haemoglobin glycation index (HGI) was first proposed by Hempe et al. in 2002 to quantify individual differences in HbA1c levels. For any individual in the study population, the HGI was defined as the difference between the observed value of HbA1c and the predicted value [predicted HbA1c from fasting plasma glucose (FPG) concentration] [Citation14].
Nonetheless, the association between the HGI and the incidence of adverse cardiovascular events has been inconsistent across patient cohorts. Previous studies have reported that a high HGI is negatively associated with the incidence of myocardial infarction in patients with prior cardiovascular disease but is directly associated with an increased risk of coronary artery calcification in non-diabetic patients [Citation15,Citation16]. Furthermore, a recent study showed that both a low and high HGI were associated with poorer prognosis in diabetic patients with ischemic stroke than in those with a moderate HGI [Citation17]. Moreover, the predictive value of the HGI for outcomes in patients with acute decompensated heart failure (ADHF) has not yet been elucidated. Hence, we performed a retrospective cohort study to clarify the relationship between the HGI and clinical prognosis in patients with ADHF.
Methods
Study population
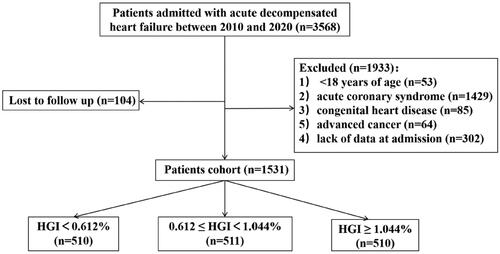
This was a single-centre retrospective cohort study. Patients with ADHF were enrolled in the present study between September 2010 and January 2020 in the Cardiology Department of Nanjing Drum Tower Hospital, the Affiliated Hospital of Nanjing University Medical School. The exclusion criteria were as follows: (1) <18 years of age, (2) acute coronary syndrome, (3) congenital heart disease, (4) advanced cancer, (5) lack of data at admission and (6) loss to follow-up. A total of 3568 patients with ADHF were hospitalized, and 2037 patients were excluded for different reasons. Consequently, 1531 patients were eligible for the current study ().
Figure 1. Flow diagram of the study cohort. HGI: haemoglobin glycation index.
This retrospective study was performed in accordance with the Declaration of Helsinki and was approved by the ethics committee of Nanjing Drum Tower Hospital.
Data collection and definitions
The baseline data included demographic information, medical history, laboratory test results, echocardiogram data, and medication information; these data were collected by experienced physicians from the hospital’s medical records system. The demographic information in the present study included age, sex, smoking status, systolic blood pressure, diastolic blood pressure, heart rate and body mass index (BMI). Medical history information, including diabetes, hypertension, hyperlipidaemia, valvular heart disease, atrial fibrillation, prior myocardial infarction, and prior stroke, was ascertained by standardized interrogation.
Laboratory data, including HbA1c, FPG, B-type natriuretic peptide (BNP), blood potassium, blood sodium, creatinine, uric acid, estimated glomerular filtration rate (eGFR), triglyceride, total cholesterol, high-density lipoprotein-cholesterol (HDL-C), low-density lipoprotein-cholesterol (LDL-C), C-reactive protein (CRP), albumin, apolipoprotein AI (ApoAI), apolipoprotein B (ApoB), alanine aminotransferase (ALT), aspartate aminotransferase (AST), white blood cell count (WBC), platelet count (PLT), haemoglobin, haematocrit and red blood cell distribution width (RDW), were obtained from the first group of peripheral venous blood samples after admission. The echocardiographic data included the left ventricular ejection fraction (LVEF). Medication was based on the guidelines for the management of HF and included statins, beta-blockers, angiotensin-converting enzyme inhibitors (ACEIs)/angiotensin receptor inhibitors (ARBs), angiotensin receptor neprilysin inhibitors (ARNIs), antiplatelet agents, anticoagulants, spironolactone, diuretics, digitalis, sodium-glucose contraporter-2 inhibitors (SGLT2is), insulin, and metformin.
HGI calculation and grouping
We used the reference population regression equation [predicted HbA1c = 0.024 × FPG (mg/dL) +3.1] to calculate the HGI (%). Population data from this linear regression equation were obtained from the U.S. National Health and Nutrition Examination Survey (NHANES) conducted between 2005 and 2016. This survey is known for its abundant high-quality data and easy accessibility. In 2021, Hemper et al. validated this linear regression equation for application in a demographically diverse population [Citation18]. Three subgroups were established based on HGI tertiles: tertile 1 (T1), HGI < 0.612%; tertile 2 (T2), 0.612%≤HGI < 1.044%; and tertile 3 (T3), HGI ≥ 1.044%.
Endpoints and follow-up
This study defined three predefined endpoints: all-cause death, cardiovascular (CV) death, and major adverse cardiac events (MACE). All-cause death was considered either CV death or non-CV death. CV death included death due to myocardial infarction, stroke, congestive heart failure, malignant arrhythmia, or other cardiac diseases. MACE were defined as nonfatal myocardial infarction, nonfatal stroke, or worsening of HF, including both ischemic and haemorrhagic strokes.
Patients were followed up by telephone and/or clinic visits every six months by well-trained doctors.
Statistical analysis
Continuous variables are presented as the mean ± standard deviation (SD) for normally distributed data and median (interquartile range [IQR]) for skewed data. Categorical variables are expressed as percentages. To compare continuous variables among the three groups, we used analysis of variance (ANOVA) or the Kruskal–Wallis test. For categorical variables, we employed the χ2 test or Fisher’s exact test. Kaplan–Meier plots and log-rank tests were used to conduct survival analysis. Moreover, adjusted Kaplan–Meier survival curves were plotted with the nonparametric estimated weight method to rule out confounding factors [Citation19]. To evaluate the relationship between the HGI and the incidence of clinical outcomes, we constructed multivariate Cox proportional hazards models using HGI as both a categorical and continuous variable. Schoenfeld residuals were used to validate the assumptions of proportional hazards before conducting the subsequent analysis. To assess the hazard ratio (HR) of the HGI, three nested models were established. Model 1 was adjusted for age, sex, hypertension status, diabetes status, atrial fibrillation status, prior myocardial infarction status, stroke status and BMI; Model 2 was adjusted for the variables included in Model 1 plus systolic blood pressure, diastolic blood pressure, heart rate, LVEF, BNP, haemoglobin, CRP and HDL-C; and Model 3 was adjusted for the variables included in Model 2 plus beta-blockers, ACEIs/ARBs and spironolactone use. When the HGI was analysed as a categorical variable, the tertile 1 group was used as the reference. In addition, the aim of conducting restricted cubic spline analysis was to determine the relationship between the HGI score as a continuous variable and clinical outcomes.
We also performed subgroup analyses, including age (<70 years versus ≥70 years), sex (male versus female), smoking status (no versus yes), LVEF (<40% versus ≥40%), eGFR (<60 ml/min versus ≥60 ml/min), prior myocardial infarction (no versus yes), diabetes status (no versus yes) and hypertension status (no versus yes), in this study. Interactions between the subgroups were tested using likelihood ratio tests.
All the data were analysed using R version 4.2.1 and SPSS for Windows version 27. p < 0.05 was considered to indicate statistical significance.
Results
Baseline characteristics of the study cohort
The baseline patient characteristics are presented in . The median age of the participants was 74 years, and 42.7% were female. The tertile 3 group was older and had a greater prevalence of diabetes and prior myocardial infarction. No differences were found among the three groups in terms of sex or prevalence of hypertension. BNP and HbA1c levels, as well as the proportion of patients treated with statins and digitalis utility, were significantly greater in the tertile 3 group. Notably, the percentage of patients taking ARNIs and SGLT2is in the cohort was rather low, largely because these two drugs were introduced to our centres after September 2019.
Table 1. Baseline characteristics by HGI group.
Relationship between the HGI and the endpoints
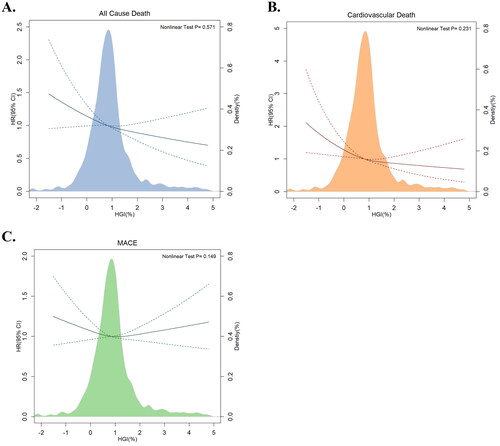
Restricted cubic splines overlapping with density plots were depicted to illustrate the association between the HGI and clinical outcomes (). All-cause death and CV death both exhibited an inverse linear relationship with HGI (p for nonlinear test > 0.05). However, the restricted cubic spline for MACE was approximately horizontal, which implied that the HGI was not associated with the risk of MACE.
Figure 2. Multivariable-adjusted hazard ratios for (A) all-cause death, (B) cardiovascular death and (C) MACE based on restricted cubic spines and density plots for HGI. The solid and dotted lines represent hazard ratios and 95% confidence intervals, respectively. The coloured areas represent the distribution of the HGI in the study cohort. The model was adjusted for age, sex, hypertension status, diabetes status, atrial fibrillation status, prior infarction and stroke status, BMI, systolic blood pressure, diastolic blood pressure, heart rate, LVEF, BNP, haemoglobin, CRP, HDL-C, beta-blockers, ACEIs/ARBs, and spironolactone use. CI: confidence interval; HGI: haemoglobin glycation index; HR: hazard ratio; MACE: major adverse cardiac events.
During the follow-up period, all-cause death occurred in 427 (27.9%) patients, CV death occurred in 232 (15.6%) patients, and MACE occurred in 848 (55.4%) patients. A total of 144 (28.2%) patients died from any cause in the tertile 1 group, 150 (29.4%) patients died in the tertile 2 group, and 133 (26.1%) patients died in the tertile 3 group. Among the patients who died from CV, 84 (17.1%) died in the tertile 1 group, 78 (15.6%) died in the tertile 2 group, and 70 (14.1%) died in the tertile 3 group. Patients with MACE included 259 (50.8%) patients in the tertile 1 group, 283 (55.4%) patients in the tertile 2 group and 306 (60.0%) patients in the tertile 3 group.
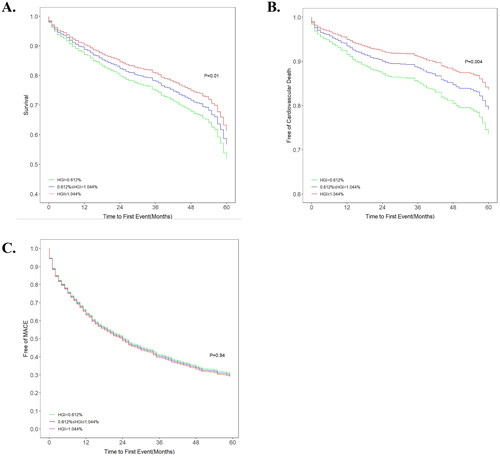
The unadjusted Kaplan–Meier plots demonstrated no significant differences among tertiles in all-cause death or MACE, whereas CV death was significantly different among tertiles. Notably, the curves of tertile 1 and 2 were entered into the Kaplan–Meier plot of CV death incidence (). The adjusted Kaplan–Meier plot showed that there were significant differences among the tertile groups of HGI in terms of both all-cause death and CV death after adjustment for confounding variables (). The curves of the three groups were markedly different, and the all-cause death and CV death rates increased significantly from tertile 1 to tertile 3. For MACE, there was no significant difference among the three groups despite adjustment for various confounders.
Figure 3. Kaplan–Meier plots of (A) all-cause death, (B) cardiovascular death and (C) MACE in the study cohort. HGI: haemoglobin glycation index; MACE: major adverse cardiac events.
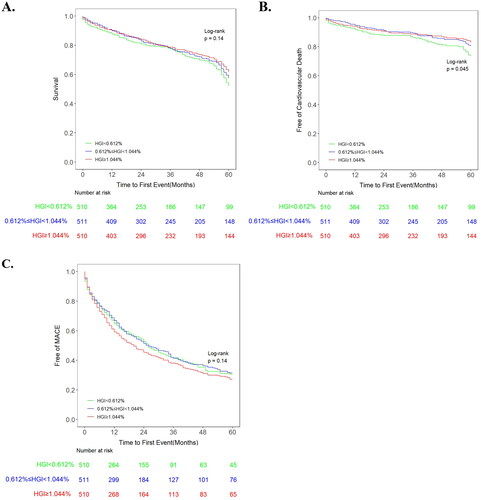
Figure 4. Adjusted survival curves for (A) all-cause death, (B) cardiovascular death and (C) MACE after adjustment for age, sex, hypertension, diabetes status, atrial fibrillation status, prior myocardial infarction and stroke status, BMI, systolic blood pressure, diastolic blood pressure, heart rate, LVEF, BNP, haemoglobin, CRP, HDL-C, beta-blockers, ACEIs/ARBs, and spironolactone use. HGI: haemoglobin glycation index; MACE: major adverse cardiac events.
Predictive value of the HGI
The Cox proportional hazards model was developed to confirm the predictive capability of the HGI. Three nested models were fitted to adjust for confounders. When HGI was analysed as a categorical variable, the tertile 3 group had a significantly lower incidence of all-cause death (adjusted HR = 0.720, 95% CI = 0.563–0.921, p = 0.009) and CV death (adjusted HR = 0.619, 95% CI = 0.445–0.861, p = 0.004) than did the tertile 1 group, while all-cause death and CV death were similar in the tertile 1 and 2 groups. All adjusted models showed a significant decreasing trend in the risk of all-cause death and CV death from tertile 1 to tertile 3. In contrast, the incidence of MACE was similar among the three groups (). When HGI was analysed as a continuous variable, a 1% increase in HGI was associated with a 12.5% reduction in all-cause mortality (adjusted HR = 0.875, 95% CI = 0.787–0.973, p = 0.014) and a 20.8% reduction in CV death (adjusted HR = 0.792, 95% CI = 0.676–0.928, p = 0.004) (). Statistical analysis of the Schoenfeld residuals showed that the proportional hazard assumption was not violated.
Table 2. Cox proportional hazard Model of HGI (as categorical variable).
Table 3. Cox proportional hazard Model of HGI (as continuous variable).
Subgroup analysis revealed a significant interactive effect between LVEF and HGI on all-cause death (p = 0.030) and CV death (p = 0.036). A significant protective effect of the HGI was observed in patients with an LVEF < 40% for all-cause and CV deaths. Conversely, there were no interactions between the HGI and any other variables, except for LVEF ().
Figure 5. Forest plot of all-cause death in different subgroups. The adjusted models included age, sex, hypertension, diabetes status, atrial fibrillation status, prior myocardial infarction and stroke status, BMI, systolic blood pressure, diastolic blood pressure, heart rate, LVEF, BNP, haemoglobin, CRP, HDL-C, beta-blockers, ACEIs/ARBs, and spironolactone use. CI: confidence interval; eGFR: estimated glomerular filtration rate; HGI: haemoglobin glycation index; HR: hazard ratio; LVEF: left ventricular ejection fraction.
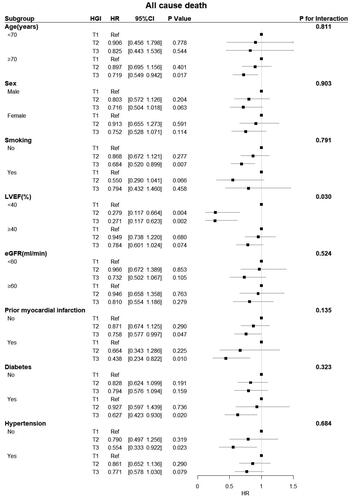
Figure 6. Forest plot of CV death in different subgroups. The adjusted models included age, sex, hypertension, diabetes status, atrial fibrillation status, prior myocardial infarction and stroke status, BMI, systolic blood pressure, diastolic blood pressure, heart rate, LVEF, BNP, haemoglobin, CRP, HDL-C, beta-blockers, ACEIs/ARBs, and spironolactone use. CI: confidence interval; eGFR: estimated glomerular filtration rate; HGI: haemoglobin glycation index; HR: hazard ratio; LVEF: left ventricular ejection fraction.
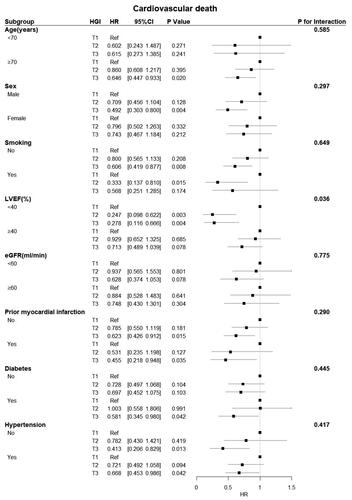
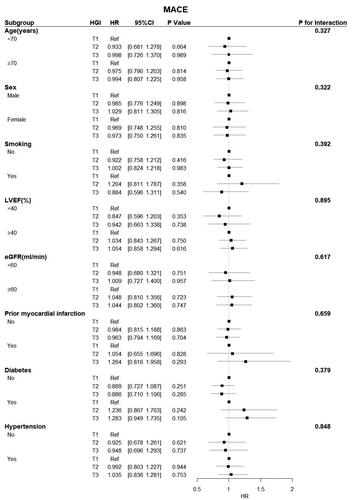
Figure 7. Forest plot of MACE in different subgroups. The adjusted models included age, sex, hypertension, diabetes status, atrial fibrillation status, prior myocardial infarction and stroke status, BMI, systolic blood pressure, diastolic blood pressure, heart rate, LVEF, BNP, haemoglobin, CRP, HDL-C, beta-blockers, ACEIs/ARBs, and spironolactone use. CI: confidence interval; eGFR: estimated glomerular filtration rate; HGI: haemoglobin glycation index; HR: hazard ratio; LVEF: left ventricular ejection fraction; MACE: major adverse cardiac events.
Discussion
In this retrospective study, we first demonstrated the association between the HGI and the risk of all-cause mortality, CV death, and MACE (including nonfatal myocardial infarction, nonfatal stroke or worsening of HF) in patients with ADHF. An increased HGI appeared to be protective against all-cause and CV death but had no effect on MACE incidence.
There is a close relationship between HF and diabetes. Preiss et al. established that the severity of HF was another important risk factor for the development of diabetes in patients with chronic HF in addition to HbA1c levels and BMI [Citation20]. Kristensen et al. reported that prediabetes and diabetes were associated with a significantly increased risk of adverse cardiovascular outcomes (compared to patients with normal blood glucose) in patients with HF with reduced ejection fraction [Citation3]. Echouffo-Tcheugui et al. reported that uncontrolled diabetes was associated with a substantial risk of HF progression in older adults with preclinical HF stages [Citation2]. Moreover, Huang et al. discovered a direct relationship between the TyG index, a surrogate marker of insulin resistance, and the unfavourable prognosis of patients with ADHF [Citation21]. One study indicated a direct correlation between HbA1c levels and insulin resistance [Citation22]. Thus, it is essential to attain ideal control of HbA1c in HF patients, especially those with diabetes.
Although there is good agreement between glycosylated haemoglobin, which is the gold standard for monitoring glycaemic control, and blood glucose levels, this is not always the case [Citation23]. The determination of HbA1c is based on the assumption that the glucose concentration in red blood cells is equal to the plasma glucose concentration, and this assumption is based on the expression of constitutive glucose transporters in red blood cells. In fact, the lifespan of red blood cells varies greatly among individuals, which implies that the above assumption may be incorrect [Citation24]. In a recent review discussing potential clinical errors caused by the use of HbA1c in diabetes patients, significant discrepancies between HbA1c and actual blood glucose levels were found in a significant proportion of diabetic patients (almost 40%) [Citation25]. Thus, the HGI was proposed to resolve this inconsistency, which is defined as the difference between the observed and predicted HbA1c levels [Citation14]. In the Action in Diabetes and Vascular Disease (ADVANCE) trial, patients with diabetes and a high HGI in the intensive treatment group had a lower risk of death [Citation26]. In contrast, in the Action to Control Cardiovascular Risk in Diabetes (ACCORD) cohort, patients with diabetes and a high HGI in the intensive therapy group had a significantly greater risk of death [Citation27]. The results of the above large-scale cohort studies of diabetes were contradictory, and it was likely that the difference in the protocol used between the two trials led to different research results [Citation25]. This may also indicate that the unquestioning use of HbA1c has an impact on clinical treatment. Nayak et al. suggested that a low HGI in patients with similar blood glucose levels indicates that the observed HbA1c level is lower than the real HbA1c level (i.e. the predicted HbA1c level), while a high HGI indicates the opposite. For patients with a low HGI, the observed HbA1c was low, and doctors might think that the blood glucose level of such patients has been properly controlled, but these patients are actually at a greater risk of hyperglycaemia [Citation25]. Another study revealed that a high HGI was related to a high insulin utilization rate in patients with type 2 diabetes [Citation27]. Nonetheless, it is worth noting that the incidence of hypoglycaemia in the low-HGI subgroup was lower in both the intensive and standard blood glucose treatment cohorts in the ACCORD cohort [Citation28]. Therefore, to some extent, clinicians’ lack of attention given to blood glucose control in patients with a low HGI may also lead to increased mortality.
In recent years, numerous clinical studies have shown that the HGI is linked to cardiovascular disease. Ahn et al. found that after adjusting for other cardiovascular disease risk factors, including HbA1c, a high HGI was independently related to the prevalence of multiple cardiovascular diseases, an individual cardiovascular disease, stroke and peripheral arterial diseases in people with impaired glucose metabolism [Citation29]. Pan et al. noted that, compared with moderate HGI, both low HGI and high HGI are related to an increased risk of poor prognosis in diabetic patients with ischemic stroke [Citation17]. Klein et al. and Xu et al. suggested that a high HGI was associated with an increased risk of MACE in patients with type 2 diabetes [Citation30,Citation31].
In contrast, in our study, a high HGI was related to an improvement in the survival rate of patients with ADHF. Apart from the deviation of clinical treatment strategies, other possible explanations are as follows. First, previous studies have shown that among patients with HF and T2DM, patients with an HbA1c value between 7.1% and 8.0% have the lowest mortality risk [Citation5]. After the baseline analysis of our research population, we found that more than 80% of the patients had an HbA1c value of less than 7.0%. After adjusting for the same confounding factors, it was found that the associations between HbA1c and the risk of all-cause death, CV death and MACE were the same as those between the HGI and the risk of all-cause death, CV death and MACE, but these associations were not statistically significant. Therefore, our study revealed a decreased rate of mortality in patients with a higher HGI and HbA1c, which might be related to the fact that the HbA1c value was <7.0% in most people included in the study. However, the safest HGI range in patients with ADHF needs to be further confirmed by studies with larger sample sizes. Additionally, HGI is likely to play different roles in populations with different diseases. According to previous studies, the HGI was negatively correlated with the incidence of nonfatal infarction in patients with prior cardiovascular disease [Citation15]. The HGI had a U-shaped correlation with all-cause death in patients with coronary artery disease after PCI but was not correlated with CV death or MACE [Citation32]. A high HGI was associated with a high prevalence of cardiovascular diseases in patients with prediabetes and diabetes [Citation29]. Our study was the first attempt to analyse the predictive value of the HGI for the prognosis of patients with ADHF. The mechanism responsible for this outcome is unknown, and additional prospective studies are needed for further discussion.
According to our subgroup analysis, a higher HGI was correlated with a significant reduction in all-cause and CV death in diabetic patients with ADHF. Most observations show that hyperglycaemia alters the quantitative relationship between HbA1c and blood glucose in a way that characteristically increases HGI, regardless of whether treatment is received [Citation16,Citation18,Citation33]. As a result, patients with diabetes are more likely to have a higher HGI and receive more intense glucose control treatment, which ultimately benefits the patient. Moreover, compared to patients with an LVEF ≥ 40%, patients with an LVEF < 40% experienced a greater protective effect from an increased HGI according to our subgroup analysis. This finding implies that the HGI is more likely to have a higher predictive value in populations with severely impaired cardiac function and diabetes. The above findings, derived from post hoc analysis, need to be confirmed in further investigations with larger sample sizes.
Previous studies have shown that the overall agreement between HbA1c and oral glucose tolerance test (OGTT) results for diagnosing abnormal blood glucose levels is low in middle-aged and older Chinese people [Citation34,Citation35]. Thus, HbA1c testing is neither sensitive nor specific for detecting prediabetes. Goode et al. reported that with the OGTT as the gold standard, more than 60% of patients in the low-HGI subgroup were diagnosed with hyperglycaemia, and more than 10% were diagnosed with diabetes. With HbA1c as the diagnostic standard, more than 20% of patients in the low-HGI subgroup were diagnosed with hyperglycaemia, and less than 5% were diagnosed with diabetes [Citation36]. Therefore, when HbA1c is used for diagnosis, patients with a low HGI have a greater possibility of undetected hyperglycaemia than do those with a high HGI. This may lead to inappropriate management strategies for people with a low HGI. Furthermore, through repeated measurements of HbA1c and mean blood glucose within one year, it was found that the HGI has a consistent direction and size in the clinical population of children and adolescents with type 1 diabetes [Citation14]. Thus, we believe that the variability of individual HGI may be low, which is helpful in blood glucose control and management of patients with ADHF complicated with prediabetes to avoid incorrect diagnosis and treatment.
Limitations
To the best of our knowledge, this is the first study to identify the relationship between the HGI and outcomes in patients with ADHF. The choice of the linear regression equation used for calculating the HGI was validated by Hemper et al. (who first proposed the HGI) in diverse populations and promoted the generalizability of the findings. However, several limitations of this study still need to be considered. The present study did not further investigate whether the HGI score has a greater predictive value than the HbA1c level in patients with ADHF; additional data analysis is needed in future studies. Furthermore, this was a retrospective cohort study with a small sample size. Although confounding factors were adjusted for in the data analysis, bias could not be completely eliminated.
Conclusion
In summary, HGI was directly associated with all-cause and CV death in patients with ADHF. This study may provide guidance and a reference for plasma glucose control in the management of ADHF.
Author contributions
Zhonghai Wei and Han Wu contributed to the conception and design of the study; Weimeng Cheng, Yue Pu and Tianyue Li contributed to manuscript writing; Jianzhou Chen, Tianyue Li and Guannan Li contributed to data collection and management; Rong Huang, Weimeng Cheng and Xue Bao contributed to the statistical analysis; Jianzhou Chen, Xue Bao and Han Wu participated in the patient follow-up; and Zhonghai Wei and Guannan Li contributed to manuscript revision and data review. All the authors have read and approved the manuscript.
Ethics approval and consent to participate.
The data collection was approved by the Medical Ethics Committee of Nanjing Drum Tower Hospital, the Affiliated Hospital of Nanjing University Medical School (2022-060-02). All participants provided verbal consent to participate in the study. Our database is not available to the public, and the individual privacy of the participants is well protected.
Acknowledgments
Not applicable.
Disclosure statement
No potential conflict of interest was reported by the author(s).
Data availability statement
The information and data of the study population were extracted from the Hospital Information System. The datasets are not publicly available because the individual privacy of the patients should be protected. However, the data are available from the corresponding author upon reasonable request.
Additional information
Funding
References
- American Diabetes Association. Diagnosis and classification of diabetes mellitus. Diabetes Care. 2013;36(Suppl 1):1–16. doi: 10.2337/dc13-S067.
- Echouffo-Tcheugui JB, Ndumele CE, Zhang S, et al. Diabetes and progression of heart failure. J Am Coll Cardiol. 2022;79(23):2285–2293. doi: 10.1016/j.jacc.2022.03.378.
- Kristensen SL, Preiss D, Jhund PS, et al. Risk related to pre–diabetes mellitus and diabetes mellitus in heart failure with reduced ejection fraction: insights from prospective comparison of ARNI with ACEI to determine impact on global mortality and morbidity in heart failure trial. Circ: heart Failure. 2016;9(1):e002560. doi: 10.1161/CIRCHEARTFAILURE.115.002560.
- Goode KM, John J, Rigby AS, et al. Elevated glycated haemoglobin is a strong predictor of mortality in patients with left ventricular systolic dysfunction who are not receiving treatment for diabetes mellitus. Heart. 2009;95(11):917–923. doi: 10.1136/hrt.2008.156646.
- Elder DHJ, Singh JSS, Levin D, et al. Mean HbA1c and mortality in diabetic individuals with heart failure: a population cohort study: mean HbA1c and mortality in CHF. Eur J Heart Fail. 2016;18(1):94–102. doi: 10.1002/ejhf.455.
- Eshaghian S, Horwich TB, Fonarow GC. An unexpected inverse relationship between HbA1c levels and mortality in patients with diabetes and advanced systolic heart failure. Am Heart J. 2006;151(1):91.e1–91.e6. doi: 10.1016/j.ahj.2005.10.008.
- Wilson DM, Xing D, Cheng J, et al. Persistence of individual variations in glycated hemoglobin. Diabetes Care. 2011;34(6):1315–1317. doi: 10.2337/dc10-1661.
- Yudkin JS, Forrest RD, Jackson CA, et al. Unexplained variability of glycated haemoglobin in non-diabetic subjects not related to glycaemia. Diabetologia. 1990;33(4):208–215. doi: 10.1007/BF00404798.
- Bergenstal RM, Gal RL, Connor CG, et al. Racial differences in the relationship of glucose concentrations and hemoglobin A1c levels. Ann Intern Med. 2017;167(2):95–102. doi: 10.7326/M16-2596.
- Snieder H, Sawtell PA, Ross L, et al. HbA1c levels are genetically determined even in type 1. Diabetes. Diabetes. 2001;50(12):2858–2863. doi: 10.2337/diabetes.50.12.2858.
- Pani LN, Korenda L, Meigs JB, et al. Effect of aging on A1C levels in individuals without diabetes. Diabetes Care. 2008;31(10):1991–1996. doi: 10.2337/dc08-0577.
- Cohen RM, Franco RS, Khera PK, et al. Red cell life span heterogeneity in hematologically normal people is sufficient to alter HbA1c. Blood. 2008;112(10):4284–4291. doi: 10.1182/blood-2008-04-154112.
- English E, Idris I, Smith G, et al. The effect of anaemia and abnormalities of erythrocyte indices on HbA1c analysis: a systematic review. Diabetologia. 2015;58(7):1409–1421. doi: 10.1007/s00125-015-3599-3.
- Hempe JM, Gomez R, McCarter RJ, et al. High and low hemoglobin glycation phenotypes in type 1 diabetes a challenge for interpretation of glycemic control. J Diabetes Complications. 2002;16(5):313–320. doi: 10.1016/s1056-8727(01)00227-6.
- Østergaard HB, Mandrup-Poulsen T, Berkelmans GFN, et al. Limited benefit of haemoglobin glycation index as risk factor for cardiovascular disease in type 2 diabetes patients. Diabetes Metab. 2019;45(3):254–260. doi: 10.1016/j.diabet.2018.04.006.
- Rhee E-J, Cho J-H, Kwon H, et al. Association between coronary artery calcification and the hemoglobin glycation index: the kangbuk samsung health study. J Clin Endocrinol Metab. 2017;102(12):4634–4641. doi: 10.1210/jc.2017-01723.
- Pan Y, Jing J, Wang Y, et al. Association of hemoglobin glycation index with outcomes of acute ischemic stroke in type 2 diabetic patients. Neurol Res. 2018;40(7):573–580. doi: 10.1080/01616412.2018.1453991.
- Hempe JM, Yang S, Liu S, et al. Standardizing the haemoglobin glycation index. Endocrino Diabet & Metabol. 2021;4(4):e00299. doi: 10.1002/edm2.299.
- Cole SR, Hernán MA. Adjusted survival curves with inverse probability weights. Comput Methods Programs Biomed. 2004;75(1):45–49. doi: 10.1016/j.cmpb.2003.10.004.
- Preiss D, Zetterstrand S, McMurray JJV, et al. Predictors of development of diabetes in patients with chronic heart failure in the candesartan in heart failure assessment of reduction in mortality and morbidity (CHARM) program. Diabetes Care. 2009;32(5):915–920. doi: 10.2337/dc08-1709.
- Huang R. Prognostic value of triglyceride glucose (TyG) index in patients with acute decompensated heart failure. Cardiovasc Diabetol. 2022;21(1):88. doi: 10.1186/s12933-022-01507-7.
- Hou X, Liu J, Song J, et al. Relationship of hemoglobin A1c with β cell function and insulin resistance in newly diagnosed and drug naive type 2 diabetes patients. J Diabetes Res. 2016;2016:8797316. doi: 10.1155/2016/8797316.
- Wei N, Zheng H, Nathan DM. Empirically establishing blood glucose targets to achieve HbA1c goals. Diabetes Care. 2014;37(4):1048–1051. doi: 10.2337/dc13-2173.
- Cohen RM, Franco RS, Smith EP, et al. When HbA1c and blood glucose do not match: how much is determined by race, by genetics, by differences in mean red blood cell age? J Clin Endocrinol Metab. 2019;104(30):707–710. doi: 10.1210/jc.2018-02409.
- Nayak AU, Singh BM, Dunmore SJ. Potential clinical error arising from use of HbA1c in diabetes: effects of the glycation gap. Endocr Rev. 2019;40(4):988–999. doi: 10.1210/er.2018-00284.
- van Steen SC, Woodward M, Chalmers J, On behalf of the ADVANCE Collaborative Group., et al. Haemoglobin glycation index and risk for diabetes-related complications in the action in diabetes and vascular disease: preterax and diamicron modified release controlled evaluation (ADVANCE) trial. Diabetologia. 2018;61(4):780–789. doi: 10.1007/s00125-017-4539-1.
- Kim MK, Jeong JS, Kwon H-S, et al. Concordance the hemoglobin glycation index with glycation gap using glycated albumin in patients with type 2 diabetes. J Diabetes Complications. 2017;31(7):1127–1131. doi: 10.1016/j.jdiacomp.2017.04.015.
- Hempe JM, Liu S, Myers L, et al. The hemoglobin glycation index identifies subpopulations with harms or benefits from intensive treatment in the ACCORD trial. Diabetes Care. 2015;38(10):e172–e173. doi: 10.2337/dci15-0001.
- Ahn CH, Min SH, Lee D-H, et al. Hemoglobin glycation index is associated with cardiovascular diseases in people with impaired glucose metabolism. J Clin Endocrinol Metab. 2017;102(8):2905–2913. doi: 10.1210/jc.2017-00191.
- Klein KR, Franek E, Marso S, et al. Hemoglobin glycation index, calculated from a single fasting glucose value, as a prediction tool for severe hypoglycemia and major adverse cardiovascular events in DEVOTE. BMJ Open Diab Res Care. 2021;9(2):e002339. doi: 10.1136/bmjdrc-2021-002339.
- Xu S, Qin Z, Yuan R, et al. The hemoglobin glycation index predicts the risk of adverse cardiovascular events in coronary heart disease patients with type 2 diabetes mellitus. Front Cardiovasc Med. 2022;9:992252. doi: 10.3389/fcvm.2022.992252.
- Cheng M-D, Tang J-N, Liu Z-Y, et al. Association of hemoglobin glycation index with prognosis of coronary artery disease after percutaneous coronary intervention: a retrospective cohort study. Diab Vasc Dis Res. 2023;20(4):14791641231193306. doi: 10.1177/14791641231193306.
- Hsia DS, Rasouli N, Pittas AG, et al. Implications of the hemoglobin glycation index on the diagnosis of prediabetes and diabetes. J Clin Endocrinol Metab. 2020;105(3):e130–8–e138. doi: 10.1210/clinem/dgaa029.
- Olson DE, Rhee MK, Herrick K, et al. Screening for diabetes and Pre-Diabetes with proposed A1C-Based diagnostic criteria. Diabetes Care. 2010;33(10):2184–2189. doi: 10.2337/dc10-0433.
- Barry E, Roberts S, Oke J, et al. Efficacy and effectiveness of screen and treat policies in prevention of type 2 diabetes: systematic review and meta-analysis of screening tests and interventions. BMJ. 2017;356:i6538. doi: 10.1136/bmj.i6538.
- Lin L, Wang A, He Y, et al. Effects of the hemoglobin glycation index on hyperglycemia diagnosis: results from the REACTION study. Diabetes Res Clin Pract. 2021;180:109039. doi: 10.1016/j.diabres.2021.109039.