
Abstract
Background: Ulcerative colitis (UC), which is characterized by chronic relapsing inflammation of the colon, results from a complex interaction of factors involving the host, environment, and microbiome. The present study aimed to investigate the gut microbial composition and metabolic variations in patients with UC and their spouses. Materials and Methods: Fecal samples were collected from 13 healthy spouses and couples with UC. 16S rRNA gene amplicon sequencing and metagenomics sequencing were used to analyze gut microbiota composition, pathways, gene expression, and enzyme activity, followed by the Kyoto Encyclopedia of Genes and Genomes. Results: We found that the microbiome diversity of couples with UC decreased, especially that of UC patients. Bacterial composition, such as Firmicutes, was altered between UC patients and healthy controls, but was not significantly different between UC patients and their spouses. This has also been observed in pathways, such as metabolism, genetic information processing, organismal systems, and human diseases. However, the genes and enzymes of spouses with UC were not significantly different from those of healthy individuals. Furthermore, the presence of Faecalibacterium correlated with oxidative phosphorylation, starch and sucrose metabolism, amino sugar and nucleotide sugar metabolism, and the bacterial secretion system, showed a marked decline in the UC group compared with their spouses, but did not vary between healthy couples. Conclusion: Our study revealed that cohabitation with UC patients decreased differences in the gut microbiome between healthy individuals and patients. Not only was the composition and diversity of the microbiota diminished, but active pathways also showed some decline. Furthermore, Firmicutes, Faecalibacterium, and the four related pathways may be associated with the pathological state of the host rather than with human behavior.
1. Introduction
Ulcerative colitis (UC) is a chronic inflammatory disease characterized by relapsing and remitting episodes of mucosal inflammation in the rectum and extending to the proximal segments of the colon [Citation1]. The most understood inflammatory bowel disease (IBD) disorders include Crohn’s disease (CD) and UC, which are caused by multiple factors, including host genetics, environment, and microbes [Citation2]. In contrast to the transmural inflammation lining the gastrointestinal tract observed in CD, UC presents with diffuse mucosal inflammation of the colon [Citation3,Citation4]. These disorders affect intestinal mucosal homeostasis, peacefully cohabitating with the abundance and diversity of commensal bacteria colonizing the intestinal tract [Citation5,Citation6]. Recently, a role for intestinal bacteria in UC has been proposed.
Early studies have revealed differences in the microbiota of patients with IBD. In patients with IBD, microbial diversity and Firmicutes and Clostridium abundances are decreased, while the abundance of Enterobacteriaceae is increased. Another study described alterations in Bacteroides, Bifidobacterium and Lactobacillus composition but with inconsistent results [Citation7]. Fecal microbiota transplantation (FMT) has been shown to increase diversity in fecal and colon samples and the abundance of Eubacterium hallii and Roseburia inulivorans in patients who achieved remission [Citation8]. Furthermore, a proposed mechanism for IBD involves Clostridium and Bacteroides fragilis-mediated stimulation of Treg cell differentiation, which is a critical factor in the altered immune responses in IBD [Citation9,Citation10].
Alterations in microbiota composition have an impact on the development of IBD through perturbation of biochemical pathways. A recent study by Weersma et al. found that the abundance of the phylum Bacteroidetes increased, while pathways involved in the fermentation of pyruvate to propanoate decreased in IBD [Citation11]. Metabolic pathways associated with short-chain fatty acid (SCFA) and L-arginine synthesis play important roles in maintaining intestinal barrier function and inflammation-associated immunosuppression, and also influence IBD [Citation12].
Gut microbiome composition is affected by host factors, including genetic background, age, immune system, psychological state, drug treatment, and long- or short-term dietary habits. For example, irrespective of the IBD subtype and the weak correlation with inflammation, patients receiving a course of oral corticosteroids exhibit greater microbiome fluctuations than patients receiving stable medication [Citation13]. A strict vegetarian diet al.so has a negative relationship with a reduction in Bacteroides species and Bifidobacterium species, Escherichia coli, and Enterobacteriaceae [Citation14]. Thus, human behavior is considered a complex factor that is closely associated with the gut microbiota.
However, most studies have focused on the impact of diseases on the gut microbiome without considering these confounding factors. Previous studies have reported that the gut microbiome of healthy spouses shows strong similarities [Citation15], but there is limited evidence regarding the gut microbiome of patients with UC and their spouses. The incidence of UC in the affected spouses with comparable lifestyles was markedly different. How the diversity in the gut microbiota of cohabitating spouses and partners is modified by the patients’ pathological state and each other’s influence on the development of UC is currently unknown.
A detailed analysis was performed to determine fecal bacterial composition and differences between UC patients and their healthy spouses and non-cohabitating healthy individuals, using 16s rRNA amplicon sequencing. As 16s rRNA amplicon studies identify family- and genus-level flora, we further aimed to reveal the differential gene expression and pathways present in the gut microbiome of patients with UC using a more robust metagenomic processing approach.
2. Materials and methods
2.1. Study design
To characterize the pattern of microbial colonization in relation to UC and their lifestyle, as gut microbiota is affected by diet and lifestyle, we recruited and sampled a total of 13 pairs of healthy control spouses and UC spouses (two samples’ richness of one UC pair was too low to be tested by 16s rRNA amplicon sequencing, and one data from the UC-spouse group during metagenomic processing was deleted for the same reason).
2.2. Patients and healthy controls recruitment
Fecal samples of UC patients (UC) and their healthy spouses (UC-S) were collected from the Department of Gastroenterology, Beijing Chaoyang Hospital of Capital Medical University. UC was diagnosed based on conventional clinical, radiological, and endoscopic features and eventually confirmed by histological examination of colonic biopsies [Citation16]. Age- and sex-matched healthy controls (Health) and their spouses (Health-S) were enrolled at the Health Examination Center of the Beijing Chaoyang Hospital of Capital Medical University. None of the research subjects had received antibiotic treatment in the last three months. This study was approved by the Medical Ethics Committee of Beijing Chaoyang Hospital, Capital Medical University. The approval number was 2019-Ke-298. Volunteers signed a written informed consent form, which was also approved by the committee.
2.3. Sample collection and processing
Fecal samples were collected into disposable sterile plastic tubes (stool DNA stabilizer) and then transferred to −80 °C until processing.
2.4. DNA extraction and amplification
Fecal samples (0.25 g) were processed using the PowerSoil DNA isolation kit (MoBio Laboratories, 12888) following the manufacturer’s instructions. The extracted DNA was stored at −80 °C. DNA samples were amplified V3-V4 region of 16S rRNA using primers 338 F-5′-ACTCCTACGGGAGGCAGCAG-3′ and 806 R-5′-GGACTACHVGGGTWTCTAAT-3.’
2.5. Amplicon sequencing and analysis
16S rRNA gene amplicon sequencing was performed using the MiSeq platform (Allwegene, Beijing) according to the recommended protocol. Sequences with a distance-based similarity of > 97% were grouped into OTUs. Alpha diversity (chao1, observed_species, PD-whole-tree, and Shannon) and Venn diagram analyses were carried out using QIIME software. Beta diversity was estimated by Principal Coordinate Analysis (PCoA) using the unweighted UniFrac distance. The characterization of microbial features was performed using linear discriminant analysis effect size (LEfSe, LDA > 3.0). Illumina Analysis Pipeline Version 2.6 (Illumina, San Diego) was used for image analysis and error estimates.
2.6. Metagenomics sequencing
Metagenomic libraries obtained from the present study were pooled according to their concentrations and data quantity and then sequenced on a HiSeq4000 platform (Illumina, San Diego, CA, USA). We controlled the original data quality using Trimmonmatic software, following discarding trimmed reads <150bp in length. High-quality sequences were matched and annotated using DIAMOND BLASTX and assembled using MEGAHIT after filtering fragments <500bp in length. Non-redundant gene clusters were obtained using CD-HIT, based on ORF prediction. We then matched the metagenomic data and non-redundant gene clusters using Bowtie software. Taxonomic assignment and functional annotation with non-redundant gene clusters were performed using non-redundant protein sequences (NR), Kyoto Encyclopedia of Genes and Genomes (KEGG), and evolutionary genealogy of genes: Non-supervised Orthologous Groups (eggNOG), Geneontology (GO), and Carbohydrate-Active Enzymes (CAZyme) databases.
2.7. Statistical analysis
Statistical analysis and visualization of the taxonomic profiles derived from metagenomic and amplicon sequencing were performed using the R software. The abundance of various classes of pathways, genes, and enzymes from every two groups was normalized and analyzed using Wilcoxon successively. Data were statistically analyzed using SPSS version 26 (Chicago, Illinois, USA). One-way analysis of variance (ANOVA) was used for parametric tests, while the Kruskal-Wallis test was used for non-parametric tests. We carried out a Tukey test for multiple comparisons between the groups. Results were considered significant at p < 0.05.
3. Results
3.1. Cohort characteristics
Thirteen pairs of healthy couples (Health and Health-S) and their respective UC couples (UC and UC-S) were recruited. The characteristics of patients and controls are presented in . We compared the differential characteristics between healthy controls and patients with UC, but we also compared patients with UC and their spouses separately to eliminate the influence of lifestyle on UC. The Venn diagram showed that 876 of the 1483 enriched OTUs (Operational Taxonomic Units (OTUs) were shared among all samples (Supplementary Figure 1).
Table 1. Characteristics of healthy and UC couples.
3.2. Gut microbial composition of both UC and their spouses changed
3.2.1. Diversity of gut flora of UC couples decreased
Chao1 and observed-species indices indicated significant differences in species composition indices among the UC group and the other three healthy groups, while there were no significant differences among UC-S and healthy control spouse pairs. PD-whole-tree and Shannon indices in the UC group were significantly lower than those in the Health and Health-S groups; however, there were no significant differences in these indices between UC individuals and their respective spouses (Supplementary Figure 2). The biodiversity of couples with UC was lower than that of healthy control couples and was the lowest among individuals in the UC group.
At the phylum level, in contrast to the two pairs (healthy couples and UC couples), healthy controls and Health-S group showed minimal differences in microbiome diversity, whereas UC couples showed more marked differences. The most abundant bacterium, Firmicutes, which was present to a similar degree in healthy pairs, decreased in the UC group and increased in the UC-S group compared to the UC group (). Furthermore, differences between the UC individuals and all healthy groups for the phyla Verrucomicrobia and Actinobacteria were not detected between UC and their spouses. This was also observed for other phyla including Proteobacteria and Bacteroidetes ().
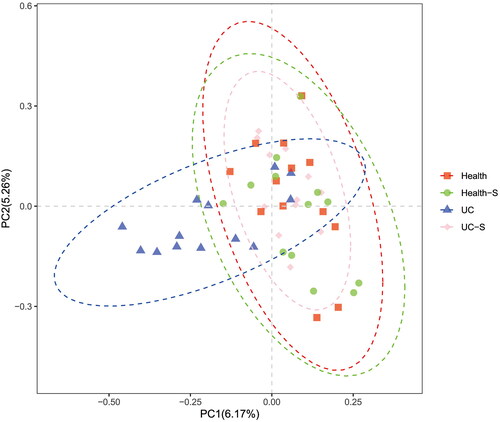
Figure 1. Fecal microbiome analysis by 16s rRNA amplicon sequencing in health control, UC patients and their spouses (n = 12 in Health and Health-S groups, n = 13 in UC and UC-S groups). Relative abundances of bacterial phylum (A) and Top 20 genus (B) levels in study participants; LEfSe analyzes (LDA score, >3.0) to determine the taxonomic differences between two groups: Health and UC group (C); UC and UC-S group (D); (E) PCoA analysis of fecal microbiota beta-diversity confirms the segregation of all study participants.
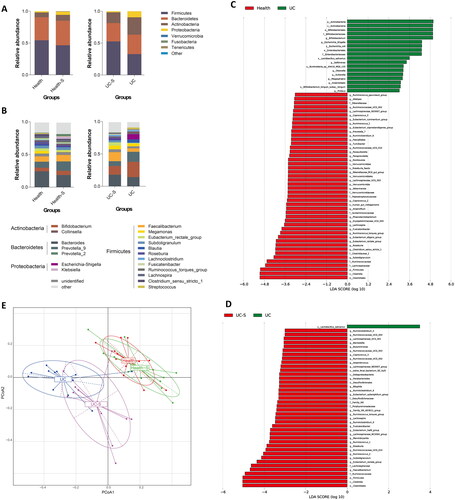
3.2.2. Faecalibacterium showed the highest variability between UC and UC-S
The top five genera in both the Health and Health-S groups were Bacteroides, Prevotella_9, Faecalibacterium, Bifidobacterium, and non-classified species. In the UC-S group, the rank of Prevotella_9 abundance decreased, while that of Megamonas abundance increased compared to that in the healthy controls. The top five genera in the fecal microbiota of the UC group were Bifidobacterium, Prevotella_9, Bacteroides, Escherichia-Shigella, and Faecalibacterium (). The composition of Faecalibacterium was significantly lower than that in the UC-S group (), but did not change between healthy couples. Furthermore, the ranks of Bifidobacterium and Escherichia-Shigella abundances were higher in UC patients, while that of Bacteroides abundance was lower than that in healthy controls (). At the genus level, notable differences in taxonomic profiles harbored by the gut microbiome of UC individuals with those of the healthy group indicated a higher relative abundance of Bifidobacterium, Escherichia-Shigella, Sellimonas, Olsenella, Sutterella, Megasphaera, Anaerostipes, and Proteus and a lower relative abundance of 30 genera. Among these, the genera Akkermansia and Parasutterella belonged to the phyla Verrucomicrobia and Proteobacteria, respectively, whereas the remaining genera belonged to the phyla Firmicutes (n = 24) and Bacteroidetes (n = 4). Nonetheless, no specific bacteria were altered in the UC group compared to the UC-S group. (). Of note, when we focused on differences in the microbiome composition between the two spouse-paired groups at both the phylum and genus levels, the flora abundance at the genus level was significantly more diverse than in the UC group and the UC-S.
3.2.3. The composition of UC-S was different from both UC and healthy controls
To estimate the extent of similarity among the microbial communities among the four groups, principal coordinate analysis (PCoA) was performed using unweighted UniFrac. UC spouses and their respective healthy spouses showed a net separation in the PCoA. Unlike the healthy controls and their spouses, the UC and UC-S groups showed partially overlapping regions, which indicated that the composition of the UC-S group exhibited a partial consensus with that of UC patients ().
3.3. Pathways, especially related to faecalibacterium, were altered between UC couples
3.3.1. Variation between pathways of UC couples increased compared to that of health couples
To evaluate the functional changes in these four groups, metagenomic sequencing was performed and information was annotated according to the Kyoto Encyclopedia of Genes and Genomes (KEGG) pathway, which was divided into three classes. All pathways were categorized into seven class 1 pathways and 60 class 2 pathways. Because the two spouse groups had the same sex and age stratification, we examined the UC group with the two spouse groups.
The abundance of class 2 pathways in each sample was normalized and analyzed by Wilcoxon test, and we listed all the significantly changed pathways between UC and the two spouses’ groups (, p < 0.05). We found that the increased and decreased pathway expression in UC individuals compared with their spouses (UC-S) showed a similar trend when compared with the Health-S group. All the differentially expressed pathways involved in metabolism and genetic information processing were decreased in the UC group compared to the healthy spouse group (Supplementary Table 1). By interrogating all the altered pathways, we identified eight pathways that differed significantly between the UC and Health-S groups but did not show significant differences between the UC and UC-S groups. These findings suggest that the different pathways between UC and their spouses were due to differences between UC individuals and Health-S pairs, and half of these belonged to class 1 metabolic pathways ().
Figure 2. Differential class 2 pathways between two groups: (A) Health-S and UC; (B) UC-S and UC. Wilcoxon analysis was used for normalized abundance of each pathway (n = 12 in Health and Health-S groups, n = 13 in UC and UC-S groups; p < 0.05).
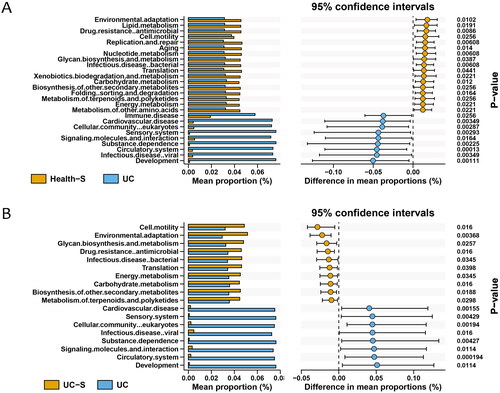
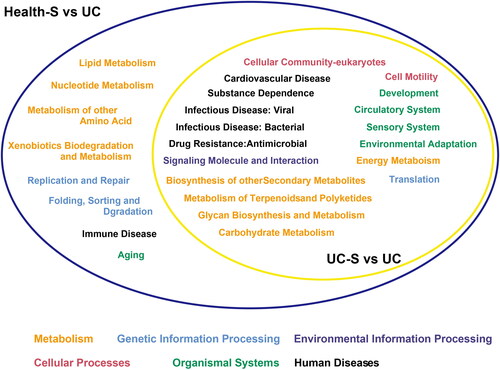
Figure 3. The relationship of differential class 2 pathways between UC group and two spouse groups. Eight pathways were changed significantly just between Health-S and UC groups. One color represents one pathway at class 1. KEGG pathway is divided into 3 classes. There are 7 class 1 pathways. 60 classes 2 pathways are subordinate to these 7 class 1 pathways. But the samples were enriched just in 6 class 1 pathways.
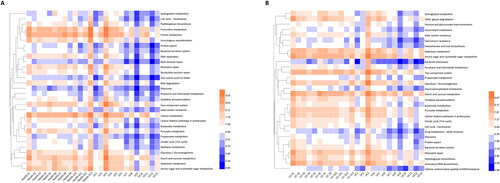
Furthermore, with regard to class 3 pathways, we compared the UC group with their respective spouses (UC-S) to determine the precise pathways affected by the host rather than sex-based or environmental factors (p < 0.05). In total. 229 pathways, covering all functional aspects, showed significant differences between the two groups. Among these, the abundance of 174 pathways increased, whereas that of 55 pathways decreased in the UC group (Supplementary Table 2 sheet UC vs. UC-S, ). Moreover, 240 different pathways were identified in the UC and Health-S groups, comprising 171 upregulated and 69 downregulated pathways ( sheet UC vs. Health-S, ). shows the top 30 differential class 3 pathways between the two groups. When we aligned these differentially expressed pathways in UC individuals and healthy spouses, 205 were the same, 56% belonged to organismal systems and human diseases, and 17% belonged to metabolism ( sheet the same pathways). We also analyzed the discordant pathways and found that 24 pathways were specific to UC individuals vs. UC-S; of these, 15 pathways were categorized as metabolism. In the UC vs. Health-S group, the number of specifically changed pathways was 35, 24 of which belonged to metabolism ( sheet UC vs. UC-S-specific, sheet UC vs. Health-S-specific).
Figure 4. Heatmap of top 30 significantly changed class 3 pathways between two groups: (A) Health-S and UC; (B) UC-S and UC (n = 13 in Health, Health-S and UC groups, n = 12 in UC-S group).
3.3.2. Four pathways predicted from Faecalibacterium prausnitzii decreased in UC compared with the Health-S and UC-S groups
Of the 205 differentially expressed pathways between UC individuals and the Health-S groups, we detected four pathways that were decreased in the UC group: oxidative phosphorylation, starch and sucrose metabolism, amino sugar and nucleotide sugar metabolism, and bacterial secretion system, which could be predicted from Faecalibacterium prausnitzii (). Significant differences were observed between the UC and Health-S groups ().
Compared with the Health-S group, 20 pathways showed significant differences in the UC-S group, including 10 upregulated and 10 downregulated pathways (Supplementary Figure 3). Most of these pathways are involved in metabolism, signal transduction, organismal systems, and infection diseases. According to the KEGG pathways, the chlorocyclohexane and chlorobenzene degradation pathway, which increased in the Health-S group, was also associated with changes in gene expression and mainly involved Clostridium sp. FS41 level, which was also higher in the Health-S group.
3.4. Genes and enzymes of gut flora in UC couples did not vary significantly
3.4.1. There were no significant differences in the genes and enzymes between the UC-S and healthy individuals
According to the PCoA of genes by unweighted UniFrac, the regions of the Healthy, Health-S, and UC-S groups almost completely overlapped, whereas the distribution of the UC group was greater than that of the other three groups ().
Figure 5. PCoA of analysis of genes of all study participants. (n = 13 in Health, Health-S and UC groups, n = 12 in UC-S group).
3.4.2. Faecalibacterium related genes and enzymes were altered in UC couples
Further analysis of the above five pathways revealed that the abundance of five Faecalibacterium prausnitzii-related genes showed significant differences (Supplementary Table 3). CatB participates in the translation of muconate cycloisomerase (EC:5.5.1.1), which is part of the chlorocyclohexane and chlorobenzene degradation pathways. It was lower in the UC-S group than in the Health-S group. Ndh participates in ubiquinone reductase (EC:7.1.1.2), which is an essential component of oxidative phosphorylation. Additionally, glycogenphosphorylase/synthase (EC: 2.4.1.1/2.4.1.11), translated by K16153, is associated with starch and sucrose metabolism. Similarly, xynD is involved in amino sugar and nucleotide sugar metabolism by translating arabinoxylan arabinofuranohydrolase (EC:3.2.1.55). YajC encodes a subunit of preprotein translocase, which establishes the bacterial secretion system by secreting a strain of effective proteins into host cells that help bacteria escape immunological defense (). Overall, these four genes were overexpressed in the UC-S group compared to the UC group but showed no significant differences across the spouse groups.
Table 2. Information of altered genes.
4. Discussion
In this study, using paired and high-quality samples from individuals with UC and their healthy spouses, we applied an omics approach to improve our understanding of UC, especially in terms of cooperation between the host and the environment and functions of the gut microbiota. Heterosexual couples with UC share similar environments but different sex and disease status, while healthy couples share the same environment with the opposite sex.
Gut microbial diversity decreases in patients with UC, which coincides with our findings, and many differentially abundant species varied in this study are in line with previous findings. For instance, depletion in the abundance of Firmicutes and Clostridium and an increased abundance of Enterobacteriaceae have been reported [Citation17]. In the NLIBD cohort, the taxa reported to decrease in UC were mostly from the Bacteroidaceae family, and taxa that increased in UC were from the Lachnospiraceae family [Citation18]. Among these bacteria, Bifidobacterium, which is considered a probiotic in most studies, is one of the most important features in the development of IBD. However, Franzosa et al. reported that Bifidobacterium breve and Clostridium symbiosum were uniquely differentially and abundantly enriched in UC [Citation19]. In our study, Bifidobacterium increased 3.3-fold more in UC patients than in healthy controls. Even in the UC-S group, the composition of Bifidobacterium was 1.4-times higher than that in healthy controls. The probable reasons for these differences may be attributed to [Citation1] our small sample size and [Citation2] the fact that Bifidobacterium is a potent protective factor of mucosa protecting it from direct and indirect injuries of UC.
What differences do cohabitation make to the gut microbiome, particularly in couples with heterosexual UC? A previous social science study revealed that individuals who cohabitate in marriage and similar relationships had better health than unpartnered adults [Citation20]. Stress, behavior, and psychosocial resources are factors linked to these relationships with health status [Citation21]. A latent mechanism may be involved in the microbiome. When exposed to stable conditions, the microflora of an individual remains relatively stable. To a large extent, couples share similar diets, environments, daily routines, and psychological states. A notable study published in 2019 by a group of social scientists and microbiologists pointed out that spouses had similar microbes to their siblings or unrelated individuals, and this similarity was positively correlated with the length of the cohabitating marital relationship. Nevertheless, siblings are not similar to unrelated pairs due to beta-diversity [Citation15]. Thus, the authors concluded that marriage and cohabitation had a greater influence on individuals’ gut microbiota than early life environment or genetics. Closer personal relationships lead to higher diversity and common taxa in the gut microbiome [Citation15]. In contrast, previous studies have shown that genetic effects, although small, are correlated with similar microbial communities than unrelated individuals, regardless of current cohabitation status [Citation22]. Thus, the effects of cohabitation and genetics on gut microbiota have not been fully clarified.
Although marriage and cohabitation probably exert a great influence on the gut microbiome, spouses cohabitating with patients with UC do not experience the same disease. We designed this study based on 16sRNA amplicon and metagenomic sequencing for a more objective analysis of the species diversity of the gut microbiome community. The partial overlap of the PCoA diagram of bacteria and diversity of class 2 pathways illustrated that numerous bacteria and pathways decreased when compared with spouses of patients with UC and healthy couples. At the same time, the abundance of genes and enzymes in the UC-S group rarely changed compared to that in healthy couples.
In the analysis of pathways, focusing on UC spouses, we found that the changed number of class 2 pathways between the UC and UC-S groups was lower than that between the UC and Health-S groups, even though UC spouses were also healthy individuals, although this grouping eliminated differences in environmental influences between UC patients and healthy individuals to a certain extent. In particular, 205 class 3 pathways differed between UC and UC-S or between the UC and Health-S pair groups. Sex-specific and disease-specific effects exist between UC individuals and their spouses. Although the living conditions or environments differed between UC and Health-S pairs, 205 pathways were altered, most of which belonged to organismal systems and human diseases and reflected the influence of disease and sex on microbiome pathways in the gut. The remaining 24/35 differentially expressed pathways, mainly correlated with metabolism, reflect the influence of the environment on microbiome metabolism pathways.
The above findings might be attributed to the similar dietary habits, daily routine, life stress (financial stress, intensive work, sick child), and living conditions of the coinhabiting partners. Thus, couples who now share a peaceful living environment may experience irregular sleep patterns and higher levels of cortisol, which will affect their metabolism. Conversely, habitual intake of high-saturated fatty acid diets by unhappy couples may enhance gut permeability, leading to variations in the gut flora and an increased osmotic potential of inflammatory substances and toxins [Citation23]. Unfortunately, we did not record these sociological details or score the patients in this context, which makes it difficult to deduce causality between each factor in the gut microbiota. Similar research based on the American Gut Project inferred that the greatest, generalized sources of heterogeneity in human gut microbiota were host variances such as body mass index, sex, age, smoking status, alcohol intake, exercise, and dietary structure [Citation24]. Thus, elucidating the influence of gut microbiota on UC is difficult. Although couples live together, there may still be numerous differences based on host variance. However, in our study, we considered the composition and function of the gut microbiota in couples with UC. However, they still indicated some points.
Among the microbes differentially expressed between the UC and UC-S groups, a significantly depleted strain abundance in the beneficial species Faecalibacterium prausnitzii was observed. Machiels et al. found that F. prausnitzii in patients with UC was significantly lower than in controls. An inverse correlation was also identified between F. prausnitzii abundance and disease activity [Citation25]. A systematic review published last year also revealed that the amount of F. prausnitzii decreased in 6 of the 11 studies evaluated [Citation26]. A randomized controlled trial investigated the influence of diet on IBD patients and indicated that a diet low in fermentable oligosaccharides, disaccharides, monosaccharides, and polyols could reduce the abundance of F. prausnitzii, Bifidobacterium adolescentis, and B. longum, which are believed to regulate the immune response, but such a diet could not alter microbiome diversity or inflammatory markers compared with patients on a control diet [Citation27]. F. prausnitzii produces high concentrations of butyrate. The IBDMDB study showed that the reduction in butyrate levels was consistent with the depletion of F. prausnitzii and R. hominis [Citation28]. Notably, the four Faecalibacterium prausnitzii-related pathways that were shown to decline in UC individuals compared with UC-S were all related to energy metabolism. Although early studies on genes and pathways associated with IBD did not provide any evidence supporting changes in these five pathways, we can still infer that F. prausnitzii and these pathways are probably correlated with IBD itself but not with other disease features. Given the small sample size, the results could not be inferred on a large scale. However, spouse-matched groups and metagenomic analyses were performed to explore the effects of the gut microbiota on UC. These defects will inspire further research in the future.
5. Conclusions
Our study revealed that cohabitation influenced differences in the gut flora microbiome community between UC patients and healthy individuals, not only by reducing microbiome composition and diversity but also by their signaling pathways. Firmicutes, Faecalibacterium and four related pathways may be associated with the pathological status of the host rather than with human behavior or their environment. This finding strongly suggests that Faecalibacterium and the four related pathways may represent key therapeutic targets for improving UC or even IBD.
Authors’ contributions
Dr. Chen Li and Xiaoyan Guo performed the data analyses, interpreted the data, and drafted the manuscript. Dr. Xiaoyan Guo recruited patients and collected samples and data. They have contributed equally to this work. Prof. Yan He interpreted the data and consulted the study. Prof. Jing Wang provided support for this experimental study. Prof. Xinjuan Liu and Jianyu Hao proposed the concept and designed the study. All authors assisted in writing and reviewing the manuscript and approved its final version.
Supplemental Material
Download Zip (1.6 MB)Acknowledgments
The authors wish to thank all patients and volunteers who provided fecal samples for this study.
Disclosure statement
The authors declare that this research was conducted in the absence of any commercial or financial relationships that could be construed as potential conflicts of interest.
Data availability statement
The data that support the findings of this study are available from the corresponding author, XL, upon reasonable request.
Additional information
Funding
References
- Jiao N, Ke X, Zhu L, et al. Evidence challenging the causal role of gut microbiota in inflammatory bowel diseases. Gastroenterol Rep. 2023;11:1. doi: 10.1093/gastro/goad064
- Hibi T, Takagi H. Ulcerative colitis. Ryoikibetsu Shokogun Shirizu. 2000;(31):204–12.
- Yang L, Tang S, Baker SS, et al. Difference in pathomechanism between Crohn’s disease and ulcerative colitis revealed by Colon transcriptome. Inflamm Bowel Dis. 2019;25(4):722–731. doi: 10.1093/ibd/izy359.
- Wlodarska M, Kostic AD, Xavier RJ. An integrative view of microbiome-host interactions in inflammatory bowel diseases. Cell Host Microbe. 2015;17(5):577–591. doi: 10.1016/j.chom.2015.04.008.
- Hegazy AN, Powrie F. Microbiome. Microbiota RORgulates intestinal suppressor T cells. Science. 2015;349(6251):929–930. doi: 10.1126/science.aad0865.
- Shanahan F. The colonic microbiota in health and disease. Curr Opin Gastroenterol. 2013;29(1):49–54. doi: 10.1097/MOG.0b013e32835a3493.
- Gophna U, Sommerfeld K, Gophna S, et al. Differences between tissue-associated intestinal microfloras of patients with crohn’s disease and ulcerative colitis. J Clin Microbiol. 2006;44(11):4136–4141. doi: 10.1128/JCM.01004-06.
- Paramsothy S, Nielsen S, Kamm MA, et al. Specific bacteria and metabolites associated with response to fecal microbiota transplantation in patients with ulcerative colitis. Gastroenterology. 2019;156(5):1440–1454.e2. doi: 10.1053/j.gastro.2018.12.001.
- Atarashi K, Tanoue T, Oshima K, et al. Treg induction by a rationally selected mixture of clostridia strains from the human microbiota. Nature. 2013;500(7461):232–236. doi: 10.1038/nature12331.
- Round JL, Mazmanian SK. Inducible Foxp3+ regulatory T-cell development by a commensal bacterium of the intestinal microbiota. Proc Natl Acad Sci U S A. 2010;107(27):12204–12209. doi: 10.1073/pnas.0909122107.
- Hu S, Vich Vila A, Gacesa R, et al. Whole exome sequencing analyses reveal gene-microbiota interactions in the context of IBD. Gut. 2021;70(2):285–296. doi: 10.1136/gutjnl-2019-319706.
- Schirmer M, Garner A, Vlamakis H, et al. Microbial genes and pathways in inflammatory bowel disease. Nat Rev Microbiol. 2019;17(8):497–511. doi: 10.1038/s41579-019-0213-6.
- Halfvarson J, Brislawn CJ, Lamendella R, et al. Dynamics of the human gut microbiome in inflammatory bowel disease. Nat Microbiol. 2017;2(5):17004. doi: 10.1038/nmicrobiol.2017.4.
- Zimmer J, Lange B, Frick JS, et al. A vegan or vegetarian diet substantially alters the human colonic faecal microbiota. Eur J Clin Nutr. 2012;66(1):53–60. doi: 10.1038/ejcn.2011.141.
- Dill-McFarland KA, Tang ZZ, Kemis JH, et al. Close social relationships correlate with human gut microbiota composition. Sci Rep. 2019;9(1):703. doi: 10.1038/s41598-018-37298-9.
- Magro F, Gionchetti P, Eliakim R, et al. Third European evidence-based consensus on diagnosis and management of ulcerative colitis. Part 1: definitions, diagnosis, extra-intestinal manifestations, pregnancy, cancer surveillance, surgery, and ileo-anal pouch disorders. J Crohns Colitis. 2017;11(6):649–670. doi: 10.1093/ecco-jcc/jjx008.
- Scanlan PD, Shanahan F, O’Mahony C, et al. Culture-independent analyses of temporal variation of the dominant fecal microbiota and targeted bacterial subgroups in Crohn’s disease. J Clin Microbiol. 2006;44(11):3980–3988. doi: 10.1128/JCM.00312-06.
- Vich Vila A, Imhann F, Collij V, et al. Gut microbiota composition and functional changes in inflammatory bowel disease and irritable bowel syndrome. Sci Transl Med. 2018;10(472):eaap8914. doi: 10.1126/scitranslmed.aap8914.
- Franzosa EA, Sirota-Madi A, Avila-Pacheco J, et al. Gut microbiome structure and metabolic activity in inflammatory bowel disease. Nat Microbiol. 2019;4(2):293–305. doi: 10.1038/s41564-018-0306-4.
- Robles TF, Kiecolt-Glaser JK. The physiology of marriage: pathways to health. Physiol Behav. 2003;79(3):409–416. doi: 10.1016/S0031-9384(03)00160-4.
- Umberson D, Crosnoe R, Reczek C. Social relationships and health behavior across the life course. Annu Rev Sociol. 2010;36(1):139–157. doi: 10.1146/annurev-soc-070308-120011.
- Goodrich JK, Waters JL, Poole AC, et al. Human genetics shape the gut microbiome. Cell. 2014;159(4):789–799. doi: 10.1016/j.cell.2014.09.053.
- Brito IL, Gurry T, Zhao S, et al. Transmission of human-associated microbiota along family and social networks. Nat Microbiol. 2019;4(6):964–971. doi: 10.1038/s41564-019-0409-6.
- Vujkovic-Cvijin I, Sklar J, Jiang L, et al. Host variables confound gut microbiota studies of human disease. Nature. 2020;587(7834):448–454. doi: 10.1038/s41586-020-2881-9.
- Machiels K, Joossens M, Sabino J, et al. A decrease of the butyrate-producing species roseburia hominis and faecalibacterium prausnitzii defines dysbiosis in patients with ulcerative colitis. Gut. 2014;63(8):1275–1283. doi: 10.1136/gutjnl-2013-304833.
- Pittayanon R, Lau JT, Leontiadis GI, et al. Differences in gut microbiota in patients with vs without inflammatory bowel diseases: a systematic review. Gastroenterology. 2020;158(4):930–946.e1. doi: 10.1053/j.gastro.2019.11.294.
- Cox SR, Lindsay JO, Fromentin S, et al. Effects of low FODMAP diet on symptoms, fecal microbiome, and markers of inflammation in patients with quiescent inflammatory bowel disease in a randomized trial. Gastroenterology. 2020;158(1):176–188.e7. doi: 10.1053/j.gastro.2019.09.024.
- Lloyd-Price J, Arze C, Ananthakrishnan AN, et al. Multi-omics of the gut microbial ecosystem in inflammatory bowel diseases. Nature. 2019;569(7758):655–662. doi: 10.1038/s41586-019-1237-9.