Abstract
Following up on original descriptions of clustering of cardiovascular risk factors (chiefly, glucose intolerance, dyslipidaemia and hypertension) around the presence of insulin resistance, the metabolic syndrome has recently been upgraded to the status of a disease entity with an inherent predictive value for cardiovascular disease. In pathophysiological terms, insulin resistance (of glucose metabolism) and the attendant compensatory hyperinsulinaemia are causally related to each of glucose intolerance, dyslipidaemia, high blood pressure and vascular dysfunction. The physiological mechanisms are concisely reviewed here. However, insulin resistance/hyperinsulinaemia alone is insufficient to cause these abnormalities, for which other pathogenic factors (e.g. ß‐cell dysfunction for glucose intolerance) are required. The metabolic syndrome, on the other hand, has evolved from a set of statistical associations believed to carry an excess of cardiovascular risk. In the various existing definitions, a mixture of physical, metabolic and clinical variables have been used on grounds of predictive value or practical ease. These variables belong to different phenotypes, which are upstream, intermediate and proximal, respectively, in their relation to clinical disease. The resulting ‘syndromes’ usually lack a cogent conceptual structure, may reflect the particular data set from which they are extracted and may be of limited applicability. While overt diabetes, clinical hypertension and frank dyslipidaemia are often present together in the same patient, a subclinical syndrome with a distinct, probable aetiology and a proven power as a risk indicator remains to be identified.
| Abbreviations | ||
| Akt | = | atypical protein kinase C |
| ATPase | = | adenosin‐trisphosphatase |
| BMI | = | body mass index |
| FFA | = | free fatty acids |
| HDL | = | high‐density lipoprotein cholesterol |
| HSL | = | hormone‐sensitive lipase |
| IRS‐1 | = | insulin receptor substrate‐1 |
| LDL | = | low‐density lipoprotein cholesterol |
| L‐NMMA | = | L‐monomethyl‐arginine |
| LPL | = | lipoprotein lipase |
| MAPK | = | mitogen‐activated protein kinase |
| MODY | = | maturity‐onset diabetes of the young |
| NO | = | nitric oxide |
| PET | = | positron‐emission tomography |
| PI3‐kinase | = | phosphatidylinositol‐3‐kinase |
Introduction
The ‘metabolic syndrome’, as we currently know it, was born as ‘the insulin resistance syndrome’ into the diabetes family before an arranged marriage to the cardiology family. In fact, in 1988 Reaven Citation1, capitalizing on previous scattered evidence as well as studies from his own laboratory, formalized the concept that insulin resistance clusters with glucose intolerance, dyslipidaemia and hypertension to enhance cardiovascular risk. The pathophysiological basis for this clustering was in part clear, in part uncertain and, at that time as well as today, still under active investigation. In Reaven's formulation, there was no predicament that the insulin resistance syndrome was a disease entity with a distinct aetiology and a characteristic clinical phenotype, nor was there any claim that insulin resistance was specifically and uniquely causing each of the component abnormalities. Once taken up into a larger scientific community (mostly cardiology but also epidemiology, gynaecology, etc.), the syndrome acquired more components (from visceral obesity, to hypercoagulation, to microalbuminuria to polycystic ovaries), with somewhat looser links with insulin resistance. Under the pressure of eminent scientific societies and the pharmaceutical industry, the syndrome was upgraded to disease status with threshold‐based definitions, certified with a classification code (first in the U.S., next in Europe) and then propelled into the clinical arena worldwide. The role, actual or potential, of insulin resistance got diluted if not tacitly dismissed, and the shift in focus was sealed by renaming the syndrome ‘the metabolic syndrome’.
This sketch of historical perspective may be useful to spell out the scope of the present discussion: insulin resistance is not (and could not be) the sole cause of the metabolic syndrome components but remains one well characterized pathophysiological mechanism to explain the appearance of several of them and a powerful transducer of environmental influences. What follows is a concise specification of such mechanisms.
Key messages
Insulin resistance and the attendant compensatory hyperinsulinaemia are causally related to glucose intolerance, dyslipidaemia, high blood pressure and vascular dysfunction.
However, insulin resistance alone is insufficient to cause these abnormalities, for which other pathogenic factors are required.
While overt diabetes, clinical hypertension and frank dyslipidaemia are often present together in the same patient, a subclinical syndrome with a distinct, probable aetiology and a proven power as a risk indicator remains to be identified.
Insulin resistance: General systems feature
For many protein and non‐protein hormones, action is modulated by at least one, often two, hierarchical feedback paths (e.g. corticotropin‐releasing hormone and adrenocorticotropic hormone for cortisol, gonadotrophin‐releasing hormone and gonadotrophins for sex steroids). Sensitivity is provided by the circulating hormone concentrations acting upon specific hormone receptors located on target tissues as well as on the companion gland of the feedback loop. In the case of insulin, there is no major pituitary or hypothalamic relay; target tissues control secretion directly by determining the level of positive and negative stimuli. Thus, the circulating concentrations of substrates (mostly glucose, but also amino acids, free fatty acids (FFA) and ketone bodies), which result from insulin action on intermediary metabolism in different tissues, feed back to the β‐cell. Sensitivity gating is provided by insulin receptors on target tissues; some degree of autoregulation is given by insulin receptors on the β‐cell itself. Possibly as a consequence of the peculiar system design, insulin resistance is a relatively common phenomenon. Insulin exerts multiple actions on many cell types, but the primary servo‐regulated signal for insulin release is the plasma glucose concentration. According to this construct, insulin resistance is a reduced sensitivity to insulin stimulation of glucose uptake and/or production, which the β‐cell senses through elevated plasma glucose levels. Consequently, insulin resistance is conventionally defined as an abnormal glucose turnover in the face of normal or raised glucose and insulin concentrations. Insulin sensitivity is set not only by the number and affinity of the insulin receptors but also by the functional state of the intracellular signalling pathways that transduce insulin binding to the various effectors (e.g. glucose transport, phosphorylation and oxidation, glycogen synthesis, lipolysis and ion exchange). Therefore, a massive reduction in the number of insulin receptors (or the presence of high titres of circulating anti‐insulin or anti‐insulin‐receptor autoantibodies) is associated with a form of insulin resistance that is generalized and extreme (i.e. all pathways are involved). These are, however, rare cases. More commonly, cellular resistance of the glucose pathway is caused by a malfunction of the signal transduction machinery. The various insulin effectors are, at least in part, independent of one another. As a consequence, cellular insulin resistance can vary in degree and pathway‐specificity. In addition, resistance in the glucose pathway reinforces the insulin signal to other pathways (e.g. protein turnover) via stimulation of insulin release. To the extent that they have preserved their sensitivity, other pathways may be overly stimulated by the compensatory hyperinsulinaemia. The pathophysiologic implication of this phenomenon is that, in insulin‐resistant states any abnormality that is found to be associated with altered glucose metabolism (e.g. dyslipidaemia, higher blood pressure, platelet hypercoagulation, or prothrombotic changes) theoretically can be the result of either the insulin resistance itself or the chronic effects of the attendant hyperinsulinaemia (or both).
Definition and measurement of insulin resistance
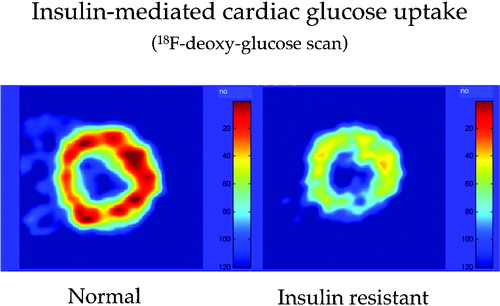
In general, the relationship between concentration and action of a hormone is sigmoidal, i.e. the response is sluggish in the low concentration range, then rises in an approximately linear manner eventually to taper off to saturation. Mathematically, this kind of dose‐response relationship can be approximated by a Michaelis‐Menten equation, in which sensitivity is expressed by the ratio Vmax/Km (where Vmax is the maximal effect and Km is the hormone concentration at which the effect is half‐maximal). In the case of insulin, this ratio can be abnormally decreased because of a higher Km of insulin‐mediated glucose uptake, without (e.g. in obese, normotolerant subjects) or with a simultaneous reduction in Vmax (e.g. patients with type 2 diabetes). With regard to insulin resistance of glucose production, there is always a dose of exogenous insulin that will shut off endogenous glucose release completely, so that hepatic insulin resistance can always be reduced to a Km problem. In in vivo human studies, only rarely is a full dose‐response function experimentally determined; insulin resistance is therefore defined as an abnormal whole body glucose uptake (or suppression of endogenous glucose release) at given concentrations of substrate (glucose) and stimulus (insulin). Steady‐state techniques – such as the glucose clamp Citation2 – have become the gold standard for quantifying insulin resistance; non‐steady‐state techniques have also been validated Citation3. The same definition also applies to regional measurements, where glucose balance is estimated by input‐output analysis (i.e. catheter measurements of arterio‐venous glucose gradient and organ blood flow Citation4) or by external detection (i.e. short‐lived glucose isotopes and PET Citation5) ().
Figure 1. Myocardial muscle is insulin‐sensitive. Whereas free fatty acids (FFA) represent the dominant fuel for cardiac muscle in the fasting state, an increase in circulating insulin concentrations inhibits lipolysis, thereby restraining FFA availability and promoting glucose uptake. By using 18F‐deoxyglucose (FDG), an analog of glucose (which is transported and phosphorylated in the same manner as D‐glucose but not further metabolized) labelled with a short‐lived radioactive isotope of fluorine (18F), positron‐emission tomography (PET) detects a signal that is proportional to the rate of myocardial glucose uptake. The figure shows FDG images of human heart muscle during a euglycaemic insulin clamp. On the left hand is a cross‐sectional scan of the left ventricular wall of a normal subject, on the right hand that of an insulin resistant patient with type 2 diabetes, both taken during a euglycaemic hyperinsulinaemic (1 mU.min−1. kg−1) clamp. The colour‐coded tracer uptake intensity indicates diffuse myocardial insulin resistance in the diabetic patient.
Insulin resistance and glucose intolerance
By combining tracer and clamp techniques with other methods (such as indirect calorimetry, triple tracer techniques, etc.), much information has been gained on in vivo insulin resistance. It can be summarized as follows:
At the whole body level, insulin resistance of glucose uptake is characterized by a reduction in both glucose oxidation and non‐oxidative glucose disposal (mainly, glycogen synthesis) Citation6.
The emergence of hyperglycaemia compensates for insulin resistance and can restore glucose uptake; intracellular glucose disposition, however, remains abnormal Citation7.
In skeletal muscle, insulin resistance is associated with impaired inward transmembrane glucose transport Citation8.
In the liver, insulin resistance is manifested as increased gluconeogenesis without (e.g. in obesity and type 2 diabetes) or with inappropriately suppressed glycogenolysis (in type 2 diabetes) Citation9 and impaired liver glucose uptake Citation10.
In adipose tissue, whether in subcutaneous or visceral depots, insulin resistance is manifested as reduced insulin‐mediated glucose uptake, roughly in proportion to the degree of insulin resistance present in skeletal and myocardial muscle Citation11.
The chronic hyperinsulinaemia that is elicited in response to insulin resistance downregulates insulin action Citation12.
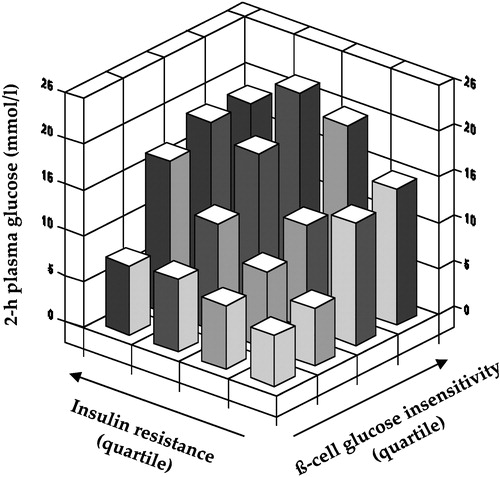
From these established facts it follows that insulin resistance cannot be said just to cluster with glucose intolerance or overt diabetes, but is a physiological mechanism for them: by impeding glucose entry into target cells, by sustaining inappropriate glucose release by the liver and by engendering hyperinsulinaemia, insulin resistance begets glucose intolerance. Strictly speaking, glucose tolerance begins to decline only when ß‐cell insulin secretion fails to cope with the extant insulin resistance; also, hyperglycaemia can result from pure ß‐cell insufficiency, as is the case of type 1 diabetes and maturity‐onset diabetes of the young (MODY) variants due to glucokinase deficiency. However, it should be understood that in many insulin resistant individuals with categorically normal glucose tolerance (e.g. many obese subjects) glucose excursions following an oral glucose load are slightly higher than in matched individuals with preserved insulin sensitivity. Also, chronic hyperglycaemia itself impairs insulin sensitivity Citation12, such that even in subjects with a primary, severe deficit in ß‐cell function (e.g. type 1 diabetic patients) insulin sensitivity is usually impaired through gluco‐toxic mechanisms Citation13. Finally, and perhaps more importantly, the relationship between insulin action and ß‐cell function is highly non‐linear, such that even small decrements in the ability of the ß‐cell to sense glucose result in impaired glucose tolerance when coupled with insulin resistance Citation14 ().
Figure 2. Independent contribution of insulin resistance of glucose uptake andß‐cell glucose insensitivity to 2‐hour plasma glucose concentrations in subjects spanning the range from normal glucose tolerance to overt diabetes (redrawn from reference Citation14).
Insulin resistance and lipid metabolism
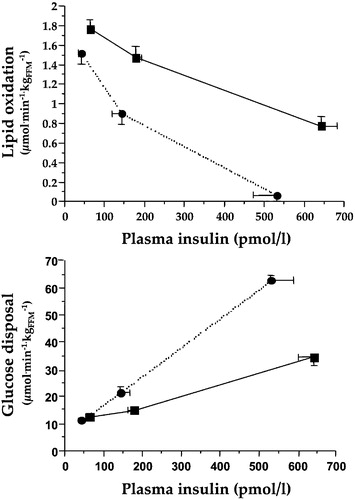
Insulin restrains lipolysis in adipose tissue very effectively (by inhibiting HSL) at the same time as it promotes the transfer of FFA from circulating lipoproteins to tissues (by activating LPL). At high doses and with very large glucose loads, insulin also stimulates de novo lipogenesis from carbohydrate. In insulin‐resistant individuals, adipose tissue lipolysis is relatively unrestrained and FFA removal from the circulation is impeded. These changes in FFA flux translate into inappropriately high plasma FFA concentrations coupled with raised serum triglyceride levels throughout the day Citation15. Because FFA are taken up mostly in proportion to their plasma concentration, an FFA overload has metabolic consequences both in peripheral tissues and the liver. In the former, they compete with glucose for uptake and oxidative utilization, thereby compromising glucose tolerance Citation16–20 (). In the liver, they are in part oxidized – thereby fuelling gluconeogenesis Citation16 – in part reincorporated into triglyceride‐rich lipoproteins and exported into the circulation Citation21. In both peripheral tissues and liver, excess FFA end up in ectopic fat depots Citation22,23. In addition, the entire lipoprotein delipidation cascade is disturbed in such a way that HDL‐cholesterol concentrations fall and the LDL‐cholesterol pool becomes enriched with small, dense, highly atherogenic LDL particles Citation24. This main chain of consequences of insulin resistance sprouts several other potentially pathogenic changes, such as FFA‐mediated impairment of endothelial function Citation25 and ß‐cell function Citation26, the full clinical significance of which is still uncertain.
Figure 3. Dose‐response curves for whole body lipid oxidation rates (top) and whole body glucose disposal rates (bottom) during euglycaemic clamping over the physiologic range of plasma insulin concentrations in insulin sensitive (dotted lines) and insulin resistant non‐diabetic subjects (full lines). Higher lipid oxidation is associated with reduced insulin‐mediated glucose disposal, i.e. insulin resistance.
In summary, as is the case with glucose intolerance, available evidence unequivocally indicates that insulin resistance does not simply cluster with dyslipidaemia, but rather is a physiological mechanism for the typical dyslipidaemia of the metabolic syndrome, i.e. the combination of impaired suppressibility of circulating FFA, raised serum triglycerides and depressed HDL‐cholesterol levels, abundance of small, dense LDL particles and lipid accumulation in liver and muscle tissues.
Insulin resistance and thermogenesis
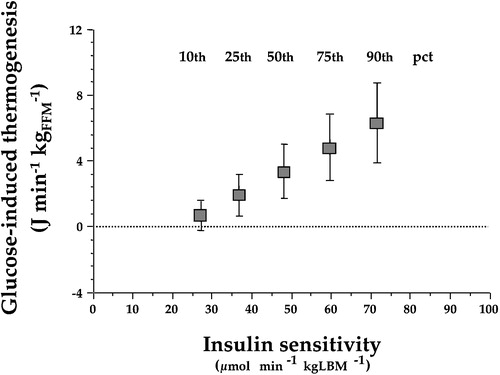
By virtue of its opposing actions on glucose utilization (stimulation) and FFA delivery (suppression), insulin causes a prompt and drastic switch in substrate oxidation, from fat to carbohydrate. This process can be monitored in vivo by the use of indirect calorimetry. The substitution of fat by carbohydrate is not energetically neutral. The energy requirements of re‐esterifying FFA and storing glucose as glycogen in muscle and liver are met by glucose oxidation, which increases in excess of the concomitant reduction in lipid oxidation. The result is a measurable increase in energy expenditure, i.e. increased thermogenesis. Insulin‐induced thermogenesis can be standardized as the change in energy expenditure observed during steady‐state conditions of euglycaemic hyperinsulinaemia (in which case it is termed glucose‐induced thermogenesis). Glucose‐induced thermogenesis is depressed in insulin resistant individuals in direct proportion to the resistance in glucose uptake and utilization because of the relative inability of the hormone to stimulate glucose oxidation Citation27 (). Thus, defective thermogenesis is frequently observed in obese non‐diabetic subjects and in patients with type 2 diabetes, in whom it provides a physiological explanation for their resistance to weight loss when on a calorie‐restricted regimen.
Figure 4. Point estimates of glucose‐induced thermogenesis at different percentiles (pct) of insulin sensitivity in 322 non‐diabetic subjects after statistical adjustment by gender, age, and body mass index. Insulin‐resistant subjects show a defect in glucose‐induced thermogenesis that is proportional to the degree of insulin resistance (redrawn from reference Citation27).
Insulin resistance and blood pressure
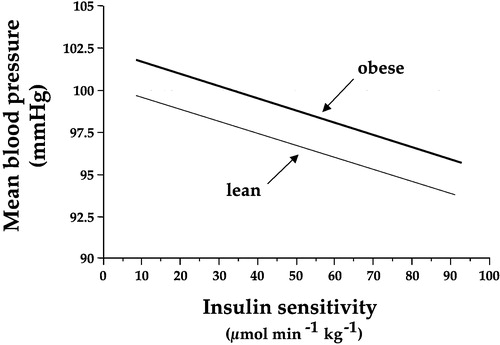
Patients with essential hypertension are often insulin resistant Citation28. This feature of essential hypertension is the extension of a physiologic link into the disease domain. In fact, insulin resistance is associated with higher blood pressure levels in the normotensive population even after controlling for gender and age Citation29 (). Multiple mechanisms have been shown to subtend this association Citation30. In brief:
Even under conditions of euglycaemia, exogenous insulin infusion causes a dose‐dependent rise in heart rate and plasma noradrenaline concentrations; these signs of adrenergic activation are accompanied by increased cardiac output and increased urinary catecholamine excretion. In accordance with these actions of insulin, obese non‐diabetic subjects under free‐living conditions go through periods of adrenergic overactivity in phase with their post‐prandial hyperinsulinaemia.
Insulin is an antinatriuretic hormone both under conditions of forced water diuresis and under normal circumstances.
Insulin causes hypokalaemia through potassium transfer from the extracellular fluid compartment into cells (both hepatocytes and striated muscle) and potassium loss into the urine (by exchange with sodium at the level, most probably, of the distal nephron).
Insulin reduces free water clearance through the kidney.
It is important to stress that none of these actions of insulin per se raises arterial blood pressure under acute in vivo circumstances (as is the case for aldosterone). However, it is likely that chronic hyperinsulinaemia may initiate or sustain high blood pressure because none of the insulin effects on the autonomic nervous system or the kidney is insulin resistant in insulin resistant subjects, i.e. in subjects with insulin resistance in the glucose pathway. How much and in what time‐course an increased antinatriuretic pressure and adrenergic stimulation by insulin contributes to a higher blood pressure regime is not known.
Figure 5. The graph shows the significant inverse relationship between mean arterial blood pressure and insulin sensitivity(as measured by the clamp technique) in 450 non‐diabetic subjects in the European Group for the Study of Insulin Resistance (EGIR) cohort. The regression lines are adjusted by gender and age, and are drawn across the observed range of insulin sensitivity. The lower line (lean) is the predicted relationship in a subject with a body mass index of 25 kg/m2, whereas the upper line (obese) is the function for an individual with a body mass index of 35 kg/m2. Obesity and insulin resistance work together to raise arterial blood pressure Citation29.
Insulin resistance and the vascular system
Insulin is not primarily a vasoactive hormone but does exert physiologically important actions on the vasculature:
Insulin induces direct dilatation of peripheral (forearm, leg, or calf) vasculature as a function of exposure (dose of insulin times length of exposure). Over the physiologic range of insulin exposure, the average vasodilatory response is in the range 15% to 30% Citation31. This effect is blunted in insulin‐resistant individuals, notably, in patients with type 2 diabetes.
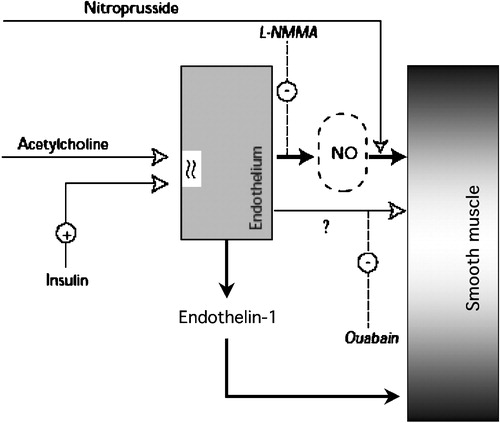
When infused locally (i.e. through the brachial artery) at physiologic doses, insulin potentiates acetylcholine‐induced, but not nitroprusside‐induced, vasodilatation both in normotensive patients and in patients with essential hypertension Citation32. This suggests that insulin vasodilatation is an endothelium‐dependent phenomenon. Insulin receptors are present on endothelial as well as on smooth muscle cells; thus, both types of cells are targets for insulin action. As insulin‐induced vasodilatation Citation33 and insulin potentiation of acetylcholine‐induced vasodilatation Citation32 can be blocked by L‐monomethyl‐arginine (L‐NMMA), a competitive inhibitor of NO synthase, the mechanism involves NO release from the endothelium. Direct provision of NO (e.g. with nitroprusside) bypasses the endothelial step. Furthermore, both insulin‐induced vasodilatation and insulin potentiation of acetylcholine‐induced vasodilatation can be blocked by ouabain, an inhibitor of sodium‐potassium ATPase, suggesting that cell membrane hyperpolarization is an additional or vicarious mechanism for this action of insulin Citation34. Such insulin‐induced hyperpolarization can be exerted directly on the smooth muscle cell or involve the release of an unidentified hyperpolarizing factor from the endothelium ().
The potentiating effect of insulin has been shown to be similar in healthy patients and hypertensive patients (who are resistant to the effect of insulin on glucose uptake), suggesting that the vascular actions and the metabolic effects of insulin can be independent of each other.
Insulin also induces the release of endothelin‐1, a potent vasoconstrictor, from endothelial cells. Interestingly, the intracellular signalling pathways for the release of NO and endothelin‐1 are distinct: the former follows the IRS‐1→PI3‐kinase→Akt route (which is shared by the glucose transport activation mechanism), the latter uses mitogen‐activated protein kinase (MAPK) pathway (in common with other proliferative actions of the hormone) Citation35. Under any given condition, the vessel lumen diameter is the algebraic sum of these two main opposing forces. By our current understanding of these phenomena, defects in the IRS‐1→PI3‐kinase→Akt signalling pathway are associated with both insulin resistance of glucose metabolism and impaired NO release, whereas endothelin‐1 release proceeds unabated through an intact MAPK pathway, resulting in a preponderant vasoconstrictive effect Citation36.
Spectral analysis of heart rate variability provides information on the autonomic nervous control of cardiac function. Total spectral power reflects parasympathetic and adrenergic inputs related to baroreflex control of heart rate. Under euglycaemic clamp conditions, insulin causes a prompt, marked decline in total spectral power, which is temporally and quantitatively unrelated to insulin stimulation of glucose disposal Citation37. This effect is partially independent of changes in heart rate, and therefore reflects direct desensitization of the autonomic neural reflex arch. In addition, the effect is more marked on the parasympathetic component of the autonomic arch (parasympathetic withdrawal), thereby giving rise to relative sympathetic dominance. Importantly, because vascular baroreceptor inputs are relayed through the central nervous system the desensitizing effect of insulin may also involve the central nervous system. Insulin can cross the blood‐brain barrier (by a process of transcytosis) in the periventricular area, thereby binding to specific receptors on neurons in the arcuate and paraventricular nuclei (among many other areas). These nuclei then send inhibitory impulses to the vagus and excitatory impulses to the sympathetic nuclei (in the locus caeruleus). This reaction is accompanied by release of corticotropin‐releasing hormone, which orchestrates a response including stimulation of cortisol and prolactin release, and depression of growth hormone and thyroid‐stimulating hormone Citation38. Thus, even in the absence of hypoglycaemia, the cardiovascular system responds to acute insulin administration with a moderate stress reaction Citation39.
In insulin sensitive individuals, insulin displays anti‐aggregant properties by virtue of its effect to lower intracellular calcium concentrations in platelets Citation40. This effect is blunted in insulin resistant subjects.
Insulin prolongs the QTc interval: this effect is acute, independent of glucose metabolism, proportional to the hypokalaemic action and possibly related to a direct hyperpolarizing effect on cardiomyocytes Citation41.
Figure 6. Diagram summarizing the dual vascular action of insulin. Through its receptors on the plasma membrane of endothelial cells, insulin stimulates the release of nitric oxide(NO, blocked by L‐NMMA and bypassed by direct provision of NO by nitroprusside) and a putative hyperpolarizing factor (blocked by oaubain), leading to vasodilatation; simultaneously, the release of endothelin‐1 contributes to maintain a vasoconstrictive tone.
In summary, under physiological circumstances of acute euglycaemic insulin stimulation the multiple influences exerted by the hormone on cellular ion exchange (sodium, potassium, calcium), NO and endothelin‐1 release, and central control of autonomic nervous system activities translate into a haemodynamic state characterized by: slight reduction in blood volume, increased stroke volume and heart rate, moderately increased pulse pressure and reduced total peripheral vascular resistances. The presence of defective insulin signalling in the PI3‐kinase pathway – together with the compensatory hyperinsulinaemia acting unopposed on PI3‐kinase‐independent pathways – translates into a haemodynamic/vascular set in which the ‘positive’ effects may be overridden by the ‘negative’ effects. In chronic conditions of insulin resistance, the actual impact of such imbalance on the function and structure of the vasculature is unknown and difficult to predict on the basis of the acute effects.
Insulin resistance and obesity
Obesity (as the BMI or total adiposity) is reciprocally related to insulin sensitivity. When total insulin‐mediated glucose uptake is normalized by lean body mass (i.e. the mass of glucose‐utilizing tissues), insulin sensitivity declines quasi‐linearly with BMI equally in men and women (by∼1 µmol min‐1 kgFFM‐1 per BMI unit) Citation42. However, the scatter around such a regression line is quite large, such that there are many obese individuals who have normal insulin sensitivity and, conversely, there are lean subjects who are insulin resistant. Over the last few years, a wealth of clinical studies have shown a separate impact of fat distribution on insulin action. Thus, accumulation of fat in abdominal viscera Citation43 and the mediastinum Citation44 has been reported to be strongly associated with insulin resistance independently of total adiposity. However, fat excess in subcutaneous depots is also associated with insulin resistance Citation43; furthermore, whether the link between visceral adiposity and insulin resistance is causal in nature or stands for a common underlying mechanism is still controversial Citation43,Citation45. All in all, the available evidence is consistent with the notion that predominant fat deposition in abdominal viscera does make a sizeable independent contribution to insulin resistance at BMIs in the overweight range (<30 kg/m2), while such contribution becomes weaker in frankly obese subjects. Visceral fat excess also associates with other features, such as raised blood pressure Citation44, independently of insulin resistance. Finally, it is worth mentioning that excess fat tissue, even when insulin resistant, nonetheless represents a sink for glucose, whence the expanded body mass of the moderately obese person compensates for the reduced insulin sensitivity and contributes to the maintenance of glucose tolerance Citation11. Physical activity, on the other hand, is a strong determinant of insulin sensitivity Citation46 and cardiorespiratory fitness is a potent predictor of metabolic and cardiovascular risk Citation47,48.
Conclusions
Physiologically, insulin influences numerous metabolic pathways in glucose homeostasis, lipid turnover, blood pressure control and vascular reactivity, in that order of effect size (at least under acute conditions). Therefore, the emergence of insulin resistance, by itself and/or through the attendant chronic hyperinsulinaemia, is causally related to glucose intolerance, dyslipidaemia, hypertension and vascular dysfunction. During evolution, insulin control of glucose levels has become the dominant function of insulin; for this reason, the cause‐effect relationship between insulin resistance and glucose intolerance is the tightest one. However, just as insulin resistance alone is insufficient to alter glucose tolerance, for which a degree of ß‐cell failure is required, insulin resistance/hyperinsulinaemia cannot be considered to be either strictly necessary or sufficient to alter lipid metabolism, blood pressure or vascular function. These homeostatic systems are under multifactorial, redundant control, and defects in one or more steps of their effector pathways may be necessary to drive the system out of the normal state. Indeed, a primary defect in a specific pathway, for example, a genetic deficiency in glucokinase or LPL expression, can be enough to impair glucose tolerance or triglyceride metabolism, respectively, and at the same time induce insulin resistance secondarily (by gluco‐toxicity or substrate competition, respectively): the resulting pathophysiological picture would be indistinguishable from one of primary insulin resistance. Only molecular and genetic analysis of critical metabolic steps would delineate the correct sequence of events in each case and define the true aetiology.
In a restricted sense, the presence of insulin resistance can be equated with a syndrome: in a network of physiological interactions, pulling one node or arm out of the normal state will drag other nodes and arms into the pathological range or just below it. A pathophysiological syndrome will result, with a composition and, consequently, a clinical phenotype rather variable from case to case. Very plausibly, such a pathophysiological cluster centred on insulin resistance may signal an enhanced cardiovascular risk Citation1,Citation49.
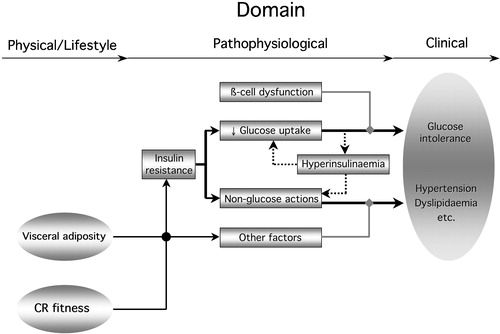
The metabolic syndrome, on the other hand, has evolved from different premises and purports to serve a different function. Essentially, a set of statistical associations has been construed to constitute a distinct clinical syndrome carrying an excess of cardiovascular risk. In the various existing definitions, a mixture of physical, metabolic and clinical variables has been adopted (or dropped) on grounds of predictive value or practical ease. Thus, it is not surprising that the results have been variable and the clinical usefulness rather below expectation Citation50. For example, a definition using BMI, hyperinsulinaemia and dyslipidaemia (raised triglycerides and/or low HDL cholesterol) uses a physical (or lifestyle) factor (obesity), a pathophysiological element (hyperinsulinaemia) and a clinical variable (serum lipids). These components belong to different phenotypes, which are upstream, intermediate and proximal, respectively, in their relation to clinical disease (and still distant from cardiovascular outcomes) ().
Figure 7. Diagram summarizing the relation of insulin resistance to the metabolic syndrome. Insulin resistance in the glucose pathway(reduced glucose uptake) couples with ß‐cell dysfunction to produce glucose intolerance. It also induces compensatory hyperinsulinaemia, feeding back on insulin resistance of glucose uptake. Non‐glucose insulin actions (lipids, blood pressure, endothelial function, autonomic nervous system) may themselves be resistant or, if normally sensitive, be overly stimulated by the hyperinsulinaemia. These non‐glucose insulin actions conspire with other factors (independent controls of blood pressure, lipid metabolism, etc.) to determine hypertension and dyslipidaemia. The clinical phenotype of the metabolic syndrome develops from this metabolic phenotype. Obesity, especially visceral fat accumulation, and poor cardio‐respiratory fitness (CR fitness) are physical phenotypes whose influence is transduced also via insulin resistance and other physiological factors.
While there is nothing wrong in selecting diverse parameters to maximize predictability for a predefined outcome (diabetes or cardiovascular disease), the resulting ‘syndrome’ usually lacks a cogent conceptual structure, may reflect ‘local’ conditions (i.e. the particular data set from which it was extracted) and may ultimately be of limited applicability. Thus, for the time being one can conclude that, while overt diabetes, clinical hypertension and frank dyslipidaemia often present together in the same patient, a subclinical syndrome with a distinct, probable aetiology and a proven power as a risk indicator remains to be identified.
References
- Reaven G. M. Banting lecture 1988. Role of insulin resistance in human disease. Diabetes 1988; 37: 1595–607
- DeFronzo R. A., Tobin J., Andres R. Glucose clamp technique: a method for quantifying insulin secretion and resistance. Am J Physiol 1979; 237: E214–23
- Ferrannini E., Mari A. How to measure insulin sensitivity. J Hypertens 1998; 16: 895–906
- DeFronzo R. A., Ferrannini E., Hendler R., Felig P., Wahren J. Regulation of splanchnic and peripheral glucose uptake by insulin and hyperglycemia in man. Diabetes 1983; 32: 35–45
- Paternostro G., Camici P. G., Lammerstma A. A., Marinho N., Baliga R. R., Kooner J. S., et al. Cardiac and skeletal muscle insulin resistance in patients with coronary artery disease: a study with positron‐emitting tomography. J Clin Invest 1996; 98: 2094–9
- Golay A., Felber J. P., Jequier E., DeFronzo R. A., Ferrannini E. Metabolic basis of obesity and noninsulin‐dependent diabetes mellitus. Diabetes Metab Rev 1988; 4: 727–47
- Ferrannini E., Locatelli L., Jequier E., Felber J. P. Differential effects of insulin and hyperglycemia on intracellular glucose disposition in humans. Metabolism 1989; 38: 459–65
- Bonadonna R. C., Del Prato S., Saccomani M. P., Bonora E., Gulli G., Ferrannini E., et al. Transmembrane glucose transport in skeletal muscle of patients with non–insulin‐dependent diabetes. J Clin Invest 1993; 92: 486–94
- Gastaldelli A., Baldi S., Pettiti M., Toschi E., Camastra S., Natali A., et al. Influence of obesity and type 2 diabetes on gluconeogenesis and glucose output in hormones. Diabetes 2000; 49: 1367–73
- Iozzo P., Hallsten K., Oikonen V., Virtanen K. A., Kemppainen J., Solin O., et al. Insulin‐mediated hepatic glucose uptake is impaired in type 2 diabetes: evidence for a relationship with glycemic control. J Clin Endocrinol Metab 2003; 88: 2055–60
- Virtanen K. A., Iozzo P., Hallsten K., Huupponen R., Parkkola R., Janatuinen T., et al. Increased fat mass compensates for insulin resistance in abdominal obesity and type 2 diabetes: a positron‐emitting tomography study. Diabetes 2005; 54: 2720–6
- Del Prato S., Leonetti F., Simonson D. C., Sheehan P., Matsuda M., DeFronzo R. A. Effect of sustained physiologic hyperinsulinaemia and hyperglycaemia on insulin secretion and insulin sensitivity in man. Diabetologia 1994; 37: 1025–35
- Yki‐Järvinen H. Glucose toxicity. Endocr Rev 1992; 13: 415–31
- Ferrannini E., Gastaldelli A., Miyazaki Y., Matsuda M., Mari A., DeFronzo R. A. beta‐Cell function in subjects spanning the range from normal glucose tolerance to overt diabetes: a new analysis. J Clin Endocrinol Metab 2005; 90: 493–500
- Golay A., Swilocky A. L., Chen Y. D., Reaven G. M. Relationship between plasma free fatty acid concentration, endogenous glucose production, and fasting hyperglycemia in normal and non–insulin‐dependent diabetic individuals. Metabolism 1987; 36: 692–6
- Randle P. J., Garland P. B., Hales C. N., Newsholme E. A. The glucose fatty acid cycle: its role in insulin sensitivity and the metabolic disturbances of diabetes mellitus. Lancet 1963; i: 785–9
- Ferrannini E., Barrett E. J., Bevilacqua S., DeFronzo R. A. Effect of free fatty acids on glucose production and utilization in man. J Clin Invest 1983; 72: 1737–45
- Groop L. C., Saloranta C., Schenk M., Bonadonna R. C., Ferrannini E., DeFronzo R. A. The role of free fatty acid metabolism in the pathogenesis of insulin resistance in obesity and non–insulin‐dependent diabetes mellitus. J Clin Endocrinol Metab 1991; 72: 96–107
- Kelley D. E., Mokan M., Simoneau J. A., Mandarino L. J. Interaction between glucose and free fatty acid metabolism in human skeletal muscle. J Clin Invest 1993; 92: 9–8
- Ferrannini E., Camastra S., Coppack S. W., Fliser D., Golay A., Mitrakou A. Insulin action and nonesterified fatty acids. Proc Nutr Soc 1997; 56: 753–61
- Taskinen M. R. Type 2 diabetes as a lipid disorder. Curr Mol Med 2005; 5: 297–308
- Yki‐Järvinen H. Fat in the liver and insulin resistance. Ann Med 2005; 37: 347–56
- Greco A. V., Mingrone G., Giancaterini A., Manco M., Morroni M., Cinti S., et al. Insulin resistance in morbid obesity: reversal with intramyocellular fat depletion. Diabetes 2002; 51: 144–51
- Ginsberg H. N. New perspectives on atherogenesis: role of abnormal triglyceride‐rich lipoprotein metabolism. Circulation 2002; 106: 2137–42
- Steinberg H. O., Baron A. D. Vascular function, insulin resistance and fatty acids. Diabetologia 2002; 45: 623–34
- Kashyap S., Belfort R., Gastaldelli A., Pratipanawatr T., Berria R., Pratipanawatr W., et al. A sustained increase in plasma free fatty acids impairs insulin secretion in nondiabetic subjects genetically predisposed to develop type 2 diabetes. Diabetes 2003; 52: 2461–74
- Camastra S., Bonora E., Del Prato S., Rett K., Weck M., Ferrannini E. Effect of obesity and insulin resistance on resting and glucose‐induced thermogenesis in man. EGIR (European Group for the Study of Insulin Resistance). Int J Obes Relat Metab Disord 1999; 23: 1307–13
- Ferrannini E., Buzzigoli G., Bonadonna R., Giorico M. A., Oleggini M., Graziadei L., et al. Insulin resistance in essential hypertension. N Engl J Med 1987; 317: 350–7
- Ferrannini E., Natali A., Capaldo B., Lehtovirta M., Jacob S., Yki‐Yarvinen H. Insulin resistance, hyperinsulinemia, and blood pressure. Role of age and obesity. Hypertension 1997; 30: 1144–9
- Ferrannini E. The phenomenon of insulin resistance: its possible relevance to hypertensive disease. Hypertension: Pathophysiology, Diagnosis, and Management. 2nd Edition, J. H Laragh, B. M Brenner, editors. Raven Press, New York 1995; p 2281–300, In
- Yki‐Järvinen H., Utriainen T. Insulin‐induced vasodilatation: physiology or pharmacology?. Diabetologia 1998; 41: 369–79
- Taddei S., Virdis A., Mattei P., Natali A., Ferrannini E., Salvetti A. Effect of insulin on acetylcholine‐induced vasodilation in normotensive subjects and patients with essential hypertension. Circulation 1995; 92: 2911–8
- Steinberg H. O., Brechtel G., Johnson A., Fineberg E., Baron A. D. Insulin‐mediated skeletal muscle vasodilatation is nitric oxide dependent. A novel action of insulin to increase nitric oxide release. J Clin Invest 1994; 94: 1172–9
- Ferrannini E., Taddei S., Santoro D., Natali A., Boni C., Del Chiaro D., et al. Independent stimulation of glucose metabolism and Na/K exchange by insulin in the human forearm. Am J Physiol 1988; 255: E953–8
- Montagnani M., Ravichandran L. V., Chen H., Esposito D. L., Quon M. J. Insulin receptor substrate‐1 and phosphoinositide‐dependent kinase‐1 are required for insulin‐stimulated production of nitric oxide in endothelial cells. Mol Endocrinol 2002; 16: 1931–42
- Montagnani M., Golovchenko I., Kim I., Koh G. Y., Goalstone M. L., Mundhekar A. N., et al. Inhibition of phosphatidylinositol 3‐kinase enhances mitogenic actions of insulin in endothelial cells. J Biol Chem 2002; 277: 1794–9
- Muscelli E., Emdin M., Natali A., Pratali L., Camastra S., Gastaldelli A., et al. Autonomic and hemodynamic responses to insulin in lean and obese humans. J Clin Endocrinol Metab 1998; 83: 2084–90
- Ferrannini E., Galvan A. Q., Gastaldelli A., Camastra S., Sironi A. M., Toschi E., et al. Insulin: new roles for an ancient hormone. Eur J Clin Invest 1999; 29: 842–52
- Porte D., Jr, Baskin D. G., Schwartz M. W. Insulin signaling in the central nervous system: a critical role in metabolic homeostasis and disease from C. elegans to humans. Diabetes 2005; 54: 1264–76
- Trovati M., Anfossi G. Influence of insulin and of insulin resistance on platelet and vascular smooth muscle cell function. J Diabetes Complications 2002; 16: 35–40
- Gastaldelli A., Emdin M., Conforti F., Camastra S., Ferrannini E. Insulin prolongs the QTc interval in humans. Am J Physiol Regul Integr Comp Physiol 2000; 279: R2022–5
- Ferrannini E., Natali A., Bell P., Cavallo‐Perin P., Lalic N., Mingrone G. Insulin resistance and hypersecretion in obesity. J Clin Invest 1997; 100: 1166–73
- Gastaldelli A., Sironi A. M., Ciociaro D., Positano V., Buzzigoli E., Giannessi D., et al. Visceral fat and beta cell function in non‐diabetic humans. Diabetologia 2005; 48: 2090–6
- Sironi A. M., Gastaldelli A., Mari A., Ciociaro D., Positano V., Buzzigoli E., et al. Visceral fat in hypertension: influence on insulin resistance and beta‐cell function. Hypertension 2004; 44: 127–33
- Miles J. M., Jensen M. D. Counterpoint: visceral adiposity is not causally related to insulin resistance. Diabetes Care 2005; 28: 2326–8
- Dvorak R. V., DeNino W. F., Ades P. A., Poehlman E. T. Phenotypic characteristics associated with insulin resistance in metabolically obese but normal‐weight young women. Diabetes 1999; 48: 2210–4
- Katzmarzyk P. T., Church T. S., Janssen I., Ross R., Blair S. N. Metabolic syndrome, obesity, and mortality: impact of cardiorespiratory fitness. Diabetes Care 2005; 28: 391–7
- Wisloff U., Najjar S. M., Ellingsen O., Haram P. M., Swoap S., Al‐Share Q., et al. Cardiovascular risk factors emerge after artificial selection for low aerobic capacity. Science 2005; 307: 418–20
- Ferrannini E., Haffner S. M., Mitchell B. D., Stern M. P. Hyperinsulinemia: the key feature of a cardiovascular and metabolic syndrome. Diabetologia 1991; 34: 416–22
- Kahn R., Buse J., Ferrannini E., Stern M. P. The metabolic syndrome: time for a critical appraisal Joint statement from the American Diabetes Association and the European Association for the Study of Diabetes. Diabetologia 2005; 48: 1684–99