Abstract
Insulin resistance in humans is not always accompanied by obesity, since severe insulin resistance also characterizes patients lacking subcutaneous fat such as those with HAART‐ (highly‐active antiretroviral therapy)‐associated lipodystrophy. Both obese and lipodystrophic patients, however, have an increase in the amount of fat hidden in the liver. Liver fat content can be accurately quantified non‐invasively by proton magnetic resonance spectroscopy. It is closely correlated with fasting insulin concentrations and direct measures of hepatic insulin sensitivity while the amount of subcutaneous adipose tissue is not. An increase in liver fat content has been shown to predict type 2 diabetes, independently of other cardiovascular risk factors. This is easily explained by the fact that the liver, once fatty, overproduces most of the known cardiovascular risk factors such as very low density lipoprotein (VLDL), glucose, C‐reactive protein (CRP), plasminogen activator inhibitor‐1 (PAI‐1), fibrinogen and coagulation factors. The causes of inter‐individual variation in liver fat content, independent of obesity, are largely unknown but could involve differences in signals from adipose tissue such as in the amount of adiponectin produced and differences in fat intake. Adiponectin deficiency characterizes both lipodystrophic and obese insulin‐resistant individuals, and serum levels correlate with liver fat content. Liver fat content can be decreased by weight loss and by a low as compared to a high fat diet. In addition, treatment of both lipodystrophic and type 2 diabetic patients with peroxisome proliferators activator receptor‐γ (PPARγ) agonists, but not metformin, decreases liver fat and markedly increases adiponectin levels. The fatty liver may help to explain why some but not all obese individuals are insulin resistant and why even lean individuals may be insulin resistant, and thereby at risk of developing type 2 diabetes and cardiovascular disease.
Introduction
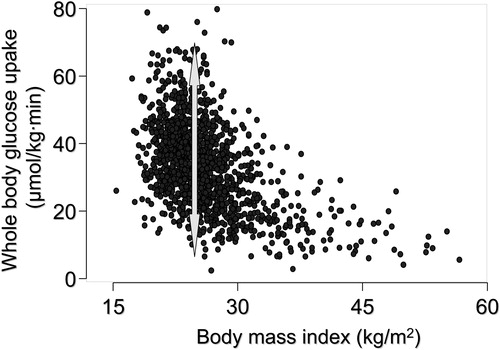
Insulin resistance both precedes and predicts type 2 diabetes and increases, even in the absence of diabetes, the risk of cardiovascular disease Citation1. Insulin resistance is often considered synonymous with obesity, although lean subjects can be insulin resistant, and the degree of insulin resistance varies considerably amongst equally obese subjects (). Severe insulin resistance can also be observed in the absence of subcutaneous fat in lipoatrophic patients Citation2. However, both lean and obese and lipoatrophic insulin‐resistant individuals have an increased amount of fat in the form of triglycerides in insulin‐sensitive tissues, especially in the liver and skeletal muscles. This fat appears to be the most proximal correlate of insulin resistance. Although fat accumulation in muscle is associated with insulin resistance Citation3, skeletal muscles do not, unlike the liver, overproduce cardiovascular risk factors once their fat content is increased. This is in contrast to the fatty liver which overproduces multiple cardiovascular risk factors such as glucose, very low density lipoprotein (VLDL) Citation4, plasminogen activator inhibitor‐1 (PAI‐1) Citation5, coagulation factors Citation6 and C‐reactive protein (CRP) Citation7. The ensuing discussion is focused on reviewing the role of liver fat as the common denominator for insulin resistance associated with both too little (lipoatrophy) and too much (obesity) subcutaneous fat. In the ensuing discussion, liver fat refers to fat in the liver which cannot be attributed to known causes of liver disease such as alcohol, viruses, autoimmune disease, drugs or toxins Citation8. Indeed, as will be discussed, 70% of elevated liver enzymes are due to ‘non‐alcoholic fatty liver disease’, a condition frequently if not invariably accompanied by insulin resistance.
Figure 1 The relationship between body mass index (BMI) and whole body insulin sensitivity, measured using the euglycemic clamp technique, in 1,394 healthy non‐diabetic European men and women whose data have been included in the European Group for Insulin resistance (EGIR) database. The arrow depicts the range of variation in whole body insulin sensitivity at a BMI of 28 kg/m2. Data used by permission from the EGIR.
Key messages
The fatty liver (non‐alcoholic fatty liver disease) is as common as the metabolic syndrome.
Fat accumulation in the liver predisposes to type 2 diabetes.
The liver, once fatty, overproduces almost all cardiovascular risk factors.
Insulin resistance and lipoatrophy
Animal models
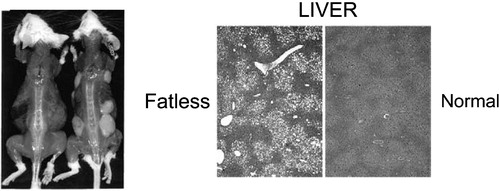
Genetically engineered animal models have documented that lack of subcutaneous and visceral fat is associated with severe insulin resistance and fat accumulation in insulin sensitive tissues (see Citation9 for review). As an example, expression of a dominant‐negative protein, termed A‐ZIP/F in adipose tissue prevents DNA binding of B‐ZIP transcription factors of C/EBP and Jun families Citation10, Citation11. These mice, named A‐ZIP/F‐1, have no white adipose tissue subcutaneously or elsewhere, but have severe hepatosteatosis, diabetes, and elevated glucose, insulin, triglyceride and free fatty acid (FFA) concentrations (). Transplantation of wild‐type adipose tissue into these fatless mice reverses hyperglycemia, decreases insulin concentrations, corrects insulin signaling defects and normalizes fat content in the liver and muscle Citation12. This implies that fat accumulation in insulin‐sensitive tissues indeed can cause insulin resistance, although the stored triglyceride itself is inert.
Figure 2 An example of a lipoatrophic mouse model Citation11. These mice (mouse on the left in the panel on the left) are unable to store fat subcutaneously but store excessive amounts of fat in the liver. The liver becomes severely insulin resistant. Transplantation of normal adipose tissue subcutaneously (mouse on the right in the panel on the left) removes excess fat and normalizes insulin sensitivity in the liver. Reproduced with permission from Citation11.
Human lipodystrophies
The most common condition characterized by atrophy of subcutaneous fat in humans is that developing as a side effect of highly‐active antiretroviral therapy (HAART) in patients with HIV infection Citation13. These drugs have dramatically decreased mortality from AIDS Citation14. However, up to 50% of the patients receiving HAART develop signs of lipodystrophy, which is characterized by loss of subcutaneous fat and accumulation of fat intra‐abdominally, and severe insulin resistance Citation13. Patients with HAART‐associated lipodystrophy as well as those with rarer forms of human lipoatrophies have an excess of fat in the liver Citation2. The amount of fat in the liver correlates closely with fasting insulin concentrations Citation4. Thus, insulin resistance can be observed, as in the mouse models, in the absence of subcutaneous but not liver fat.
Insulin resistance and obesity
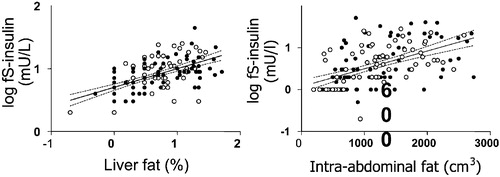
Insulin resistance is not synonymous with obesity, i.e. an increase in body mass index, predominantly because of an increase in subcutaneous fat mass. This is illustrated by the large variation in insulin sensitivity at a given body mass index (). A fatty liver has long been known to be more common in non‐obese than in obese subjects, but the relationship between obesity and liver fat is weak Citation15–17. Liver fat is, however, closely correlated with markers Citation4 and direct measures Citation15, Citation18 of insulin resistance. This is true for both men and women, although women have more subcutaneous and less visceral fat than men Citation19. If the amount of subcutaneous fat is plotted against liver fat or fasting insulin, men and women fall on their own regression lines (). However, if either liver fat or intra‐abdominal fat are plotted against fasting insulin, men and women fall on the same regression line (). These data imply that it is not the visible subcutaneous fat but rather that hidden in the liver that is the most proximal correlate of insulin resistance.
Figure 3 The relationship between the amount of subcutaneous fat measured with magnetic resonance imaging and percent liver fat (LFAT, panel on the left) and fasting serum insulin (fS‐insulin, panel on the right) in 132 non‐diabetic healthy men and women. Reproduced with permission from Citation4.
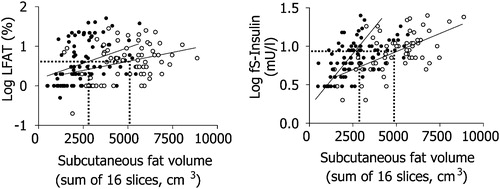
Figure 4 The relationship between the amount of liver fat and fasting serum insulin (fS‐insulin, panel on the left) and between intra‐abdominal fat and serum fasting insulin (panel on the right) in 132 non‐diabetic healthy men and women. Reproduced with permission from Citation4.
Diagnosis of a fatty liver associated with insulin resistance
Quantification of liver fat
To determine whether inter‐individual differences in liver fat contribute to ‘the insulin resistance syndrome’, liver fat needs to be quantified accurately and other known causes of liver fat excluded. The most accurate non‐invasive method to quantitate the amount of liver triglyceride is by using magnetic resonance proton spectroscopy Citation20. This method does not provide histological information on the nature of the fat deposits (micro‐ or macrovesicular steatosis), degree of inflammation or of the presence of fibrosis but liver fat measured with this technique correlates closely with that measured chemically by liver biopsy, and with computerized tomography (CT) Citation18, Citation21. Ultrasound and CT techniques are widely available but are not as sensitive or quantitative as proton spectroscopy Citation21–23.
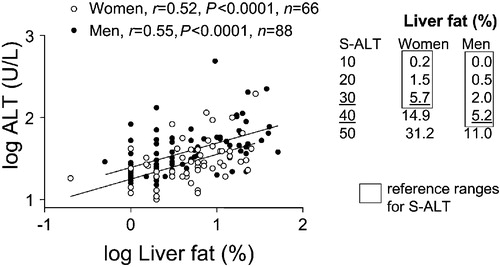
depicts the relationship between liver fat and serum alanine aminotransferase (ALT) in apparently healthy subjects. The correlation coefficient between serum ALT and liver fat measured by proton spectroscopy was 0.52 for women and 0.55 for men Citation4. Serum aspartate aminotransferase (AST) and gamma‐glutamyltransferase (GGT) were not as well correlated as S‐ALT. The intercepts, but not the slopes, of the regression lines relating percent liver fat to S‐ALT differed between men and women (). This is consistent with a lower reference range of S‐ALT for women as compared to men, and probably reflects gender differences in liver size.
Figure 5 The relationship between liver fat measured with magnetic resonance spectroscopy and serum alanine aminotransferase activity (S‐ALT) in 132 non‐diabetic healthy men and women. Reproduced with permission from Citation4.
Non‐alcoholic fatty liver disease (NAFLD) is the most common cause of elevated liver enzymes
Triglycerides may accumulate in hepatocytes either as small or large lipid deposits (micro‐ or macrovesicular steatosis) Citation24. Microvesicular steatosis is seen in a variety of conditions in which there is either an inherited or acquired defect in β‐oxidation of fatty acids such as mitochondrial cytopathies and disorders of ureagenesis, the acute fatty liver of pregnancy and Reye's syndrome Citation25. Causes of macrovesicular steatosis include non‐alcoholic fatty liver disease (NAFLD (vide infra), alcohol and other causes such as total parenteral nutrition, protein‐calorie malnutrition and jejuno‐ileal bypass. NAFLD is a term describing a large spectrum of conditions ranging from fat alone to fat plus inflammation, fat plus ballooning degeneration and non‐alcoholic steatohepatitis (NASH) Citation26. By definition, NAFLD can only be diagnosed in patients who do not consume significant amounts of alcohol Citation27. NAFLD is commonly, if not invariably, associated with features of insulin resistance and may indeed be part of, or the cause of the insulin resistance syndrome. Patients with NAFLD should not have clinical or laboratory evidence of autoimmune, viral or drug‐ or toxin‐induced liver disease or of inborn errors of metabolism Citation27. NASH cannot be distinguished from other types of NAFLD without examining liver histology.
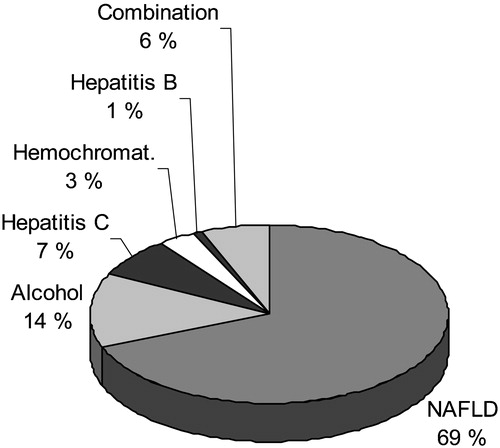
In the Third National Health and Nutrition Examination Survey (NHANES III), which is a population‐based sample of 13,500 U.S. adults aged 17 to 74 years, NAFLD, when defined as an abnormal AST, ALT or GGT value without evidence for hepatitis B or C, increased transferrin saturation (>50%) or excessive alcohol intake (<2 drinks for women and <3 drinks for men) was the most common cause (69% of all causes) of elevated liver enzymes () Citation28.
Figure 6 Causes of elevated liver function tests (serum alanine or aspartate aminotransferase above the upper limit of normal) according to the Third National Health and Nutrition Examination Survey (1988–94) including 15,676 adults aged 17 years and over in the United States. NAFLD = non‐alcoholic fatty liver disease. Reproduced with permission from Citation28.
Why and how does fat accumulate in the liver?
Excess FFA flux to the liver could be the consequence of increased FFA delivery to the liver from peripheral or visceral depots, or FFA could originate from postprandial lipolysis of chylomicrons. In the liver, excess triglyceride deposition could be the consequence of impaired hepatic FFA oxidation or enhanced FFA extraction and triglyceride synthesis. Impaired release of VLDL could also contribute. Human data regarding the quantitative importance of these pathways to excessive hepatic triglyceride storage are not available.
Visceral fat
Truncal, or abdominal obesity is the form of obesity which is most likely associated with hepatic steatosis Citation29. According to the portal hypothesis, visceral adipose tissue releases excess FFA to the portal vein and exposes the liver to high FFA concentrations Citation30. That this view is indeed based on circumstantial rather than solid scientific evidence has been emphasized Citation30. The hypothesis has only recently been directly tested in man. Nielsen et al. measured systemic, splanchnic and leg FFA kinetics by combining catheterization and stable isotope techniques in men and women with varying degrees of obesity Citation31. Only approximately 5% and 20% of portal vein FFA originated from visceral fat in lean and obese subjects Citation32. The relative amount of portal vein FFA derived from visceral fat was much less than that derived from subcutaneous fat Citation32. Thus, after an overnight fast, peripheral subcutaneous tissue seems to be the major source of FFA entering the liver. There are no data on FFA kinetics in relation to liver fat content in individuals with lipoatrophy.
Adiponectin‐dependent mechanisms, inflammation in adipose tissue
A key question is what might enhance lipogenesis in obesity and whether any common mechanisms underlie liver fat accumulation in obesity and lipoatrophy. One possible mechanism is adiponectin deficiency, which characterizes both obesity Citation33 and lipoatrophy Citation34. Adiponectin is an adipokine exclusively produced by adipocytes, which decreases hepatic lipogenesis, and increases FFA oxidation and hepatic insulin sensitivity in mice Citation35. Treatment with recombinant adiponectin of mice with non‐alcoholic fatty liver ameliorates hepatomegaly, steatosis, and decreases alanine aminotransferase activities Citation36. In humans, in several studies in lipoatrophic and obese subjects, obesity‐independent correlations between adiponectin concentrations and hepatic insulin sensitivity and fat content have been observed Citation34, Citation37–40. The exact causes of adiponectin deficiency in obese and lipoatrophic adipose tissue are unclear. Tumor necrosis factor‐α (TNFα) is a cytokine which has recently been suggested to originate exclusively from macrophages in adipose tissue Citation41. The number of macrophages in adipose tissue is increased in both obese Citation41 and lipoatrophic Citation34, Citation42 patients. TNFα gene expression is increased in obesity Citation43 and lipoatrophy Citation44, and TNFα downregulates adiponectin production in adipocytes Citation45. Its gene expression is inversely related to that of adiponectin in human adipose tissue Citation43. Thus, adipose tissue inflammation may be one factor which increases liver fat content. This does not exclude adiponectin‐independent mechanisms from contributing to liver fat content. Also, adiponectin circulates in serum as a hexamer of low molecular weight and a larger multimeric structure Citation46. In mice, the full‐length protein is active in the liver Citation46. The ratio of the higher molecular weight to total adiponectin seems to be better correlated with changes in insulin sensitivity than changes in the low molecular weight form during PPARγ agonist treatment in humans Citation46. However, neither data in mice nor correlations in humans prove causality. Since adiponectin is not available for clinical testing, it is at present unclear which form of adiponectin is active in which tissue in humans.
Adiponectin‐independent mechanisms
Regarding adiponectin‐independent mechanisms of hepatic fat accumulation, in rats, short‐term (3 days) high‐fat feeding increases hepatic triglyceride and fatty acyl‐CoA content 3‐fold without changing visceral or muscle fat content or body weight, or serum adiponectin concentrations Citation47. The liver of the high‐fat fed rats was insulin resistant in vivo, and in vitro insulin resistance was characterized by normal insulin receptor but blunted insulin receptor substrate‐1 (IRS‐1) and IRS‐2 tyrosine phosphorylation, and impaired insulin activation of protein kinase B isoform 2 (AKT2), glycogen synthase and inactivation of glycogen synthase kinase‐3 (GSK3) Citation47. In this model hepatic insulin resistance could be abrogated by preventing hepatic fat accumulation using a mitochondrial uncoupler to increase hepatic fat oxidation Citation47. In humans, high as compared to low fat feeding has recently been shown to change liver fat content and serum fasting insulin concentrations without any changes in the sizes of intra‐abdominal or subcutaneous fat depots or serum adiponectin concentrations Citation76. The molecular mechanisms of insulin resistance in the fatty liver in humans have as yet not been characterized. Data obtained using the mouse liver are of questionable significance when it comes to regulation of liver fat. For example, although PPARγ agonism has been shown in multiple studies to decrease liver fat content in humans (vide infra), these agents increase liver fat in lipoatrophic and obese animals Citation48, Citation49. summarizes factors shown to regulate liver fat content or hepatic insulin sensitivity in humans.
Clinical significance of the fatty liver
The fatty liver is becoming a common concern for both diabetologists and hepatologists. This is because liver fat predicts, as discussed below, type 2 diabetes independently of common confounders, and cirrhosis especially in patients with the insulin resistance syndrome.
Liver fat predicts type 2 diabetes
In the NHANES III survey, adults with NAFLD, as compared to those without, were twice as likely to have type 2 diabetes after adjustment for age, gender, race and body mass index Citation50. Similar data were reported earlier from the Hispanic Health and Nutrition Examination Survey (1982–84). In this survey, data from 2,999 men and women aged 20–74 years representative of the Mexican American population were analyzed. Six percent of men and 2% of women had an elevated ALT (43 IU/liter). The odds ratio for diabetes as a predictor of elevated ALT was 4.1 after adjustment for age and sex, and decreased to 3.0 after adjustment for age, sex, body mass index and alcohol consumption Citation51. These cross‐sectional data have been confirmed in seven prospective studies. Elevated liver enzymes including serum glutamic pyruvic transaminase Citation52, gamma‐glutamyltransferase Citation53–56 and alanine aminotransferase activities Citation57, Citation58 have been shown to predict type 2 diabetes. In all studies, liver enzymes increased the risk of type 2 diabetes independent of major confounding factors such as body mass index, family history of diabetes, alcohol consumption and physical activity.
Type 2 diabetic patients have an increased risk of liver disease
Since NAFLD and insulin resistance coexist, insulin resistance precedes type 2 diabetes, and NAFLD increases the risk of cirrhosis, it is not unexpected that type 2 diabetic patients have an increased risk of cirrhosis Citation59. In the latter study involving 7,148 type 2 patients, the standardized mortality of liver cirrhosis was 2.5‐fold increased, while the risk of death from cardiovascular disease was only 1.3‐fold increased. Men with type 2 diabetes also have been reported to have a 2‐fold risk of acute and chronic liver disease and hepatocellular carcinoma compared to men without type 2 diabetes Citation60, Citation61.
Liver fat predicts insulin requirements during insulin therapy in type 2 diabetic patients
Inhibition of hepatic glucose production both between and during meals is a key action of insulin. During insulin therapy, inhibition of hepatic glucose production lowers plasma glucose concentrations, which counteracts (because of a diminished mass action effect of glucose to promote its own utilization) insulin stimulation of glucose utilization Citation62–64. The net result is an unchanged rate of glucose utilization, despite improved insulin sensitivity in patients with type 2 diabetes. This implies that the sensitivity of hepatic glucose production to insulin is a major determinant of insulin requirements. This has been documented in type 2 diabetic patients treated with basal insulin and metformin Citation18. Hepatic insulin sensitivity was closely correlated with liver fat content and with the daily insulin dose Citation18.
The fatty liver as a target for insulin‐sensitizing therapy
A reduction in liver fat would seem an attractive target for anti‐diabetic drugs as well as therapies aimed at preventing the development of NASH and cirrhosis. Weight loss is effective in reducing liver fat Citation65. Even moderate weight loss (8%) decreases liver fat by approximately 50%, irrespective of baseline liver fat content Citation66. The thiazolidinediones (TZDs) rosiglitazone and pioglitazone are peroxisome proliferators activator receptor‐γ (PPARγ) agonists, which have recently been shown in mechanistic studies in humans to decrease liver fat content significantly and on average by the same amount (50%) as moderate weight loss Citation37, Citation67–69. TZDs induce dramatic increases in serum adiponectin concentrations Citation37, Citation70, Citation71, which in turn correlate with changes in liver fat independent of body mass index. An example of effects of 16 weeks of TZD treatment on liver fat in patients with type 2 diabetes is shown in . TZD treatment has also been shown to decrease liver fat and fasting serum insulin concentrations in non‐diabetic patients with lipodystrophy Citation72. Two uncontrolled 48‐week studies have examined whether patients with NASH benefit from pioglitazone or rosiglitazone treatment Citation73, Citation74. In both studies, after the 48‐week treatment period, roughly 50% of patients with NASH at baseline no longer had histological changes consistent with this diagnosis. Results from controlled studies addressing effects of TZDs on the natural course on NASH and also on cardiovascular disease are awaited with interest Citation75.
Figure 7 Effects of 4 months of rosiglitazone or metformin treatment on percent liver fat (upper panel) and serum adiponectin concentrations (lower panel) in type 2 diabetic patients. Reproduced with permission from Citation37.
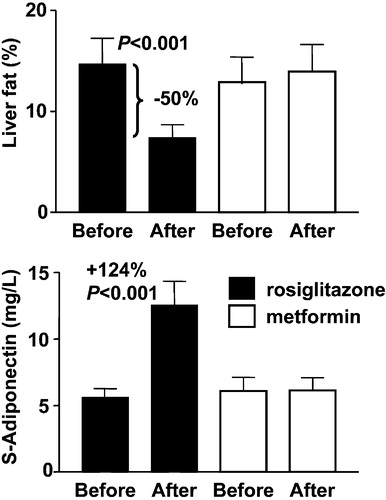
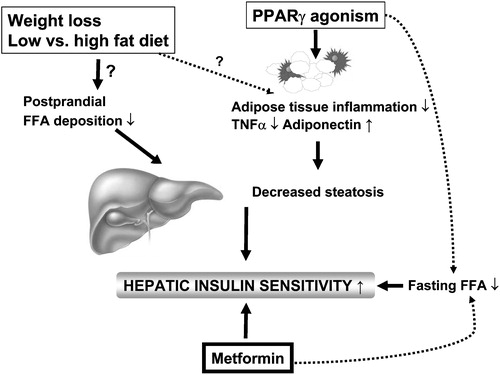
Figure 8 Regulators of liver fat content in humans. Liver fat content can be decreased by weight loss, and by lowering of dietary fat content and PPARγ agonism. While the exact mechanisms underlying the beneficial effects of weight loss and dietary fat content on liver fat are uncertain, at least one of the mechanisms via which PPARγ agonists could reduce hepatic fat content is by increasing adiponectin expression in adipose tissue. Metformin appears to increase hepatic insulin sensitivity without changing liver fat content.
Conclusions
To conclude, liver fat content is increased in both obese and lipoatrophic patients. Once fatty, the liver overproduces multiple cardiovascular risk factors such as VLDL, CRP, anti‐fibrinolytic and coagulation factors. Hepatic insulin resistance also increases the amount of endogenous and exogenous insulin needed to maintain normal glucose levels. A fatty liver increases the risk of developing type 2 diabetes, and type 2 diabetes increases the risk of NAFLD, NASH and cirrhosis. Weight loss and insulin sensitizers reduce liver fat content. A major challenge is to define the mechanisms and the acquired and genetic causes underlying fat accumulation in humans.
Acknowledgements
The research was supported by grants from the Academy of Finland (HY), Sigrid Juselius Foundation (HY), Finnish Diabetes Research Society (HY) and the Novo Nordisk Foundation (HY). The author also wishes to acknowledge the research group working with liver fat and insulin resistance including Robert Bergholm, Takashi Goto, Kirsi Pietiläinen, Leena Ryysy, Anneli Seppälä‐Lindroos, Jussi Sutinen, Katja Tuominen, Mia Urjansson, Satu Vehkavaara and Jukka Westerbacka at the Department of Medicine, Division of Diabetes; Anna‐Maija Häkkinen at the Department of Oncology, University of Helsinki, and the entire research group of Professor Anders Hamsten at the Karolinska Institute, Stockholm, Sweden.
References
- Yki‐Järvinen H. Insulin resistance in type 2 diabetes. Textbook of Diabetes. 2nd ed, J. C Pickup, G Williams. Blackwell, Oxford 2003; 22.1–22.19
- Reitman M. L., Arioglu E., Gavrilova O., Taylor S. I. Lipoatrophy revisited. Trends Endocrinol Metab 2000; 11: 410–6
- Kim J. K., Fillmore J. J., Chen Y., Yu C., Moore I. K., Pypaert M., et al. Tissue‐specific overexpression of lipoprotein lipase causes tissue‐specific insulin resistance. Proc Natl Acad Sci U S A 2001; 98: 7522–7
- Westerbacka J., Corner A., Tiikkainen M., Tamminen M., Vehkavaara S., Hakkinen A. M., et al. Women and men have similar amounts of liver and intra‐abdominal fat, despite more subcutaneous fat in women: implications for sex differences in markers of cardiovascular risk. Diabetologia 2004; 47: 1360–9
- Yki‐Jarvinen H., Sutinen J., Silveira A., Korsheninnikova E., Fisher R., Kannisto K., et al. Regulation of Plasma PAI‐1 Concentrations in HAART‐Associated Lipodystrophy During Rosiglitazone Therapy. Arterioscler Thromb Vasc Biol 2003; 23: 688–94
- Cigolini M., Targher G., Agostino G., Tonoli M., Muggeo M., De Sandre G. Liver steatosis and its relation to plasma haemostatic factors in apparently healthy men – role of the metabolic syndrome. Thromb Haemost 1996; 76: 69–73
- Kerner A., Avizohar O., Sella R., Bartha P., Zinder O., Markiewicz W., et al. Association between elevated liver enzymes and C‐reactive protein: possible hepatic contribution to systemic inflammation in the metabolic syndrome. Arterioscler Thromb Vasc Biol 2005; 25: 193–7
- Clark J. M., Brancati F. L., Diehl A. M. Nonalcoholic fatty liver disease. Gastroenterology 2002; 122: 1649–57
- Reitman M. L. Metabolic lessons from genetically lean mice. Annu Rev Nutr 2002; 22: 459–82
- Moitra J., Mason M. M., Olive M., Krylov D., Gavrilova O., Marcus‐Samuels B., et al. Life without white fat: a transgenic mouse. Genes Dev 1998; 12: 3168–81
- Kim J. K., Gavrilova O., Chen Y., Reitman M. L., Shulman G. I. Mechanism of insulin resistance in A‐ZIP/F‐1 fatless mice. J Biol Chem 2000; 275: 8456–60
- Gavrilova O., Marcus‐Samuels B., Graham D., Kim J. K., Shulman G. I., Castle A. L., et al. Surgical implantation of adipose tissue reverses diabetes in lipoatrophic mice. J Clin Invest 2000; 105: 271–8
- Carr A., Cooper D. A. Adverse effects of antiretroviral therapy. Lancet 2000; 356: 1423–30
- Gulick R. M., Mellors J. W., Havlir D., Eron J. J., Gonzalez C., McMahon D., et al. Treatment with indinavir, zidovudine, and lamivudine in adults with human immunodeficiency virus infection and prior antiretroviral therapy. N Engl J Med 1997; 337: 734–9
- Seppala‐Lindroos A., Vehkavaara S., Hakkinen A. M., Goto T., Westerbacka J., Sovijarvi A., et al. Fat accumulation in the liver is associated with defects in insulin suppression of glucose production and serum free fatty acids independent of obesity in normal men. J Clin Endocrinol Metab 2002; 87: 3023–8
- Tiikkainen M., Tamminen M., Hakkinen A. M., Bergholm R., Vehkavaara S., Halavaara J., et al. Liver‐fat accumulation and insulin resistance in obese women with previous gestational diabetes. Obes Res 2002; 10: 859–67
- Wasastjerna C., Reissell P., Karjalainen J., Ekelund P. Fatty liver in diabetes. A cytological study. Acta Med Scand 1972; 191: 225–8
- Ryysy L., Häkkinen A. M., Goto T., Vehkavaara S., Westerbacka J., Halavaara J., et al. Hepatic fat content and insulin action on free fatty acids and glucose metabolism rather than insulin absorption are associated with insulin requirements during insulin therapy in type 2 diabetic patients. Diabetes 2000; 49: 749–58
- Lemieux S., Prud'homme D., Bouchard C., Tremblay A., Despres J. P. Sex differences in the relation of visceral adipose tissue accumulation to total body fatness. Am J Clin Nutr 1993; 58: 463–7
- Szczepaniak L. S., Babcock E. E., Schick F., Dobbins R. L., Garg A., Burns D. K., et al. Measurement of intracellular triglyceride stores by H spectroscopy: validation in vivo. Am J Physiol 1999; 276: E977–89
- Longo R., Ricci C., Masutti F., Vidimari R., Croce L. S., Bercich L., et al. Fatty infiltration of the liver. Quantification by 1H localized magnetic resonance spectroscopy and comparison with computed tomography. Invest Radiol 1993; 28: 297–302
- Joy D., Thava V. R., Scott B. B. Diagnosis of fatty liver disease: is biopsy necessary?. Eur J Gastroenterol Hepatol 2003; 15: 539–43
- Piekarski J., Goldberg H. I., Royal S. A., Axel L., Moss A. A. Difference between liver and spleen CT numbers in the normal adult: its usefulness in predicting the presence of diffuse liver disease. Radiology 1980; 137: 727–9
- Fong D. G., Nehra V., Lindor K. D., Buchman A. L. Metabolic and nutritional considerations in nonalcoholic fatty liver. Hepatology 2000; 32: 3–10
- Burt A. D., Mutton A., Day C. P. Diagnosis and interpretation of steatosis and steatohepatitis. Semin Diagn Pathol 1998; 15: 246–58
- Falck‐Ytter Y., Younossi Z. M., Marchesini G., McCullough A. J. Clinical features and natural history of non‐alcoholic steatosis syndromes. Semin Liver Dis 2001; 21: 17–26
- Diehl A. M. Nonalcoholic steatohepatitis. Semin Liver Dis 1999; 19: 221–9
- Clark J. M., Brancati F. L., Diehl A. M. The prevalence and etiology of elevated aminotransferase levels in the United States. Am J Gastroenterol 2003; 98: 960–7
- Schaffner F. Nonalcoholic fatty liver. Bockus Gastroenterology. 5th ed, W. S Haubrich, F Schaffner, J. E Berk. W.B. Saunders Company, Philadelphia 1995; 2246–54
- Frayn K. N. Visceral fat and insulin resistance–causative or correlative?. Br J Nutr 2000; 83 Suppl 1: S71–7
- Nielsen S., Guo Z., Johnson C. M., Hensrud D. D., Jensen M. D. Splanchnic lipolysis in human obesity. J Clin Invest 2004; 113: 1582–8
- Klein S. The case of visceral fat: argument for the defense. J Clin Invest 2004; 113: 1530–2
- Arita Y., Kihara S., Ouchi N., Takahashi M., Maeda K., Miyagawa J., et al. Paradoxical decrease of an adipose‐specific protein, adiponectin, in obesity. Biochem Biophys Res Commun 1999; 257: 79–83
- Sutinen J., Korsheninnikova E., Funahashi T., Matsuzawa Y., Nyman T., Yki‐Järvinen H. Circulating Concentration of Adiponectin and Its Expression in Subcutaneous Adipose Tissue in Patients with Highly Active Antiretroviral Therapy‐Associated Lipodystrophy. J Clin Endocrinol Metab 2003; 88: 1907–10
- Yamauchi T., Kamon J., Waki H., Terauchi Y., Kubota N., Hara K., et al. The fat‐derived hormone adiponectin reverses insulin resistance associated with both lipoatrophy and obesity. Nat Med 2001; 7: 941–6
- Xu A., Wang Y., Keshaw H., Xu L. Y., Lam K. S., Cooper G. J. The fat‐derived hormone adiponectin alleviates alcoholic and nonalcoholic fatty liver diseases in mice. J Clin Invest 2003; 112: 91–100
- Tiikkainen M., Häkkinen A‐M., Korsheninnikova E., Nyman T., Mäkimattila S., Yki‐Järvinen H. Effects of rosiglitazone and metformin on liver fat content, hepatic insulin resistance, insulin clearance and gene expression in adipose tissue in patients with type 2 diabetes. Diabetes 2004; 53: 2169–7
- Pajvani U. B., Hawkins M., Combs T. P., Raja M. W., Doebber T., Berger J. P., et al. Complex distribution, not absolute amount of adiponectin, correlates with thiazolidinedione‐mediated improvement in insulin sensitivity. J Biol Chem 2004; 279: 12152–62
- Bajaj M., Suraamornkul S., Piper P., Hardies L. J., Glass L., Cersosimo E., et al. Decreased plasma adiponectin concentrations are closely related to hepatic fat content and hepatic insulin resistance in pioglitazone‐treated type 2 diabetic patients. J Clin Endocrinol Metab 2004; 89: 200–6
- Johanson E. H., Jansson P. A., Lonn L., Matsuzawa Y., Funahashi T., Taskinen M. R., et al. Fat distribution, lipid accumulation in the liver, and exercise capacity do not explain the insulin resistance in healthy males with a family history for type 2 diabetes. J Clin Endocrinol Metab 2003; 88: 4232–8
- Weisberg S. P., McCann D., Desai M., Rosenbaum M., Leibel R. L., Ferrante A. W, Jr. Obesity is associated with macrophage accumulation in adipose tissue. J Clin Invest 2003; 112: 1796–808
- Hoffstedt J., Arvidsson E., Sjolin E., Wahlen K., Arner P. Adipose tissue adiponectin production and adiponectin serum concentration in human obesity and insulin resistance. J Clin Endocrinol Metab 2004; 89: 1391–6
- Kern P. A., Ranganathan S., Li C., Wood L., Ranganathan G. Adipose tissue tumor necrosis factor and interleukin‐6 expression in human obesity and insulin resistance. Am J Physiol Endocrinol Metab 2001; 280: E745–51
- Bastard J. P., Caron M., Vidal H., Jan V., Auclair M., Vigouroux C., et al. Association between altered expression of adipogenic factor SREBP1 in lipoatrophic adipose tissue from HIV‐1‐infected patients and abnormal adipocyte differentiation and insulin resistance. Lancet 2002; 359: 1026–31
- Bruun J. M., Lihn A. S., Verdich C., Pedersen S. B., Toubro S., Astrup A., et al. Regulation of adiponectin by adipose tissue‐derived cytokines: in vivo and in vitro investigations in humans. Am J Physiol Endocrinol Metab 2003; 285: E527–33
- Pajvani U. B., Du X., Combs T. P., Berg A. H., Rajala M. W., Schulthess T., et al. Structure‐function studies of the adipocyte‐secreted hormone Acrp30/adiponectin: Implications for metabolic regulation and bioactivity. J Biol Chem 2003; 278: 9073–85
- Samuel V. T., Liu Z. X., Qu X., Elder B. D., Bilz S., Befroy D., et al. Mechanism of hepatic insulin resistance in non‐alcoholic fatty liver disease. J Biol Chem 2004; 279: 32345–53
- Chao L., Marcus‐Samuels B., Mason M. M., Moitra J., Vinson C., Arioglu E., et al. Adipose tissue is required for the antidiabetic, but not for the hypolipidemic, effect of thiazolidinediones. J Clin Invest 2000; 106: 1221–8
- Watkins S. M., Reifsnyder P. R., Pan. H., German J. B., Leiter E. H. Lipid metabolome‐wide effects of the PPARgamma agonist rosiglitazone. J Lipid Res 2002; 43: 1809–17
- Clark J. M., Diehl A. M., Brancati F. L. Nonalcoholic fatty liver disease and the risk of type 2 diabetes in the United States. Diabetes 2001; 50: A38, Abstract
- Meltzer A. A., Everhart J. E. Association between diabetes and elevated serum alanine aminotransferase activity among Mexican Americans. Am J Epidemiol 1997; 146: 565–71
- Ohlson L. O., Larsson B., Bjorntorp P., Eriksson H., Svardsudd K., Welin L., et al. Risk factors for type 2 (non‐insulin‐dependent) diabetes mellitus. Thirteen and one‐half years of follow‐up of the participants in a study of Swedish men born in 1913. Diabetologia 1988; 31: 798–805
- Perry I. J., Wannamethee S. G., Shaper A. G. Prospective study of serum gamma‐glutamyltransferase and risk of NIDDM. Diabetes Care 1998; 21: 732–7
- Nakanishi N., Nishina K., Li W., Sato M., Suzuki K., Tatara K. Serum gamma‐glutamyltransferase and development of impaired fasting glucose or type 2 diabetes in middle‐aged Japanese men. J Intern Med 2003; 254: 287–95
- Lee D. H., Jacobs D. R, Jr., Gross M., Kiefe C. I., Roseman J., Lewis C. E., et al. Gamma‐glutamyltransferase is a predictor of incident diabetes and hypertension: the Coronary Artery Risk Development in Young Adults (CARDIA) Study. Clin Chem 2003; 49: 1358–66
- Lee D. H., Ha M. H., Kim J. H., Christiani D. C., Gross M. D., Steffes M., et al. Gamma‐glutamyltransferase and diabetes–a 4 year follow‐up study. Diabetologia 2003; 46: 359–64
- Hanley A. J., Williams K., Festa A., Wagenknecht L. E., D'Agostino R. B, Jr., Kempf J., et al. Elevations in markers of liver injury and risk of type 2 diabetes: the insulin resistance atherosclerosis study. Diabetes 2004; 53: 2623–32
- Vozarova B., Stefan N., Lindsay R. S., Saremi A., Pratley R. E., Bogardus C., et al. High alanine aminotransferase is associated with decreased hepatic insulin sensitivity and predicts the development of type 2 diabetes. Diabetes 2002; 51: 1889–95
- De M. R., Locatelli F., Zoppini G., Verlato G., Bonora E., Muggeo M. Cause‐specific mortality in type 2 diabetes. The Verona Diabetes Study. Diabetes Care 1999; 22: 756–61
- El‐Serag H. B., Everhart J. E. Diabetes increases the risk of acute hepatic failure. Gastroenterology 2002; 122: 1822–8
- El‐Serag H. B., Tran T., Everhart J. E. Diabetes increases the risk of chronic liver disease and hepatocellular carcinoma. Gastroenterology 2004; 126: 460–8
- Jackson R. A., Hawa I. M., Jaspan J. B., Sim B. M., SiSilvio L., Flatherbe D., et al. Mechanism of metformin action in non‐insulin‐dependent diabetes. Diabetes 1987; 36: 632–40
- Yki‐Järvinen H., Helve E., Sane T., Nurjhan N., Taskinen M‐R. Insulin inhibition of overnight glucose production and gluconeogenesis from lactate in NIDDM. Am J Physiol 1989; 256: E732–9
- Mitrakou A., Kelley D., Veneman T., Jenssen T., Pangburn T., Reilly T., et al. Contribution of abnormal muscle and liver metabolism to postprandial hyperglycemia in NIDDM. Diabetes 1990; 39: 1381–90
- Scheen A. J., Luyckx F. H. Obesity and liver disease. Best Pract Res Clin Endocrinol Metab 2002; 16: 703–16
- Tiikkainen M., Bergholm R., Vehkavaara S., Rissanen A., Hakkinen A. M., Tamminen M., et al. Effects of identical weight loss on body composition and features of insulin resistance in obese women with high and low liver fat content. Diabetes 2003; 52: 701–7
- Mayerson A. B., Hundal R. S., Dufour S., Lebon V., Befroy D., Cline G. W., et al. The effects of rosiglitazone on insulin sensitivity, lipolysis, and hepatic and skeletal muscle triglyceride content in patients with type 2 diabetes. Diabetes 2002; 51: 797–802
- Bajaj M., Suraamornkul S., Pratipanawatr T., Hardies L. J., Pratipanawatr W., Glass L., et al. Pioglitazone reduces hepatic fat content and augments splanchnic glucose uptake in patients with type 2 diabetes. Diabetes 2003; 52: 1364–70
- Carey D. G., Cowin G. J., Galloway G. J., Jones N. P., Richards J. C., Biswas N., et al. Effect of rosiglitazone on insulin sensitivity and body composition in type 2 diabetic patients. Obes Res 2002; 10: 1008–15
- Miyazaki Y., Mahankali A., Wajcberg E., Bajaj M., Mandarino L. J., DeFronzo R. A. Effect of pioglitazone on circulating adipocytokine levels and insulin sensitivity in type 2 diabetic patients. J Clin Endocrinol Metab 2004; 89: 4312–9
- Sutinen J., Kannisto K., Korsheninnikova E., Fischer R. M., Ehrenborg E., Nyman T., et al. Effects of rosiglitazone on gene expression in subcutaneous adipose tissue in highly active antiretroviral therapy‐associated lipodystrophy. Am J Physiol Endocrinol Metab 2004; 286: E941–9
- Sutinen J., Häkkinen A‐M. . , Westerbacka J., Seppälä‐Lindroos A., Vehkavaara S., Halavaara J., et al. Rosiglitazone in the treatment of HAART‐associated lipodystrophy ‐ a randomized double‐blind placebo‐controlled study. Antiviral Ther 2003; 8: 199–207
- Neuschwander‐Tetri B. A., Brunt E. M., Wehmeier K. R., Oliver D., Bacon B. R. Improved nonalcoholic steatohepatitis after 48 weeks of treatment with the PPAR‐gamma ligand rosiglitazone. Hepatology 2003; 38: 1008–17
- Promrat K., Lutchman G., Uwaifo G. I., Freedman R. J., Soza A., Heller T., et al. A pilot study of pioglitazone treatment for nonalcoholic steatohepatitis. Hepatology 2004; 39: 188–96
- Yki‐Järvinen H. Thiazolidinediones. N Engl J Med 2004; 351: 1106–18
- Westerbacka J., Lammi K., Häkkinen A‐M., Rissanen A., Salminen I., Aro A., Yki‐Järvinen H. Dietary fat content modifies liver fat in overweight nondiabetic subjects. J Clin Endocrinol Metab 2005; 90: 2804–9