Abstract
Background. Few studies have looked into the ability of measurements of apolipoprotein B (apoB) and apolipoprotein A-1 (apoA-1) or apoB/apoA-1 to predict new coronary heart disease (CHD) events in patients with CHD on statin treatment.
Aims. In the IDEAL trial, to compare lipoprotein components to predict CHD events and to what degree differences in those parameters could explain the observed outcome.
Methods. We compared the ability of treatment with atorvastatin 80 mg/day to that of simvastatin 20–40 mg/day to prevent CHD events in patients with CHD and used Cox regression models to study the relationships between on-treatment levels of lipoprotein components to subsequent major coronary events (MCE).
Findings. Variables related to low-density lipoprotein cholesterol (LDL-C) carried more predictive information than those related to high-density lipoprotein cholesterol (HDL-C), but LDL-C was less predictive than both non-HDL-C and apoB. The ratio of apoB to apoA-1 was most strongly related to MCE. However, for estimating differences in relative risk reduction between the treatment groups, apoB and non-HDL-C were the strongest predictors.
Interpretation. The on-treatment level of apoB/apoA-1 was the strongest predictor of MCE in the pooled patient population, whereas apoB and non-HDL-C were best able to explain the difference in outcome between treatment groups. Measurements of apoB and apoA-1 should be more widely available for routine clinical assessments.
Introduction
In clinical practice we need to know which component of plasma lipoproteins it is best to measure for estimating risk of atherosclerotic disease. Lipoproteins are complex macromolecules composed mainly of cholesterol, triglycerides, phospholipids, and various proteins called apolipoproteins. Low-density lipoproteins (LDL) and some species of very-low-density lipoproteins (VLDL) are atherogenic, and high plasma concentrations of LDL are associated with increased risk of atherosclerotic vascular disease. In contrast, most observational and experimental studies indicate that high concentrations of plasma high-density lipoproteins (HDL) are associated with low risk of atherosclerotic disease, even though the mechanisms by which HDL decrease risk are not as well established as those by which LDL increase risk.
Key messages
Of all lipoprotein variables, the ratio of apolipoprotein (apo) B to apolipoprotein A-1 was the best predictor of major coronary events in a statin-treated population. It carried as much information as apoB, apoA-1, LDL-C, and HDL-C together.
ApoB and non-HDL-C were the best variables to explain differences in outcome in major coronary heart events between the two treatment groups in the IDEAL trial.
For historical and practical reasons plasma concentrations of LDL and HDL have been approximated by calculating or measuring cholesterol (C) in each of these lipoprotein classes (LDL-C and HDL-C), whereas triglyceride concentration has been taken as an approximation of the concentration of VLDL. An alternative is to measure plasma concentrations of one of the characteristic protein components of the lipoproteins, i.e. apolipoprotein B (apoB) in LDL and VLDL, and apolipoprotein A-1 (apoA-1) in HDL. The ratio of the concentration of a component of LDL to that of a component of HDL, for example LDL-C/HDL-C or apoB/apoA-1, is a particularly powerful indicator of risk of coronary heart disease (CHD). An argument in favour of measuring apolipoproteins rather than cholesterol is that apoB concentrations are a valid measure of the concentration of VLDL as well as LDL, because each particle of VLDL or LDL contains only one molecule of apoB. In studies such as AMORIS Citation1, Citation2, INTERHEART Citation3, and others Citation4–10 the apoB/apoA-1 ratio was in fact the strongest single predictor of cardiovascular events.
These relationships have also been studied in populations of patients treated with high-density lipoprotein cholesterol reductase inhibitors (statins) Citation10–12. In the LIPID trial, LDL-C did not add significant predictive information once the apoB concentration was given Citation12, suggesting that apoB is the better measurement. In contrast, measuring apoA-1 did not add to the information conveyed by HDL-C. In the AFCAPS/TexCAPS trial, performed in subjects free of CHD with lower than average HDL-C Citation11, the ratio of apoB to apoA-1 was the best predictor of CHD events. The difference between these findings might be due to the heterogeneity of HDL. Some HDL particles may even be proatherogenic Citation13, Citation14. More studies of various patient populations, including populations of statin-treated patients, are therefore needed to work out the relationships between HDL-C, apoA-1 and risk of CHD.
The IDEAL study (Incremental Decrease in End-points through Aggressive Lipid-lowering) was a large trial comparing intensive cholesterol-lowering therapy (atorvastatin 80 mg/day) with standard therapy (simvastatin 20–40 mg/day). The design and principal results of the trial have been published Citation15, Citation16. The purpose of the current research was to compare in the IDEAL database the power of the on-treatment levels of conventional risk factors, such as total cholesterol, LDL-C and HDL-C, with those of apoB, apoA-1 and with the apoB/apoA-1 ratio to predict the incidence of major coronary disease events (MCE) in both treatment groups combined, adjusting for relevant potential confounders. In addition, we wanted to compare the ability of these on-treatment lipoprotein parameters to predict the difference in relative risk reduction of MCE between the atorvastatin and simvastatin treatment groups.
Patients and methods
In brief, we used a prospective, randomized, open-label, blinded-end-point evaluation (PROBE) design Citation17 and randomized 8,888 patients with a history of confirmed acute myocardial infarction to treatment with either atorvastatin 80 mg daily or simvastatin 20 or 40 mg daily. On average, LDL-C was 0.6 mmol/L lower in the atorvastatin group than in the simvastatin group. The occurrence of MCE, the primary end-point, was non-significantly lower in the atorvastatin group. The hazard ratio (HR) of time to first occurrence of a MCE was 0.89 (CI: 0.78–1.01; P=0.07). In contrast, there were statistically significant differences in occurrence of the secondary end-points in favour of atorvastatin treatment (e.g. for the class any cardiovascular event (CVE), HR was 0.86; CI: 0.80–0.92; P<0,0001). We measured plasma concentrations of various lipoprotein components 12 and 24 weeks after randomization and semi-annually thereafter, and the occurrences of MCE were recorded during an average follow-up of 4.8 years.
Patients were men (80.8%) and women less than 80 years of age who qualified for statin therapy according to national guide-lines. The list of exclusion criteria did not include lipoprotein concentrations. Randomization was 1:1 to atorvastatin or simvastatin, and there was no wash-out or run-in period. Patients were seen at 12 and 24 weeks and every 6 months thereafter. The simvastatin dose could be increased from 20 mg to 40 mg daily if the plasma cholesterol concentration at 24 weeks was 5.0 mmol/L or higher. Except for such cases, plasma lipid concentrations were not revealed to study personnel during the study. Overall adherence to study drugs was 89% in the atorvastatin group and 95% in the simvastatin group. For this analysis we used the average concentrations of lipoprotein lipids and apolipoproteins measured at 12 and 24 weeks to avoid the influence of measurement errors inherent in studies in which single values are used for prediction purposes. LDL-C was calculated by the Friedewald formula Citation18, and apolipoproteins B and A-1 were measured by turbidimetric methods with calibration to the World Health Organization International Federation of Clinical Chemistry primary standard (WHO-IFCC) Citation19, Citation20. In this prospective subgroup analysis of the IDEAL population, we included only patients who had survived to the 6-months visit without a MCE since start and with complete 12 and 24 weeks values of LDL-C, HDL-C, apoB, and apoA-1. MCE was defined as coronary death, non-fatal myocardial infarction, or resuscitation after cardiac arrest. Any CVE included MCE and, in addition, revascularizations, unstable angina, cerebrovascular disease, or peripheral arterial disease. These analyses include 679 patients with MCE and 1701 patients with any CVE.
Statistical methods
Relationships between lipoprotein variables as risk factors and the occurrence of MCE were analysed by the Cox proportional hazards model with fixed covariates, with adjustments for age, sex, and smoking (current, previous, never) as recorded at base-line. The strengths of relationships for single variables were calculated as the MCE hazard ratios of one standard deviation (SD) decrease in the variables already known to increase risk. Since this method deals with only one variable at a time, however, comparisons of predictive information for different models with multiple terms were made by calculating differences between chi-square model statistics. Likelihood ratio chi-square tests for additive terms were performed with degrees of freedom equal to the number of variables added. Whereas hazard ratios do not account for the spectrum of variations in the data, the chi-square value includes both strength and variations, in analogy to the difference between a slope and a squared correlation coefficient in a simple regression model. That is why the two methods, hazard ratios and chi-square information values, may give a different rank order of prediction importance between the lipoprotein parameters. The predictive power of total cholesterol was used as a reference against which we compared the information provided by other lipoprotein parameters. In some calculations smoking was used as a reference as well. We did not use receiver-operating characteristic (ROC) analysis as our main method for comparison purposes between different models, because area comparisons can be insensitive to the effect of added variables Citation21. However, a couple of such calculations are made for comparison reasons. Instead we calculated the so-called net reclassification improvement (NRI) proportion, which is the proportion of MCE cases that could be reclassified into a higher risk group by including information provided by a new risk marker and then adding the proportion of non-MCE cases reclassified downwards in risk category Citation22, Citation23. Three logistic regression models were run, one adding smoking at base-line to age and gender, another adding in-trial apoB/apoA-1 to age and gender, and the final adding in-trial total cholesterol (TC)/HDL-C ratio to age and gender. We created four categories of MCE risk based on observation of actual MCE occurring after the first 6 moths of the trial: 0%–5%, 5%–7.5%, 7.5%–10.0%, and >10.0%.
We also wanted to explore the ability of lipoprotein parameters, known to be associated with high risk, to explain the between-treatment group differences in MCE in the trial. We therefore used adjusted models for LDL-C, non-HDL-C, apoB, LDL-C/HDL-C, TC/HDL-C, and apoB/apoA-1 to calculate the relative risk reduction from 6 months onwards with 95% confidence limits from the observed differences in change from base-line to 12 and 24 weeks between treatment groups. (Formula: 1–Exponential (beta + -1.96×SE)×D, where D = observed difference in change from base-line in the exposure variable between treatment groups. Beta is the non-standardized regression coefficient of exposure variable, and SE is the standard error.) These estimated relative risks were then compared with those observed between treatment groups from 6 months onwards (relative risk reduction (RRR) = 14%; CI: 0%–26%; P = 0.05). In these comparisons it is not sufficient for validation of the observed results that the lipoprotein variable is highly predictive. There must also be a difference in the ability of the two drugs to affect the variable. The differences in change from base-line in lipoprotein variables between treatment groups at 3 and 6 months are given as plasma concentrations as well as in standard deviation units of change since base-line.
Results
Out of 8888 patients randomized in IDEAL, we excluded, for the present analyses, 198 patients who died or had an MCE during the first 6 months. We also excluded 126 patients who lacked an average of the 12 and 24 weeks values of LDL-C, HDL-C, apoB, or apoA-1. Of the remaining 8564 patients, 679 subjects had a MCE suitable for analysis. Patients were recruited from Norway (27.5%), Sweden (28.5%), Denmark (22.9%), Finland (5.8%), and The Netherlands (15.3%). Median follow-up time to first occurrence of MCE was 4.3 years. The average age was 61.7 (SD 9.4) years; 6927 (80.9%) were men; 1745 (20.4%) were current smokers, 5012 (58.5%) were previous smokers, and 1806 (21.1%) had never smoked. Seventy-six per cent of the patients were already on statins when they entered the trial, and two-thirds of them used simvastatin. gives lipid and apolipoprotein values at base-line as well as the averages of 12- and 24-week measurements by treatment group. At base-line there were no differences between the two treatment groups. At 12/24 weeks the average LDL-C was below the guide-line recommendation of 2.5 mmol/L in 86.1% of the patients in the atorvastatin group and in 43.9% of patients in the simvastatin group. HDL-C and apoA-1 were slightly but significantly higher in the simvastatin than in the atorvastatin group.
Table I. Mean (SD) of base-line and average 12- and 24-week lipoprotein parameters (n=8564).
In we give results of the analyses of the two treatment groups combined. Comparisons from nine different prediction models for MCE are possible. The list in starts with the three adjustment factors having estimated information chi-square value of 89.9 (−2× log likelihood) for MCE. Adding TC into this model increases model chi-square to 100.0 with one additional degree of freedom (P<0.0001). LDL-C adds chi-square value by about 30% more than TC (13.0 − 10.1 = 2.9 = Δ chi-square), non-HDL-C adds 65% (chi-square = 6.5), and apoB is almost twice as predictive as TC (19.8 versus 10.1).
Table II. Log likelihood chi-square statistics of MCE risk from 6 months onwards from Cox proportional hazards model and hazard ratios for 1 SD decrease with single lipoprotein parameters measured as average of 12 and 24 weeks, each adjusted for age, sex, and smoking.
Both variables already known to be associated with low risk (HDL-C and apoA-1) carried less predictive information than did the variables associated with high risk (TC, LDL-C, apoB). HDL-C provided only border-line significant information in addition to that of the adjustments factors (chi-square = 4.3; P=0.04), whereas apoA-1 carried about 70% (6.7 out of 10.1) of the information provided by TC (chi-square = 6.7; P=0.01). The ratios LDL-C/HDL-C and TC/HDL-C carried the information of about two independent factors such as TC, whereas the ratio apoB/apoA-1, in the case of MCE, provided three times more information (29.9 versus 10.1) (). gives a rank order of the added chi-square information for each variable over and above age, gender, and smoking. The effects of lipoprotein components on the risk of the extended secondary end-point any CVE were quantitatively similar but, due to larger numbers, statistically more significant (data not shown). The two methods for comparing the predictive power (HR or chi-square information content) of single variables gave similar but not identical rank orders. A graphical display comparing MCE hazard ratios by quintiles of apoB and LDL-C is given in . Risk seems to increase more clearly as a function of apoB than of LDL-C. We have also used receiver-operating characteristics (ROC) curve analyses to compare ROC areas between LDL-C and apoB/apoA-1. Adjusted for age, sex, and smoking the ROC area for LDL-C was 0.61 and that for apoB/apoA-1 was 0.62, i.e. not significantly different, possibly because ROC curve analysis tends to be less sensitive than chi-square analysis.
Figure 1. Added chi-square information value of each lipoprotein component on major coronary event (MCE) over and above age, gender, and smoking, ranked according to importance. For abbreviations see footnotes to Table II.
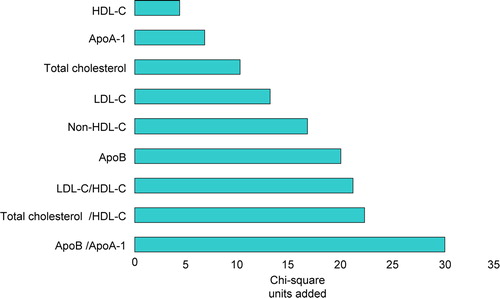
Figure 2. Hazard ratio (HR) of major coronary event (MCE) with 95% CI by quintiles of in-trial LDL-C (Panel A) and apoB (Panel B), adjusted for age, gender, and smoking.
If smoking was added to age and sex in one model for MCE, and apoB/apoA-1 to age and sex in another, both of these models had the same chi-square information, indicating equal power of smoking and apoB/apoA-1 to provide predictive information. The NRI proportions for smoking, apoB/apoA-1, and TC/HDL-C were 7.8%, 6.8%, and 6.5%, respectively, showing by this cruder but clinically more relevant method that the three factors did not differ much in their ability to reclassify patients into more correct risk categories over and above age and gender when they were compared by parallel models.
shows comparisons of the ability of various combinations of lipoprotein variables to predict MCE in the combined treatment groups of the IDEAL trial. As an example, the combination of LDL-C and apoB provides no information in addition to that already provided by apoB, whereas it provides significantly more information than that provided by LDL-C. In other words, the concentration of LDL-C is quite clearly of no additional predictive value once the concentration of apoB is known. In contrast, the analysis indicated no significant difference in the predictive information carried by HDL-C and apoA-1. None of the ratios LDL-C/HDL-C or TC/HDL-C added significant information over and above apoB/apoA-1, whereas apoB/apoA-1 added significantly to the information provided by LDL-C/HDL-C (and to TC/HDL-C). Thus, the apolipoprotein ratio was a better predictor of risk than any of the ratios based on the cholesterol component of lipoproteins. Moreover, the addition of apoB/apoA-1 to LDL-C, HDL-C, apoB, or apoA-1, or one of several combinations of these various components, such as the combination of apoB and apoA-1, provided no predictive information over and above that already present in this ratio.
Table III. Model comparisons of joint versus single variable chi-square statistics for MCE, adjusted for age, gender, and smoking.
The data in indicate how well on-treatment lipoprotein parameters, measured at 12 and 24 weeks, predict the differences in rates of MCE observed in the two treatment groups of the trial. Atorvastatin reduced the relative risk of MCE, adjusted for age, sex, and smoking, by 14% (0%–26%; P=0.05). This value is slightly higher than that published earlier Citation16, because we calculated the latter from data also obtained during the first 6 months, when rates of MCE in the two treatment groups did not differ as much as later in the trial. Lipoprotein components associated with high risk showed good internal consistency with confidence intervals covering the observed MCE outcome from 6 months onwards. This pertained especially to apoB and non-HDL-C, but also to TC and LDL-C. Of the ratios, only apoB/apoA-1 predicted the observed outcome reasonably well (90%), whereas LDL-C/HDL-C and TC/HDL-C failed to predict outcome (confidence intervals did not include the observed hazard ratio). The ratios have the disadvantage that, in this particular trial, their denominators were not affected very much by either statin. Thus, the use of HDL-C and apoA-1 introduced mainly extra measurement errors. Measured in SD units, the two statins had greater effects on lipoprotein variables increasing risk (apoB, non HDL-C, LDL-C, and TC) than on the ratios. Thus, although the latter, especially apoB/apoA-1, were good predictors of events in the IDEAL cohort as a whole, they were not powerful predictors of the differences in event rates between the two treatment groups.
Table IV. Estimated MCE hazard ratio (95% CI) from 6 months onwards of atorvastatin versus simvastatin from observed DELTA with per cent of estimated relative risk reduction out of observed. Adjustments are made for age, gender, and smoking.
Discussion
The results of these IDEAL trial post hoc analyses from both treatment groups combined support the concept that concentrations of the protein components of plasma lipoproteins are better predictors of cardiovascular risk than are their cholesterol components. Apolipoprotein B was a stronger predictor of MCE than were both LDL cholesterol and non-HDL cholesterol. Apolipoprotein A-1 also tended to be a stronger predictor than HDL-cholesterol, but this difference was not statistically significant, possibly because of lack of statistical power and because of HDL heterogeneity: the HDL-C risk curve may be non-linear at very high levels Citation24, and some large, relatively cholesterol-rich HDL particles might be associated with higher not lower risk, especially when apoA-1 is not increased simultaneously. The ratio of apoB to apoA-1 was a particularly strong predictor of MCE and CVE in the IDEAL cohort as a whole, containing as much predictive information of risk as LDL-C, HDL-C, apoB, and apoA-1 together. It is apparent from and , however, that it is the numerator in the ratio, apoB, which contributed most to the predictive power of the ratio. As apoB concentrations are more closely related to the metabolic syndrome and insulin resistance than those of LDL-C Citation25, Citation26, they are of particular interest in those patient subgroups.
Smoking is regarded as the single most important factor in both primary and secondary cardiovascular prevention, and it is therefore notable that apoB/apoA-1 carried predictive information similar to that of the smoking variable, as assessed by added chi-square value or NRI calculations.
The power of apoB relative to that of apoA-1 is even more apparent in our analysis of the ability of lipoprotein components and of ratios of one component to another to predict the difference in MCE outcome between the atorvastatin and the simvastatin group (). Although the ratio of apoB to apoA-1 predicted the difference in outcome better than ratios based on cholesterol, the single variables, apoB and non-HDL-C, were the strongest predictors. This result is due to the modest effects of both treatments on apoA-1 and HDL-C, measurements of which are therefore particularly liable to the effects of random variation. In this analysis, therefore, the ability of the ratio of apoB to apoA-1 to explain the difference in risk of MCE between treatment groups was necessarily less than that of apoB.
There is an important difference between the ability of a risk factor to predict cardiovascular events in a population (such as the whole IDEAL cohort) and the ability to explain differences in cardiovascular events between treatment groups in a clinical trial (such as the atorvastatin and simvastatin groups in the IDEAL cohort). The latter is obviously of particular significance for monitoring treatment in daily clinical practice, since the physician should be able to gauge the degree to which reduction in risk is being achieved by the treatment he has prescribed. Whereas the ratio of apoB to apoA-1 was the strongest predictor of MCE in the whole IDEAL cohort, the single variables, apoB and non-HDL-C, were the strongest predictors of the difference in MCE between the treatment groups. If the drugs being tested had had a greater effect on apoA-1 or HDL-C, the ratio of apoB to apoA-1, or the ratio of TC to HDL-C, might have predicted the trial outcome more effectively than either the numerator or the denominator given as single risk factors. Thus, establishing which lipoprotein variable is the best predictor of treatment outcome when monitoring therapy might in fact depend on the mode of treatment.
Since 76% of the patients entering the study were already taking statins at base-line and about two-thirds of them were taking simvastatin, the changes of lipoprotein components were only minor in the simvastatin group. Nevertheless, a wide range of the distribution of the atherogenic components was achieved when both groups were pooled without major differences in relational slopes between them increasing the statistical power.
Limitations
We decided to exclude data from the first 6 months of the trial to strike a balance between the need to maintain maximal statistical power with a study population as close to the randomized as possible and the desirability of reducing error in measuring lipoprotein components by using the average of two measurements made 3 months apart. Thus, the estimates of effect sizes for single variables may be slightly conservative. Had LDL-C been measured directly rather than calculated, moreover, it might have emerged as a stronger predictor than seen in this substudy of the IDEAL trial.
The IDEAL protocol stipulated an increase in statin doses if TC remained above 5.0 mmol/L at the 24-week visit. In practice, this requirement changed the concentration of LDL-C by less than 1%, and the statistical power in our comparisons of the behaviour of various lipoprotein components was therefore not materially affected.
Conclusions
In the combined IDEAL cohort of statin-treated patients with CHD, apoB/apoA-1 was a stronger predictor of new MCE than the conventional predictors TC, LDL-C, or the apolipoproteins alone. However, the single variables apoB and non-HDL-C were better predictors than the apoB/apoA-1 ratio, or any of the above-mentioned lipoprotein components, of trial outcome, i.e. they were strongest predictors of difference in MCE rates between the two treatment groups. The clinical implications of these findings must await results from analyses of other trial databases. In the future, measurements of on-treatment apoB and apoA-1 may become more widely available for routine clinical assessment and help physicians to monitor the efficacy of treatment.
References
- Walldius G, Jungner I, Holme I, Aastveit AH, Kolar W, Steiner E. High apolipoprotein B, low apolipoprotein A-I, and improvement in the prediction of fatal myocardial infarction (AMORIS study): a prospective study. Lancet. 2001; 358: 2026–33
- Walldius G, Aastveit AH, Jungner I. Stroke mortality and the apoB/apoA-I ratio: results of the AMORIS prospective study. J Intern Med. 2006; 259: 259–66
- Yusuf S, Hawken S, Ounpuu S, Dans T, Avezum A, Lanas F, et al. Effect of potentially modifiable risk factors associated with myocardial infarction in 52 countries (the INTERHEART study): case-control study. Lancet. 2004; 364: 937–52
- Lamarche B, Moorjani S, Lupien PJ, Cantin B, Bernard PM, Dagenais GR, et al. Apolipoprotein A-1 and B levels and the risk of ischemic heart disease during a five- year follow-up of men in the Québec Cardiovascular Study. Circulation. 1996; 94: 273–8
- Liu J, Sempos C, Donahue RP, Dorn J, Trevisan M, Grundy SM. Joint distribution of non-HDL and LDL cholesterol and coronary heart disease risk prediction among individuals with and without diabetes. Diabetes Care. 2005; 28: 1916–21
- Pischon T, Girman CJ, Sacks FM, Rifai N, Stampfer MJ, Rimm EB. Non-high-density lipoprotein cholesterol and apolipoprotein B in the prediction of coronary heart disease in men. Circulation. 2007; 112: 3375–83
- Sniderman AD, Furberg CD, Keech A. Apolipoproteins versus lipids as indices of coronary risk and as targets for statin therapy treatment. Lancet. 2003; 361: 777–80
- Sniderman AD. Report of the Thirty Person/Ten Country Panel. ApoB versus Cholesterol to Estimate Cardiovascular Risk and to Guide Therapy. J Intern Med. 2006; 259: 247–58
- Talmud PJ, Hawe E, Miller GJ, Humphries SE. Nonfasting apolipoprotein B and triglyceride levels as a useful predictor of coronary heart disease risk in middle-aged UK men. Arterioscler Thromb Vasc Biol. 2002; 22: 1918–23
- Walldius G, Jungner I. The apoB/apoA-I ratio: a strong, new risk factor for cardiovascular disease and a target for lipid-lowering therapy—a review of the evidence. J Intern Med. 2006; 259: 493–519
- Gotto AM, Jr, Whitney E, Stein EA, Shapiro DR, Clearfield M, Weis S, et al. Relation between baseline and on-treatment lipid parameters and first acute major coronary events in the Air Force/Texas Coronary Atherosclerosis Prevention Study (AFCAPS/TexCAPS). Circulation. 2000; 101: 477–84
- Simes RJ, Marschner IC, Hunt D, Colquhoun D, Sullivan D, Stewart RAH, et al. Relationship Between Lipid Levels and Clinical Outcomes in the Long-Term Intervention With Pravastatin in Ischemic Disease (LIPID) Trial: To What Extent Is the Reduction in Coronary Events With Pravastatin Explained by On-Study Lipid Levels?. Circulation. 2002; 105: 1162–9
- Asztalos BF, Collins D, Cupples A, Demissie S, Horvath KV, Bloomfield HE, et al. Value of High-Density Lipoprotein (HDL) Subpopulations in Predicting Recurrent Cardiovascular Events in the Veterans Affairs HDL Intervention Trial. Arterioscler Thromb Vasc Biol. 2005; 25: 2185–91
- Shah PK, Kaul S, Nilsson J, Cercek B. Exploiting the vascular protective effects of high-density lipoprotein and its apolipoproteins. An idea whose time for testing is coming. Part I. Circulation. 2001; 104: 2376–83
- Pedersen TR, Faergeman O, Kastelein JJP, Olsson AG, Tikkanen MJ, Holme I, et al. Design and baseline characteristics of the incremental decrease in end points through aggressive lipid lowering study. Am J Cardiol. 2004; 94: 720–4
- Pedersen TR, Faergeman O, Kastelein JJP, Olsson AG, Tikkanen MJ, Holme I, et al. High-dose atorvastatin vs usual dose simvastatin for secondary prevention after myocardial infarction. The IDEAL study: A randomized controlled trial. JAMA. 2005; 294: 2437–45
- Hansson L, Hedner T, Dahlof B. Prospective randomized open blinded endpoint (PROBE) study: a novel design for intervention trials. Blood Press. 1992; 1: 113–9
- Friedewald WT, Levy EI, Fredrichson DS. Estimation of the concentration of low-density lipoprotein cholesterol in plasma, without use of the preparative ultracentrifuge. Clin Chem. 1972; 18: 499–502
- Marcovina SM, Albers JJ, Henderson LO, Hannon WH. International Federation of Clinical Chemistry standardization project for measurements of apolipoproteins A-I and B. III. Comparability of apolipoprotein A-I values by use of International Reference Material. Clin Chem. 1993; 39: 773–81
- Marcovina SM, Albers JJ, Kennedy H, Mei JV, Henderson LO, Hannon WH. International Federation of Clinical Chemistry standardization project for measurements of apolipoproteins A-I and B. IV. Comparability of apolipoprotein B values by use of International Reference Material. Clin Chem. 1994; 40: 586–92
- Hanley JA. Receiver Operating Characteristic (ROC) Curves. Encyclopedia of Biostatistics, P Armitage, T. Colton. Wiley, Chichester 1998; 3738–45
- Ingelsson E, Schaefer EJ, Contois JH, McNamara JR, Sullivan L, Keyes MJ, et al. Clinical utility of different lipid measures for prediction of coronary heart disease in men and women. JAMA. 2007; 298: 776–85
- Pencina MJ, D'Agostino RB Sr, D'Agostino RB, Jr, Vasan RS. Evaluating the added predictive ability of a new marker: from area under the ROC curve to reclassification and beyond. Stat Med. 2008;27:157–72.
- Stensvold I, Urdal P, Thurmer H, Tverdal A, Lund-Larsen PG, Foss OP. High-density lipoprotein cholesterol and coronary, cardiovascular and all cause mortality among middle-aged Norwegian men and women. Eur Heart J. 1992; 13: 1155–63
- Holme I, Hostmark AT, Anderssen SA. ApoB but not LDL-cholesterol is reduced by exercise training in overweight healthy men. Results from the 1-year randomized Oslo Diet and Exercise Study. J Int Med. 2007; 262: 235–43
- Sierra-Johnson J, Romero-Corral A, Somers VK, Lopez-Jiminez F, Walldius G, Hamsten A, et al. ApoB/apoA-I ratio: an independent predictor of insulin resistance in US non-diabetic subjects. Eur Heart J. 2007; 28: 2637–43