Abstract
Background. High leptin and low ghrelin are associated with the metabolic syndrome (MS).
Aims and methods. Ghrelin, leptin (RIA kits), and insulin-like growth factor I (IGF-I) (ELISA kit) concentrations of the population-based cohort of 1045 subjects and their interactions with metabolic parameters were analysed. Intima-media thickness (IMT) was measured with carotid ultrasound.
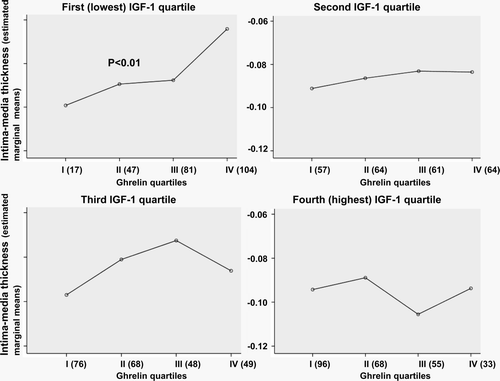
Results. The interaction between leptin and ghrelin on the MS was significant (P=0.011). An additive effect of high leptin and low ghrelin on metabolic disturbances was observed: low ghrelin concentration (adjusted for age and sex) (P<0.001) was associated with the MS and type 2 diabetes in the highest but not in the lower leptin quartiles. In the highest leptin quartile, ghrelin concentrations decreased linearly when the number of International Diabetes Federation MS criteria met (P<0.01) increased. Ghrelin-leptin relation was independently associated with carotid IMT (P<0.005). The independent positive association (P<0.01) between the plasma ghrelin quartile and the carotid IMT was evident in the lowest IGF-I quartile.
Conclusions. Low ghrelin is associated with MS and type 2 diabetes in the presence of insulin and leptin resistance. Ghrelin-leptin relation is associated with early atherosclerosis. The interaction between IGF-I and ghrelin modifies the association of ghrelin with early atherosclerosis.
Introduction
Ghrelin and leptin, two peptide hormones, interact with each other in the control of appetite Citation1. Recent data suggest that ghrelin has an important role in the central regulation of leptin secretion Citation2. Fasting plasma ghrelin levels are negatively correlated with those of leptin Citation3 suggesting antagonism of the two peptides. Ghrelin is downregulated in human obesity, and this downregulation may be a consequence of elevated insulin or leptin Citation3. The main effects of these peptide hormones on obesity-related phenotypes have been explored. Thus, high leptin Citation4–7 and low ghrelin Citation8, Citation9 have been associated with the development of the metabolic syndrome (MS) and the risk of type 2 diabetes in some studies Citation10, Citation11. However, the interactions between leptin and ghrelin, although not yet studied in the clinical setting, could also play a role in the pathogenesis of the clustering of metabolic abnormalities.
In addition to leptin, another significant determinant of ghrelin concentration is potentially the insulin-like growth factor 1 (IGF-I). Ghrelin, a somatotropic peptide Citation12, is negatively associated with IGF-1 concentrations Citation13. Obesity, gender, insulin resistance, and type 2 diabetes modify the association between ghrelin and IGF-I Citation13. IGF-I deficiency has been shown to increase the cardiovascular risk in some studies Citation14, Citation15. We have recently reported that carotid artery atherosclerosis is positively associated with ghrelin Citation16 and IGF-I Citation17 concentrations in males and females, respectively. How the inverse relationship and interaction between ghrelin and IGF-I affects early atherosclerosis remains unknown.
Key messages
Low ghrelin is associated with the metabolic syndrome and type 2 diabetes in the presence of insulin and leptin resistance.
Ghrelin-leptin relation is associated with early atherosclerosis.
The interaction between insulin-like growth factor 1 and ghrelin modifies the association of ghrelin with early atherosclerosis.
Therefore, the effects of ghrelin on metabolic disturbances and related atherosclerosis may be modified by other hormones and growth factors, such as leptin and IGF-I. Our main aim was to study whether leptin is a determinant of ghrelin effects on progression of the metabolic syndrome and atherosclerosis. In addition, we tested whether ghrelin-IGF-I interactions play a role in early atherosclerosis in the population-based cohort of middle-aged subjects.
Subjects and methods
This study is a part of the OPERA (Oulu Project Elucidating Risk of Atherosclerosis) project, which is a population-based, epidemiological cross-sectional study designed to address the risk factors and disease end points of atherosclerotic cardiovascular diseases. The study population and selection criteria have been previously described in detail Citation18. In short, 600 hypertensive subjects (300 men and 300 women, aged 40–59) were randomly selected from the national register for reimbursement of the costs of antihypertensive medication. For each hypertensive subject, an age- and sex-matched control subject was randomly selected. Altogether 1045 subjects volunteered in the study, which was approved by the Ethical Committee of the Faculty of Medicine, University of Oulu. Waist circumference was measured to the nearest 0.5 cm with a tape-measure midway between the lower rib margin and the iliac crest in light expirium. Blood pressure was measured according to the recommendations of the American Society of Hypertension in a sitting position from the right arm with an oscillometric device (Dinamap® model 18465X, Criticon Ltd, Ascot, UK) after an overnight fast and after a 10–15-minute rest. Three measurements were made at 1-minute intervals, and the means of the last two were used in the analyses.
Abbreviations
All the laboratory test samples were obtained after an overnight fast (timing of blood samples varied between 7.00 and 10.00 a.m.). Plasma was separated from venous blood and stored at 4°C. The venous blood glucose concentration was determined with the glucose dehydrogenase method. Type 2 diabetes was determined according to the World Health Organization criteria Citation19. The concentrations of total cholesterol and triglycerides in the plasma and lipoprotein fractions were determined by enzymatic colourimetric methods (kits of Boehringer Diagnostica, Mannheim GmbH, Germany, catalogue nos. 236691 and 701912, respectively) using Kone Specific analyser (Kone Specific, Selective Chemistry Analyser, Kone Instruments, Espoo, Finland). The very-low-density lipoprotein (VLDL) fraction (d < 1.006 g/mL) was separated from plasma by ultracentrifugation in a Kontron TFT 45.6 rotor at 105,000 g and 15°C for 18 h. The VLDL fraction was removed from the ultracentrifuged preparation by tube slicing. The plasma high-density lipoprotein (HDL) cholesterol concentration was determined by mixing 1 mL of the VLDL-free fraction with 25 µL of 2.8% (w/v) heparin and 25 µL of 2M manganese chloride and by measuring the cholesterol concentration in the supernatant after centrifugation at 1000 g and 4°C for 30 minutes. Fasting plasma ghrelin concentrations were analysed using a commercial radioimmunoassay (RIA) kit recognizing both acylated and des-acylated ghrelin (Phoenix Pharmaceuticals Inc., Belmont, California, USA) as we have described earlier Citation11. The intra- and interassay coefficients of variation (CV), as given by the manufacturer, were 4.0% and 7.5%, respectively, for ghrelin. Interassay CV in the analyses of this study was 11.2%. Fasting ghrelin concentrations correlate strongly with the 24-h integrated area under the curve (AUC) ghrelin values Citation20, and therefore fasting plasma ghrelin concentrations were analysed to obtain a measure of overall ghrelin concentrations. Fasting plasma leptin concentrations were measured using a commercial double antibody RIA (Human Leptin RIA Kit; Linco Research, Inc., St. Charles, MO) with an intra-assay CV of 3.4%–8.3% and an interassay CV of 3.0%–6.2%. Fasting plasma total IGF-I concentration was determined using a commercial kit which uses a modified version of the standard acid-ethanol extraction procedure (DSL-10-2800 ACTIVE Non-Extraction IGF-I ELISA, Diagnostic Systems Laboratories, Webster, TX, USA) with intra- and interassay CV of 4.5%–8.6% and 3.3%–6.8%, respectively.
The 2005 International Diabetes Federation criteria (IDF) definition of the MS was used Citation21. According to the IDF definition, for persons to be defined as having the MS, they must have: Central obesity (defined as waist circumference ≥94 cm for men and ≥80 cm for women) plus any two of the following four factors: raised serum triglyceride level (≥1.7 mmol/L) (or specific treatment for this lipid abnormality), reduced serum HDL cholesterol level (<1.03 mmol/L in males and <1.29 mmol/L in females) (or specific treatment for these lipid abnormalities), raised blood pressure (systolic blood pressure ≥130 mmHg or diastolic blood pressure ≥ 85 mmHg), or treatment of previously diagnosed hypertension, and impaired fasting glycaemia (fasting plasma glucose ≥5.6 mmol/L), or previously diagnosed type 2 diabetes.
Intima-media thickness (IMT) was measured with the carotid ultrasound procedure as described in our earlier paper Citation16. Insulin sensitivity was assessed using fasting plasma insulin concentrations and a quantitative insulin sensitivity check index (QUICKI = 1/(log (fasting insulin) + log (fasting glucose))) Citation22.
Statistical methods
To compare the means of the variables measured, Student's t test and analysis of variance (ANOVA) were used. Correlations were tested with Pearson's correlation. The associations were examined using linear and logistic regression analyses. The effect of the confounding factors on dependent variables was controlled for by adding them into the multivariate models. The following variables were entered into the multivariate models as covariates: sex and age. Odds ratios (OR) with 95% confidence intervals (CI) were used to compare the effect of independent variables on the dependent variable.
To normalize the distribution a logarithm transformation was applied to leptin, IGF-1, QUICKI, and to all intima-media thickness (IMT) measurements. All calculations were made with the SPSS (version 9.0; SPSS, Inc.) statistical package. P-value < 0.05 was regarded as significant.
The possible interaction between leptin and the ghrelin quartile on MS (sum of individual components, maximum 5) was assessed using analysis of covariance (ANCOVA) with the leptin and ghrelin quartile, age, sex, and the interaction term (leptin quartile×ghrelin quartile) included in the model. The interaction between IGF-I and ghrelin on IMT was tested in a similar manner.
The relation between ghrelin and leptin was calculated from direct arithmetical ratio of crude ghrelin and leptin values.
Results
The basic characteristics of study subjects by study group and gender are shown in . Use of selected medication among the hypertensive and control cohorts by gender is shown in .
Table I. Main characteristics of the control and hypertensive cohorts by gender. Values are means (SD) or percentages.
Table II. Use of selected medications among the hypertensive and control cohorts by gender. Data are n (%).
The interaction between leptin and ghrelin on the MS was statistically significant (P = 0.011). We analysed the association of plasma ghrelin concentrations (adjusted for age and sex) in relation to the individual clinical features of the MS by IDF criteria in leptin quartiles. Of the criteria, the association of higher waist circumference (P < 0.01), blood pressure (P = 0.01), and fasting glucose (P<0. 01) with lower plasma ghrelin concentration was significant among subjects in the highest leptin quartile but not in the first, second, or third leptin quartile. The ghrelin concentrations were lower in subjects with MS compared to those without (P < 0.001) in the presence of the highest leptin quartile ().
Figure 1. Fasting plasma ghrelin concentrations (adjusted for age and sex) in subjects with the metabolic syndrome (MS) compared to those without in the leptin quartiles. Mean leptin levels (ng/mL) in leptin quartiles (95% confidence intervals) are: I: 3.5 (3.0–4.0); II: 6.6 (6.0–7.1); III: 10.6 (10.1–11.1); IV: 21.9 (21.3–22.4). Standard deviations for ghrelin levels varied from 205 to 249 pg/mL.
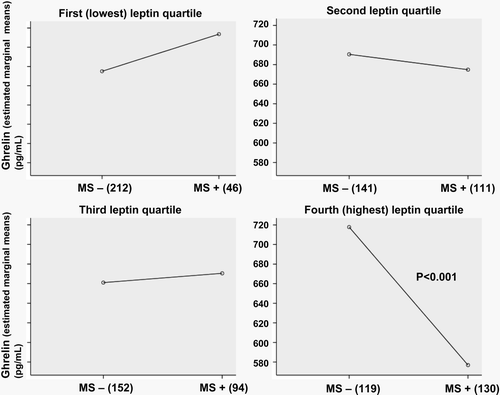
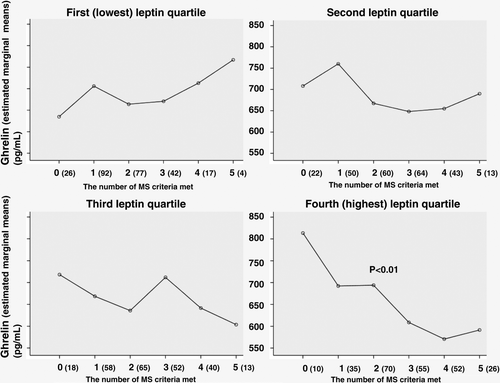
The ghrelin concentrations (adjusted for age and sex) varied in relation to the number of IDF criteria of MS met (P<0.01) in the subjects belonging to the highest leptin quartile (). Ghrelin levels decreased with an increase in the number of metabolic abnormalities in this quartile.
Figure 2. Fasting plasma ghrelin concentrations of the study subjects in relation to the number of International Diabetes Federation criteria of the metabolic syndrome (MS) met in leptin quartiles. Standard deviations for ghrelin levels varied from 176 to 333 pg/mL.
We have earlier reported an association of low ghrelin with insulin resistance Citation11. In this study we studied the association of ghrelin with insulin resistance in leptin quartiles. The ghrelin quartile was associated linearly with the QUICK index only in the individuals who were in the highest quartile of leptin when an adjustment for age and sex was made (P < 0.05). The mean (95% CI) QUICK index values in different ghrelin quartiles in the highest quartile of leptin were as follows: I (the lowest quartile): 0.55 (0.53–0.58); II: 0.58 (0.55–0.60); III: 0.58 (0.55–0.61); and IV (the highest quartile): 0.61 (0.58–0.64). In other leptin quartiles the ghrelin was not associated with the QUICK index values.
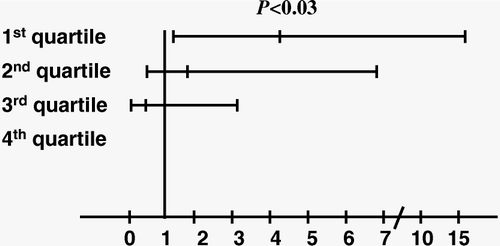
When leptin quartiles were considered, low ghrelin was a statistically significant predictor of type 2 diabetes in logistic regression analysis (P = 0.020) only among the subjects belonging to the highest leptin quartile. In this last subgroup, the subjects in the 1st ghrelin quartile were at higher risk of having type 2 diabetes compared to the subjects in the 4th quartile (OR = 4.2, 95%CI: 1.1–16.1, P = 0.037) after adjustment for age and sex ().
Figure 3. Odds ratios with 95% confidence intervals of ghrelin quartile for type 2 diabetes (the fourth ghrelin quartile is used as a reference category) obtained by logistic regression analysis adjusted for age and sex in the highest leptin quartile. Mean ghrelin levels in ghrelin quartiles (pg/mL) (95% confidence intervals) are: I: 376.6 (364.0–389.2); II: 574.3 (561.7–586.8); III: 743.8 (731.2–756.3); IV: 975.8 (963.2–988.3).
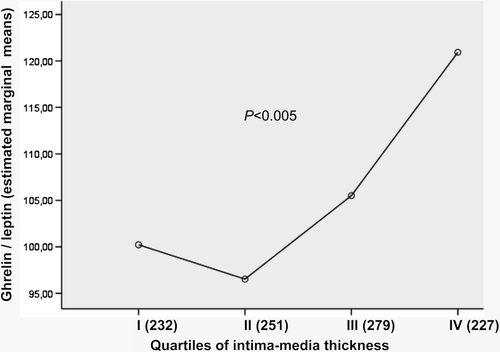
In the association of adjusted means for ghrelin-leptin relation in four IMT quartiles is shown. The highest ghrelin-leptin relation was associated with the highest IMT (P < 0.005). Analysis was performed for diabetics and non-diabetics separately, and the association was significant in both groups (data not shown).
Figure 4. Adjusted (age, sex, smoking, systolic blood pressure, LDL-cholesterol and study group) means for ghrelin-leptin relation in different intima-media thickness (IMT) quartiles. Mean IMT values (mm) in IMT quartiles (95% confidence intervals) are: I: 0.69 (0.68–0.70); II: 0.77 (0.76–0.78); III: 0.84 (0.83–0.85); IV: 1.02 (1.02–1.03). Standard deviations for mean ghrelin-leptin relation varied from 72 to 133.
Interaction between ghrelin and IGF-I quartile on IMT was significant (P < 0.05). Therefore, we studied whether plasma ghrelin concentrations are associated with the degree of subclinical atherosclerosis measured as IMT of carotid arteries when different levels of IGF-I are considered. For that purpose we divided IGF-I levels into quartiles. The positive linear association (P < 0.01) between plasma ghrelin quartile and carotid IMT existed only among subjects in the lowest IGF-I quartile (). In this model, other cardiovascular risk factors (age, sex, smoking, systolic blood pressure, and low-density lipoprotein cholesterol) were adjusted for. When sexes were considered separately, the association was significant only among males (P < 0.05), and the mean (SD) IMT values in the lowest IGF-I quartile according to ghrelin (I–IV) quartiles in men are as follows: I (the lowest ghrelin quartile) 0.84 mm (0.09) (n=9); II: 0.83 mm (0.10); III: 0.86 mm (0.13); and IV: 0.93 mm (0.19).
Figure 5. Mean intima-media thickness (IMT) (logarithmically transformed) of carotid arteries in relation to ghrelin and insulin-like growth factor I (IGF-I) quartiles. Mean IGF-I levels (ng/mL) in IGF-I quartiles (95% confidence intervals) are: I: 29.2 (27.1–31.3); II: 60.7 (58.6–62.9); III: 89.3 (87.1–91.5); IV: 139.4 (137.3–141.6). Standard deviations for mean IMT levels varied from 0.05 to 0.75.
When the IGF-I quartiles were considered, the negative correlation between ghrelin and IGF-I we have reported earlier Citation13 was significantly (r=0.142; P < 0.03) observed only in the lowest IGF-I quartile.
Discussion
These results indicate that the high leptin and low ghrelin signals may synergize with each other to increase the clustering of metabolic abnormalities and eventually type 2 diabetes. Leptin and ghrelin have interaction effects on physiological control of feeding by regulating reciprocally neuropeptide Y neurons Citation23. The interplay between these two peptides might occur also peripherally and in organs evidenced to be critical for the insulin and glucose metabolism. In the pancreas leptin is able to suppress the secretion of insulin Citation24. In the presence of leptin deficiency or resistance, there is a failure of leptin to inhibit glucose-stimulated insulin secretion, which could lead to hyperinsulinaemia and insulin resistance Citation25. Leptin may also have effects on insulin action Citation26. Ghrelin and its receptor are widely expressed including pancreatic beta-cells Citation27 supporting the notion that it could have direct effects on insulin secretion, and paracrine function of locally produced ghrelin in the pancreas has been suggested Citation28. Low ghrelin is also independently associated with fasting insulin concentrations and insulin resistance Citation11. Recently, ghrelin was reported to affect the insulin signalling system Citation29 implicating peripheral actions of ghrelin in glucose homeostasis. In hepatoma cells ghrelin has an anti-insulin action and upregulates gluconeogenesis Citation29. Ghrelin may therefore influence glucose and insulin metabolism through its effects on adiposity, through paracrine effects on insulin secretion or insulin signalling pathways.
Our data confirm that in patients with the MS low plasma ghrelin levels act as a physiological counterpart to high leptin and that these changes are linked to the insulin resistance observed in our patients. The latter notion was supported by the observed association of low ghrelin with insulin resistance only among the subjects with the highest leptin levels, i.e. in subjects who probably have the highest level of leptin resistance. A large proportion of the subjects with the MS develop type 2 diabetes in later stages of their life. In this study low ghrelin was a statistically significant independent predictor of type 2 diabetes only among the subjects belonging to the highest leptin quartile. Thus, leptin seems to be the major determinant of ghrelin effects on progression of metabolic syndrome. We recognize that diabetic subjects in this study were a small subgroup, and strong conclusions cannot be made based on this material. Undoubtedly the development of MS and type 2 diabetes involves multiple and interactive effects of genetic, hormonal, and environmental factors where interaction between high leptin and low ghrelin seems to play a key role.
We have recently reported that subclinical atherosclerosis measured as IMT of carotid arteries is positively associated with plasma ghrelin levels Citation16. In the present study we suggest the ghrelin-leptin relation to be a stronger marker of early atherosclerosis than ghrelin alone. The present study also showed plasma ghrelin concentrations to be positively associated with the degree of subclinical atherosclerosis measured as IMT of carotid arteries in the subjects with the lowest IGF-I levels. It is interesting to see that the association was observed among male subjects who also have lower leptin levels than females. These findings remained statistically significant after adjustments for the major commonly recognized risk factors for atherosclerosis, such as age, sex, systolic blood pressure, LDL cholesterol, and smoking. One potential explanation for this association might be found from the strong inverse relation of ghrelin to IGF-I and leptin. In the lowest IGF-I quartile the inverse association between IGF-I and ghrelin was the highest. High plasma ghrelin seems therefore to be associated positively with atherosclerosis among subjects in whom the feedback effect of IGF-I on ghrelin concentrations is the strongest.
One can speculate that the increase in the amount of early atherosclerosis is seen among the subjects who are jointly exposed to the potentially deleterious effects of low IGF-I and high ghrelin. In some studies low IGF-I levels have been associated with an increased incidence of coronary heart disease Citation14, Citation15. In addition, free but not total serum IGF-I was related inversely to atherosclerosis in a recent study Citation30. However, Ruotolo et al. suggested IGF-I levels to correlate positively with coronary artery disease progression Citation31. IGF-I is able to stimulate vascular smooth muscle cell proliferation and migration in vitro Citation32–34 and suppress their apoptosis Citation34. IGF-I has also effects on endothelial cells and monocyte activation Citation35. We have earlier explored the effects of IGF-I and ghrelin on early atherosclerosis and reported IGF-I levels to be strongly and positively associated with IMT in women but not in men Citation17. A similar positive association between ghrelin and carotid artery atherosclerosis was seen in men Citation16. Several earlier studies have provided evidence of beneficial Citation36–44 effects, with some deleterious Citation45 effects, of ghrelin in the cardiovascular system. Growth hormone secretagogue receptor density has been shown to be upregulated in both atherosclerotic carotid arteries and saphenous vein grafts Citation46, which has been interpreted to reflect the beneficial role of ghrelin in atherosclerosis. It is difficult to know whether ghrelin is a marker for the disease or if it plays an active role, or both. Ghrelin might have different effects on atherogenesis, depending on other risk factors, the modifying effect of other growth factors, and hormones. IGF-I and leptin seem to be among such modifying factors. The cross-sectional nature of the study does not allow us to say whether changes in ghrelin and leptin levels are causes or consequences of the disorders.
In summary, novel interactions between leptin and ghrelin influencing insulin resistance and associated co-morbidities, and between IGF-I and ghrelin affecting atherosclerosis, were observed. The joint occurrence of low ghrelin and high leptin seems to be associated with the cluster of metabolic complications, while the higher ghrelin-leptin relation to the higher amount of early atherosclerosis. The combined status of the highest ghrelin and the lowest IGF-I quartiles was associated with the greatest extent of early atherosclerosis.
Acknowledgements
This work was supported by The Research Council for Health of the Academy of Finland and The Finnish Foundation for Cardiovascular Research. The technical assistance of Ms. Saija Kortetjärvi, Ms. Liisa Mannermaa, and Ms. Leena Ukkola is greatly appreciated.
References
- Nakazato M, Murakami N, Date Y, Kojima M, Matsuo H, Kangawa K, et al. A role for ghrelin in the central regulation of feeding. Nature. 2001; 409: 194–8
- Shintani M, Ogawa Y, Ebihara K, Aizawa-Abe M, Miyanaga F, Takaya K, et al. Ghrelin, an endogenous growth hormone secretagogue, is a novel orexigenic peptide that antagonizes leptin action through the activation of hypothalamic neuropeptide Y/Y1 receptor pathway. Diabetes. 2001; 50: 227–32
- Tschöp M, Viswanath D, Weyer C, Tataranni PA, Ravussin E, Heiman ML. Circulating ghrelin levels are decreased in human obesity. Diabetes. 2001; 50: 707–9
- Leyva F, Godsland IF, Ghatei M, Proudler AJ, Aldis S, Walton C, et al. Hyperleptinemia as a component of a metabolic syndrome of cardiovascular risk. Arterioscler Thromb Vasc Biol. 1998; 18: 928–33
- Gabriely I, Ma XH, Yang XM, Rossetti L, Barzilai N. Leptin resistance during aging is independent of fat mass. Diabetes. 2002; 51: 1016–21
- Valle M, Gascon F, Martos R, Bermudo F, Ceballos P, Suanes A. Relationship between high plasma leptin concentrations and metabolic syndrome in obese pre-pubertal children. Int J Obes Relat Metab Disord. 2003; 27: 13–8
- Franks PW, Brage S, Luan J, Ekelund U, Rahman M, Farooqi IS, et al. Leptin predicts a worsening of the features of the metabolic syndrome independently of obesity. Obes Res. 2005; 13: 1476–84
- Langenberg C, Bergstrom J, Laughlin GA, Barrett-Connor E. Ghrelin and the metabolic syndrome in older adults. J Clin Endocrinol Metab. 2005; 90: 6448–53
- Ukkola O, Pöykkö SM, Kesäniemi YA. Low plasma ghrelin concentration is an indicator of the metabolic syndrome. Ann Med. 2006; 38: 274–9
- Wannamethee SG, Lowe GD, Rumley A, Cherry L, Whincup PH, Sattar N. Adipokines and risk of type 2 diabetes in older men. Diabetes Care. 2007; 30: 1200–5
- Pöykkö SM, Kellokoski E, Hörkkö S, Kauma H, Kesäniemi YA, Ukkola O. Low plasma ghrelin is associated with insulin resistance, hypertension, and the prevalence of type 2 diabetes. Diabetes. 2003; 52: 2546–53
- Kojima M, Hosoda H, Date Y, Nakazato M, Matsuo H, Kangawa K. Ghrelin is a growth-hormone-releasing acylated peptide from stomach. Nature. 1999; 402: 656–60
- Pöykkö SM, Ukkola O, Kauma H, Kellokoski E, Hörkkö S, Kesäniemi YA. The negative association between plasma ghrelin and IGF-I is modified by obesity, insulin resistance and type 2 diabetes. Diabetologia. 2005; 48: 309–16
- Juul A, Scheike T, Davidsen M, Gyllenborg J, Jorgensen T. Low serum insulin-like growth factor I is associated with increased risk of ischemic heart disease: a population-based case-control study. Circulation. 2002; 106: 939–44
- Laughlin GA, Barrett-Connor E, Criqui MH, Kritz-Silverstein D. The prospective association of serum insulin-like growth factor I (IGF-I) and IGF-binding protein-1 levels with all cause and cardiovascular disease mortality in older adults: the Rancho Bernardo Study. J Clin Endocrinol Metab. 2004; 89: 114–10
- Pöykkö SM, Kellokoski E, Ukkola O, Kauma H, Päivänsalo M, Kesäniemi YA, et al. Plasma ghrelin concentrations are positively associated with carotid artery atherosclerosis in males. J Intern Med. 2006; 260: 43–52
- Hietaniemi M, Pöykkö SM, Ukkola O, Päivänsalo M, Kesäniemi YA. IGF-I concentrations are positively associated with carotid artery atherosclerosis in women. Ann Med. 2005; 37: 373–82
- Rantala AO, Kauma H, Lilja M, Savolainen MJ, Reunanen A, Kesäniemi YA. Prevalence of the metabolic syndrome in drug-treated hypertensive patients and control subjects. J Intern Med. 1999; 245: 163–74
- Alberti KG, Zimmet PZ. Definition, diagnosis and classification of diabetes mellitus and its complications. Part 1: diagnosis and classification of diabetes mellitus provisional report of a WHO consultation. Diabet Med. 1998; 15: 539–53
- Cummings DE, Purnell JQ, Frayo RS, Schmidova K, Wisse BE, Weigle DS. A preprandial rise in plasma ghrelin levels suggests a role in meal initiation in humans. Diabetes. 2001; 50: 1714–9
- Alberti KG, Zimmet P, Shaw J. IDF Epidemiology Task Force Consensus Group. The metabolic syndrome—a new worldwide definition. Lancet. 2005; 366: 1059–62
- Katz A, Nambi SS, Mather K, Baron AD, Follmann DA, Sullivan G, et al. Quantitative insulin sensitivity check index: a simple, accurate method for assessing insulin sensitivity in humans. J Clin Endocrinol Metab. 2000; 85: 2402–10
- Kohno D, Gao HZ, Muroya S, Kikuyama S, Yada T. Ghrelin directly interacts with neuropeptide-Y-containing neurons in the rat arcuate nucleus: Ca2+ signaling via protein kinase A and N-type channel-dependent mechanisms and cross-talk with leptin and orexin. Diabetes. 2003; 52: 948–56
- Emilsson V, Liu YL, Cawthorne MA, Morton NM, Davenport M. Expression of the functional leptin receptor mRNA in pancreatic islets and direct inhibitory action of leptin on insulin secretion. Diabetes. 1997; 46: 313–6
- Van Gaal LF, Wauters MA, Mertens IL, Considine RV, De Leeuw IH. Clinical endocrinology of human leptin. Int J Obes Relat Metab Disord. 23 Suppl 1999; 1: 29–36
- Wauters M, Considine RV, Van Gaal LF. Human leptin: from an adipocyte hormone to an endocrine mediator. Eur J Endocrinol. 2000; 143: 293–311
- Wierup N, Svensson H, Mulder H, Sundler F. The ghrelin cell: a novel developmentally regulated islet cell in the human pancreas. Regul Pept. 2002; 107: 63–9
- Prado CL, Pugh-Bernard AE, Elghazi L, Sosa-Pineda B, Sussel L. Ghrelin cells replace insulin-producing beta cells in two mouse models of pancreas development. Proc Natl Acad Sci U S A. 2004; 101: 2924–9
- Murata M, Okimura Y, Iida K, Matsumoto M, Sowa H, Kaji H, et al. Ghrelin modulates the downstream molecules of insulin signaling in hepatoma cells. J Biol Chem. 2002; 277: 5667–74
- Boquist S, Ruotolo G, Skoglund-Andersson C, Tang R, Bjorkegren J, Bond MG, et al. Correlation of serum IGF-I and IGFBP-1 and -3 to cardiovascular risk indicators and early carotid atherosclerosis in healthy middle-aged men. Clin Endocrinol (Oxf). 2007; 10:68: 51–8
- Ruotolo G, Bavenholm P, Brismar K, Efendic S, Ericsson CG, de Faire U, et al. Serum insulin-like growth factor-I level is independently associated with coronary artery disease progression in young male survivors of myocardial infarction: beneficial effects of bezafibrate treatment. J Am Coll Cardiol. 2000; 35: 647–54
- Gonzalez B, Lamas S, Melian EM. Cooperation between low density lipoproteins and IGF-I in the promotion of mitogenesis in vascular smooth muscle cells. Endocrinology. 2001; 142: 4852–60
- Yamamoto M, Yamamoto K. Growth regulation in primary culture of rabbit arterial smooth muscle cells by platelet-derived growth factor, insulin-like growth factor-I, and epidermal growth factor. Exp Cell Res. 1994; 212: 62–8
- Delafontaine P, Lou H. Angiotensin II regulates insulin-like growth factor I gene expression in vascular smooth muscle cells. J Biol Chem. 1993; 268: 16866–70
- Bayes-Genis A, Conover CA, Schwartz RS. The insulin-like growth factor axis: A review of atherosclerosis and restenosis. Circ Res. 2000; 86: 125–30
- Nagaya N, Kojima M, Uematsu M, Yamagishi M, Hosoda H, Oya H, et al. Hemodynamic and hormonal effects of human ghrelin in healthy volunteers. Am J Physiol Regul Integr Comp Physiol. 2001; 280: R1483–7
- Enomoto M, Nagaya N, Uematsu M, Okumura H, Nakagawa E, Ono F, et al. Cardiovascular and hormonal effects of subcutaneous administration of ghrelin, a novel growth hormone-releasing peptide, in healthy humans. Clin Sci (Lond) 2003; 105: 431–5
- Soeki T, Kishimoto I, Schwenke DO, Tokudome T, Horio T, Yoshida M, et al. Ghrelin suppresses cardiac sympathetic activity and prevents early left ventricular remodeling in rats with myocardial infarction. Am J Physiol Heart Circ Physiol. 2008; 294: H426–32
- Li L, Zhang LK, Pang YZ, Pan CS, Qi YF, Chen L, et al. Cardioprotective effects of ghrelin and des-octanoyl ghrelin on myocardial injury induced by isoproterenol in rats. Acta Pharmacol Sin. 2006; 27: 527–35
- Isgaard J, Johansson I. Ghrelin and GHS on cardiovascular applications/functions. J Endocrinol Invest. 2005; 28: 838–42
- Cao JM, Ong H, Chen C. Effects of ghrelin and synthetic GH secretagogues on the cardiovascular system. Trends Endocrinol Metab. 2006; 17: 13–8
- Xu XB, Pang JJ, Cao JM, Ni C, Xu RK, Peng XZ, et al. GH-releasing peptides improve cardiac dysfunction and cachexia and suppress stress-related hormones and cardiomyocyte apoptosis in rats with heart failure. Am J Physiol Heart Circ Physiol. 2005; 289: H1643–51
- Chang L, Ren Y, Liu X, Li WG, Yang J, Geng B, et al. Protective effects of ghrelin on ischemia/reperfusion injury in the isolated rat heart. J Cardiovasc Pharmacol. 2004; 43: 165–70
- Frascarelli S, Ghelardoni S, Ronca-Testoni S, Zucchi R. Effect of ghrelin and synthetic growth hormone secretagogues in normal and ischemic rat heart. Basic Res Cardiol. 2003; 98: 401–5
- Pemberton CJ, Tokola H, Bagi Z, Koller A, Pontinen J, Ola A, et al. Ghrelin induces vasoconstriction in the rat coronary vasculature without altering cardiac peptide secretion. Am J Physiol Heart Circ Physiol. 2004; 287: H1522–9
- Katugampola SD, Pallikaros Z, Davenport AP. 125I-His(9)]-ghrelin, a novel radioligand for localizing GHS orphan receptors in human and rat tissue: up-regulation of receptors with athersclerosis. Br J Pharmacol. 2001; 134: 143–9
