
 ?Mathematical formulae have been encoded as MathML and are displayed in this HTML version using MathJax in order to improve their display. Uncheck the box to turn MathJax off. This feature requires Javascript. Click on a formula to zoom.
ABSTRACT
This paper presents a suite of simplified soil water and solute monitoring tools that give output as colours, which are thresholds for action. Data is presented as colour patterns, which highlight water and solute dynamics, such as under and over irrigation, nitrate leaching and salt accumulation. Colour is a universal language that connects the knowledge domains of scientists and farmers into a unified learning system. Evidence from the field shows that smallholder farmers using these monitoring tools can interpret the colour patterns, leading to increased yields, savings in water and a reduction in conflict on irrigation schemes.
Introduction
Global food production has increased almost three-fold over the last 50 years, while the area of cultivated land has increased by just 12%. Over 40% of the increase in food production has come from irrigated lands, demonstrating the growing importance of this sector. This is particularly so for low-income, food deficit countries, where 29% of cultivated land is irrigated, against a global average of 20% (Steduto et al., Citation2012). Although environmental and social problems flowing from irrigation development are well known, there is strong evidence for the overall benefits to low-income countries (Hussain & Hanjra, Citation2004; Lipton et al., Citation2003; Smith, Citation2004; Turral et al., Citation2010). Yet these same authors and others (Bjornlund et al., Citation2017; Molden et al., Citation2007) argue that the irrigation sector in low-income countries performs below expectations due to problems with water management, service delivery, accountability, market access and governance.
Annandale et al. (Citation2011) and Giordano et al. (Citation2019) trace the history of getting better water use efficiency and food security outcomes from irrigation. Early work focussed on performance of different irrigation methods and irrigation scheduling. While such approaches are useful at the field scale, they do not account for reuse of water and real water savings across larger hydrologic systems. Reliance on single factor metrics masks the biophysical and social complexity of achieving sustained development outcomes. Hence the focus shifted to a water accounting approach that calculates how much water was available, where and how it is used, and for what purpose. The water accounting framework is cross sectoral and cross scale, thus avoiding problems of more traditional field and farm scale efficiency metrics.
While essential for planning and management, a water accounting framework does not guarantee irrigation investments will benefit those farmers most in need. Lipton et al. (Citation2003) call for a ‘pro poor’ approach to irrigation development. Whereas irrigation can improve the yields of smallholder farmers, create a demand for labour and lower food prices for the urban poor, it is also necessary to ensure that the benefits are not captured by the relatively rich. Smith (Citation2004) suggests that a metric should change from ‘more crop per drop’ to ‘more poverty reduction per drop’, as irrigation development can widen inequalities. Molden (Citation2020) reflects on the complexity of water management with its cross sectoral interests (environment, energy, food) and different effects on rich and poor, men and women, powerful and marginalized. Although the world needs more investment in water, he calls for investment in the human capacity to manage water, with a particular focus on the poor.
A profitable and equitable irrigation sector that is pro poor remains elusive. We need more information about water availability and how it is used, but we lack the tools, human capacity and governance structure to both generate and act on this information. Stirzaker et al. (Citation2017) introduced a soil water and solute monitoring system which was designed specifically to fit the smallholder sector. This paper describes the evolution of the tools and data systems that form the Virtual Irrigation Academy (VIA), a monitoring, learning and governance system for smallholder irrigators. The VIA tools use colours to display levels of water, salt and nitrate in the soil and these colours have meaning and represent thresholds for action. This paper describes the development and use of the monitoring tools in four sections. The first section introduces the concept of requisite simplicity, a design philosophy that focuses on the requirements of the users. The second section describes how each of the monitoring tools works. The third section provides an overview of how to interpret the colours from the tools and the fourth section gives examples of the benefits obtained by smallholder farmers in low-income countries.
Requisite simplicity
The concept of requisite simplicity (Holling, Citation2001) provides a way of linking the complexity of a system with the constraints of those faced with making management decisions, in this case around irrigation. explores the relationship between the cost of implementing a new irrigation technology and the benefit to the irrigator. For an irrigator to benefit (increase yield per unit of water), they must engage with some of the ‘detail’ around soil water dynamics. For example, an irrigator may choose to dig a hole and observe ‘soil wetness’ before making a decision, and so move to position 1. They have engaged some of the detail and derived some benefit. Next, they instal soil water sensors, engage more detail and derive more benefit as they move towards position 2.
Figure 1. The relationship between detail and utility for the irrigator.
Up to position 2, there is a positive correlation between expending more effort or expense (i.e., engaging more detail) and deriving more benefit. It seems reasonable that continuing along this trajectory will bring even more benefit. The irrigator now instals multiple sensors at different locations and depths providing hourly data. From a management perspective, more data from more places more often should improve decision making. This might be true if the irrigator could distil and respond to all the new information. But irrigated fields are variable, water may not be available on demand, and farmers have competing priorities. In many cases the irrigator has engaged more of the detail but has derived less benefit and is on the trajectory from point 2 to 3.
Point 2 is the place to re-frame the problem. Re-framing involves simplification or stripping away the detail that is not required i.e., the journey from point 2 to point 4. However, care must be taken to ensure that simplification does not lead to a simplistic response, which in turn leads to error. A requisite simplicity finds the middle ground, allows us to act, generate new understandings and provides a means for structured learning (Stirzaker, Biggs, et al., Citation2010).
The monitoring tools described below were developed by engaging smallholder irrigators in process of user-led design over many years. The aim was to develop tools that gave information that was cost effective and to provide it in a way that the decision maker could understand. This ‘re-framing’ of the irrigation question is described in the next section, where each of the four monitoring tools is evaluated from a simplistic and detailed perspective to distil the requisite simplicity. Each tool is described under four subheadings as follows:
Description: what the tool measures,
Simplistic interpretation: too little detail that may to lead to error,
Detailed interpretation: information useful for scientists, not necessarily for managers,
Requisite simplicity: information needed by managers to take action and continue learning.
Soil water and solute monitoring tools
Chameleon soil water sensor
Description
The Chameleon sensor gives a measurement of soil suction across a range similar to a tensiometer. A suction reading relates to the stress experienced by a plant, so unlike a water content reading, the interpretation is independent of soil type. The physical measurement is the electrical resistance of a porous sensing material packed between two electrodes. The sensing material has a seven-fold change in volumetric water content across the 10–60 kPa range, which is where most irrigated crops would experience water stress. Since the suction of the porous material inside the sensor equilibrates with the soil, a small change in water content in the soil causes a large change in water content inside the sensor, and hence a large change in resistance. In this way the sensing material acts as a signal amplifier.
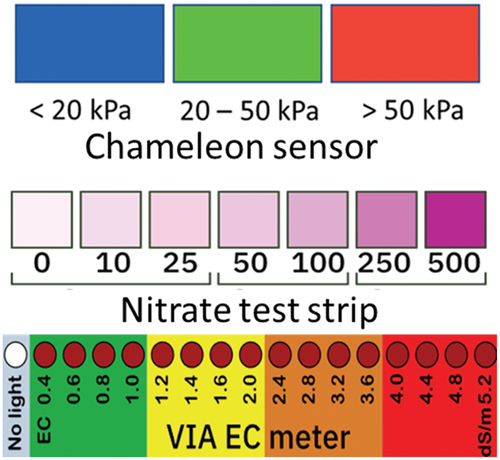
The electrical resistance of the sensor is calibrated against tensiometers to give a reading in suction units (kPa). There is broad consensus that most commonly irrigated crops start to experience water stress in the 20 kPa to 50 kPa zone and the Chameleon sensor gives a green light in this range. When the soil is wetter than approximately 20 kPa the Chameleon reads blue and when drier than approximately 50 kPa the Chameleon reads red.
The porous material inside the Chameleon is encased in gypsum, to buffer against changing salinity in the soil. The familiar ‘Gypsum block’ is composed entirely of gypsum, both as the porous sensing material and the buffer. Since the pores within the gypsum are very small, they lose little water in the 10 kPa to 50 kPa range. With little sensitivity in this wet range, the gypsum block is not useful for most irrigated crops.
Simplistic interpretation
Irrigated plants need to be kept wet, so keep the Chameleon in the blue zone. Red is too dry.
Detail
A Chameleon sensor array consists of three soil water sensors plus a temperature sensor with a unique identifier (ID). The three water sensors are placed in the top, middle and bottom of the rootzone, and the temperature ID sensor placed with the middle sensor. All resistance readings are corrected by this temperature measurement. The array is connected to a portable reader with three LEDs, each of which can turn blue (B), green (G) or red (R). The reader stores the data against the unique ID and transmits through a mobile phone or Wi-Fi access point to the Virtual Irrigation Academy (VIA) website at www.via.farm.
There is no universal suction at which plants experience stress because transpiration is a dynamic process involving a series of resistances in the soil and plant (Passioura, Citation1988). Nevertheless, a large number of studies collated by Shock and Wang (Citation2011) and Christen et al. (Citation2006) show that irrigated vegetable crops should be irrigated in the 20 kPa to 50 kPa zone, which largely corresponds to the green colour on a Chameleon reader. In hot weather, shallow rooted crops or those at a sensitive growth stage may require water before 20 kPa, particularly in warmer weather and lighter soils. We selected 50 kPa as the start of the red zone. Water stress rises quickly after this point, since the relationship between soil suction and water content is highly non-linear.
There are 27 combinations of blue, green and red over three depths. Blue or red at all depths may not be desirable, but the remaining 25 combinations describe the dynamics of the wetting and drying cycle over the depth of rootzone. How an irrigator responds to the colours would depend on the type of crop and sensitivity of the growth stage coupled with the severity of the weather, crop rooting depth, availability of water, their tolerance to risk and other personal factors. Although it is our aim to provide an inexpensive sensor with blue as 0–20 kPa (wet), green as 20–50 kPa (moist) and red >50 kPa (dry), it is not possible to make every sensor change colour at exactly those suction values. However, absolute accuracy is not necessary for routine decision making, as the variability between two sensors is typically much less than the natural variability in the soil over short distances.
Requisite simplicity
By watching how the colour patterns change with depth after irrigation and during the subsequent drying cycle, the farmer can learn the dynamics of their own unique combination of soil, crop and irrigation method. Their response to this information will depend on their past and developing experiential knowledge, modified by the constraints under which they must operate.
Wetting Front Detector (WFD)
Description
A Wetting Front Detector (WFD) is a 300 mm deep funnel with a 200 mm diameter opening, tapering to 30 mm at the base. A hollow tube, called a float housing, runs up from the base through the centre of the funnel. The float housing has two holes 70 mm from the base covered by 100 µm stainless steel mesh. The narrow base of the funnel is filled to a depth of 150 mm with a fine sand that covers the mesh. The rest of the funnel is filled with soil. The funnel is then buried in the rootzone, with the float housing protruding above the surface. Inside the float housing are rods of Styrofoam and on the top is a magnetically latched indicator, which is activated when the floats have risen by 30 mm.
As infiltrating water moves down through the funnel, the cross-sectional area decreases 20-fold, causing the soil water content to increase and eventually causing saturation in the filter sand. Liquid water then moves through the mesh filter into a reservoir at the base of the float housing. This causes the float to rise and the indicator to latch on the magnet in the up position. After the front dissipates, excess water is withdrawn from the funnel by capillary action, but a 5–7 ml sample is retained inside the reservoir. This sample can be removed later using a syringe through a 4 mm flexible tube that connects to the reservoir.
Simplistic interpretation
When the float of the WFD is in the up position, the water has infiltrated to the depth of placement. The captured water sample represents the solute concentration at that depth.
Detail
A wetting front is a narrow zone demarcating the infiltrating water above from the originally drier soil below. For each soil type, the depth that infiltrating water moves into the soil depends on the initial soil water content and the amount of irrigation water applied. For a given amount of water, a wetting front will penetrate deeper into wet soil than dry soil. To know how deep a wetting front has penetrated, we must define the suction above which we can detect a front using the funnel apparatus to elevate water content to saturation. Experimental evidence shows that a WFD will collect water in most soils when the suction is <3 kPa (Stirzaker, Citation2006). This means that if a front is moving at 5 kPa, water will enter the funnel, and the filter sand at its base will get wetter, but it will not reach saturation and the float will not be activated. Some water will move into soil layers below the depth at which the WFD is buried, with no response from the WFD.
The solute composition of water captured by the WFD is not the same as that in the surrounding soil. Water moves preferentially in larger pores, and thus the solute concentration carried into the funnel will tend to be lower than the average concentration in the soil water (Van der Laan et al., Citation2010). This has different implications for nitrate and sodium chloride, the two most important solutes that must be managed for successful irrigation. Studies on nitrate leaching use the term bypass flow, which means that infiltrating water tends to move downwards through larger pores without fully mixing with the water that is already there. The greater the bypass flow, the lower the loss of nitrate that would be expected on full mixing of new and resident water. Salt leaching studies refer to leaching efficiencies, meaning that the removal of salt from the rootzone is less than what we would expect from full mixing of irrigation and resident soil water.
The WFD was originally developed as a tool for scheduling irrigation (Stirzaker, Citation2003; Stirzaker, Stevens, et al., Citation2010). They are installed in pairs, with the shallow WFD positioned about one third down the active rootzone and the deeper WFD two thirds down the active rootzone. This gives three possible outcomes depending on whether neither, one or both indicators are activated. Wetting fronts weaken with depth as they move down the rootzone and so become progressively harder to detect. For that reason, WFDs are not placed deeper than 400 mm for sprinkler irrigation or 600 mm for flood and drip irrigation. The issue of weak fronts (i.e., drier than 3 kPa suction) passing WFDs undetected posed practical problems, as it meant that each combination of soil type, irrigation method and irrigation frequency requires different placement depths. Over time, the WFD became more used as a solute monitoring tool. Since solutes do not need to be measured after each irrigation event, useful information is obtained even if there are few activations of the WFD.
Requisite simplicity
The concentration of solute measured from the WFD is a measure of the nitrate and/or salt that is leaving the soil layer above and moving into the soil layer below during significant leaching events.
Nitrate test strip
Description
Nitrate test strips consist of a small patch of absorbent paper fixed to a plastic strip. When dipped into a soil water sample, a pink to purple colour develops over 60 seconds with the intensity related to concentration. This concentration is matched against a colour chart. Most packs of nitrate test strips read in seven ranges of 0, 10, 25, 50, 100, 250 and 500 mg/L and measure nitrite as well as nitrate. WFDs automatically collect and store a soil solution sample. This allows regular measurements of nitrate-nitrogen that is moving in the upper and lower parts of the rootzone. Although most people can distinguish between the seven colours on the chart, this level of resolution is not normally required for decisions around fertilizer management. The VIA visualization pattern groups the readings into Low, Medium and High ().
Figure 2. The VIA colour thresholds for water (Chameleon sensor), nitrate (nitrate test strip) and salt (VIA EC meter).
Simplistic interpretation
Plant growth responds positively to nitrogen fertilizer, so a high level of nitrogen in the soil is always good.
Detail
Most soil nitrogen is held in the organic fraction, and agricultural soils can contain 1000–6000 kg nitrogen/ha within the rootzone in a form not available to plants (Peverill et al., Citation1999). This nitrogen is mineralized to ammonium by soil microorganisms, and then to nitrite and finally nitrate. Plants absorb most of their nitrogen in the form of ammonium or nitrate. For example, a store of 3000 kg organic nitrogen/ha may mineralize at 3% per year providing 90 kg of nitrogen available to plants. Most of this is in the nitrate form which, being negatively charged, is highly vulnerable to leaching.
The total demand for nitrogen by a crop is generally known but matching the timing of supply and demand is difficult. Nitrate levels in soils are often high at the start of the season due to mineralization of organic matter coupled with applications of fertilizer or manure at a time when plant demand is low. Since irrigated soils are often wet, the nitrate is vulnerable to leaching. As the season progresses, the demand from the plant increases, and we expect to see less nitrate in the soil as it is incorporated into the plant tissue.
For the above reasons, setting a threshold for nitrate is difficult. Soil tests normally give results in mass of nutrient per kg of soil, which can then be converted to kg nutrient per ha by multiplying with soil depth and density. A conversion from a nitrate strip to kg nitrogen /ha can be estimated by assuming a volumetric water content when the WFD captures a water sample. relates the nitrate from test strips to kg nitrate-nitrogen/ha over the top 0.5 m of soil, assuming a soil water content of 30% and bulk density of 1400 kg/m3.
Table 1. Approximate relationship between nitrate concentration and amount of nitrate-nitrogen in the top 0.5 m.
Requisite simplicity
Nitrate levels rise due to mineralization and application of manures and fertilizers and fall due to plant uptake and leaching. When nitrate levels are high, irrigation amounts should be reduced to reduce the chance of leaching.
VIA EC meter
Description
The VIA EC meter measures electrical conductivity in the range 0.4–5.2 dS/m. It consists of 16 LEDs that are grouped into four colours as shown in and . Within each colour band there are four readings, and the LED closest to the sample value lights up. The resolution is 0.2 dS/m across most of the green and yellow bands and 0.4 dS/m across the orange and red. The VIA EC meter is adapted from a commercially available meter used for rapid assessment of nutrient levels in hydroponic solutions. This explains the range of 0.4–5.2 dS/m, as opposed to the general range of field EC meters of 0–19.9 dS/m. However, EC values greater than 4 dS/m indicate a saline soil and are detrimental to most crops. The VIA EC meter can measure samples as little as 3 ml, which is likely to be the minimum sample size extracted from a WFD.
Table 2. The Chameleon EC colours, range and meaning from soil water samples.
Simplistic interpretation
Salt is damaging to plants and should be kept low (green). A summary of simplistic and requisite simplicities for interpreting water, nitrate and salt data is shown in .
Table 3. A summary of a simplistic and requisite simplicity for each measurement device.
Detail
Irrigation is essentially a salt concentrating business, which is why leaching should be part of normal irrigation practice. All irrigation water contains some salt, generally dominated by NaCl, which the plant largely excludes at the root surface. For this reason, salt builds up in the rootzone. If this salt is not leached it will build up to levels that reduce crop yields. This is illustrated in a simple mass balance equation:
where: I = amount of irrigation applied in mm; [IW] = concentration of salt in the irrigation water in mg/L; D = amount of drainage in mm; [DW] = concentration of salt in the drainage water in mg/L.
Plants have varying tolerance to salt. Beans are salt sensitive and need to be kept in the green or yellow zone, whereas beets can easily tolerate the yellow and orange zone (Maas & Hoffman, Citation1977). Irrigation water should ideally be in the green zone. If water in the yellow or orange zone is used, salt levels can build up quickly. Most irrigators do not purposefully leach salt. Over-irrigation is so common that salt is leached as part of normal practice. The global problem of waterlogging and salinity of irrigated lands is testament to this.
Requisite simplicity
When irrigation is efficient, salt will accumulate in the rootzone and needs to be leached before reaching the salinity threshold for the crop. The ratio of salt in the irrigation water and salt in the rootzone gives an indication of the leaching fraction.
Interpreting colour patterns
Soil suction data from the Chameleon sensors and nitrate and salt data from the WFDs are visualized on the VIA platform. After the Chameleon sensor array is installed, the user connects the reader, records the unique ID of the array and takes a measurement. The user then claims this ID on the VIA platform, and records the sensor placement depths, crop name and planting date against this array. The soil water colour pattern is generated automatically as each subsequent reading is taken. Smallholder farmers tend to share a Chameleon reader and manually take readings once or twice a week, which are uploaded via mobile phone. Larger scale farmers tend to leave a Chameleon reader connected to a sensor array, in which case it logs every two hours.
If WFDs have been installed with the Chameleon sensor array, these are added on the VIA platform and the placement depths assigned. The nitrate and salt data need to be recorded manually. The user has a ‘date picker’ and then ticks the box that corresponds to the colour representing the range of nitrate and salt values (). In this way water, nitrate and salt data can be visualized together as a pattern.
Thousands of cropped fields have been monitored, each producing a unique colour pattern on the VIA platform. Each pattern is composed of different elements, including wetting and drying events, periods when the soil was too wet or too dry, and periods where solutes accumulated or were leached. These elements that make up a seasonal pattern are illustrated for water (), nitrate () and salt ().
Figure 3. Common elements that make up a three-sensor array water pattern. The timing of irrigation events is shown by the arrow.
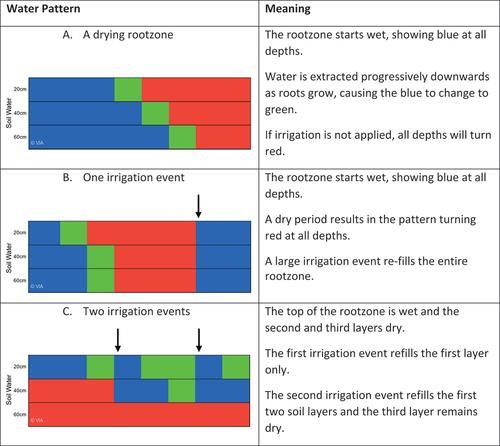
Figure 4. Common elements making up nitrate patterns and the accompanying water pattern. The timing of irrigation events is shown by the arrow.
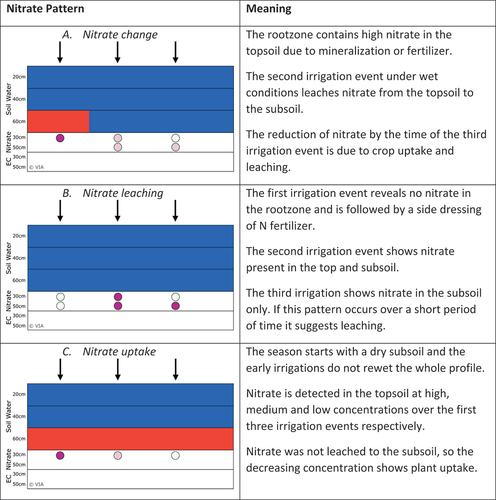
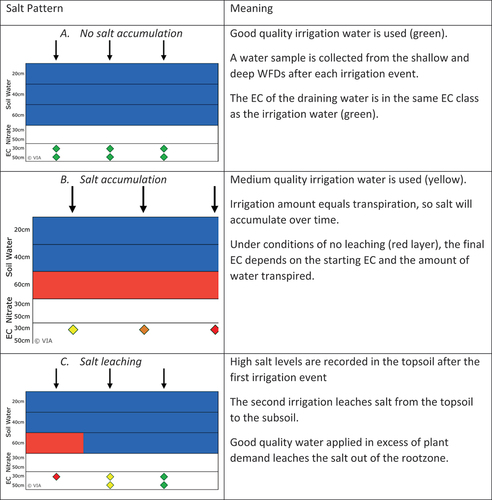
Figure 5. Common elements making up salt patterns and the accompanying water pattern. The timing of irrigation events is shown by the arrow.
Water pattern elements
The water pattern elements in illustrate drying and rewetting of a rootzone over time (x axis) for sensors placed at 20, 40 and 60 cm depths. As these patterns in are generic, the actual dates are not shown as the time it takes to dry a rootzone depends on the size of the crop, soil type and evaporative demand. A newly planted crop would take many weeks to extract all the water from a 0.6 m rootzone, whereas a mature crop in summer could extract all the water in a matter of days.
Pattern 3A shows a typical drying cycle, as roots progressively use water in the topsoil layer and then extract water from the second and third layers. The period in the ‘green zone’ is short, because not much water is held between 20–50 kPa. Pattern 3B shows a more rapid drying event so that the soil becomes dry at all depths for a period of time. When irrigation occurs, denoted by the arrow, the entire rootzone is rewetted. This example shows the irrigation interval is too long and when irrigation occurs, water reaches the deepest sensor and probably beyond. This may be desirable if water will not be available again for a week or two but may also be excessive and leach nitrate. This point is explored further in subsequent patterns. Pattern 3C represents an optimum scenario during the early stages of the crop. Water is withdrawn first from layer one and then from layers 1 and 2, and each irrigation event replaces the amount used. The subsoil remains dry throughout. The crop has sufficient water (blue and green), but there is no leaching beyond the rootzone.
Nitrate pattern elements
For the following scenarios, two WFDs are placed at 30 cm and 50 cm depths i.e., between the first and second and the second and third Chameleon sensors. For a WFD to collect a sample at 30 cm depth, the water must have infiltrated deeper, so the 40 cm Chameleon sensor would need to show blue. Similarly, the 60 cm Chameleon would need to show blue for the deepest WFD at 50 cm to collect a sample. Each pattern shows three irrigation events ().
Nitrate levels increase due to mineralization of organic matter, compost or manure and the application of nitrogen-based fertilizers and decrease in response to plant uptake and leaching. Pattern 4A shows nitrate moving down the rootzone with a reduction in the concentration. If the irrigation amounts were similar to crop requirements and the crop had a high demand for nitrogen, most of the reduction is likely due to uptake. Pattern 4B shows rapid movement of nitrate after a nitrogen fertilizer side-dressing. This pattern suggests leaching, particularly if there was excessive irrigation and the pattern occurs over a week or two. For pattern 4C, the deeper WFD does not collect a sample because the irrigation amounts match crop demand. Nitrate levels reduce over time, and in the absence of leaching, we can assume crop uptake.
Salt pattern elements
The Chameleon sensor and WFD placements are the same as the nitrate examples above. As for the nitrate patterns, the water pattern is largely blue, since these conditions are necessary for the WFD to collect a water sample. However, the time periods would be longer, as salt takes weeks to months to build up, whereas nitrate can be leached in a matter of days ().
Pattern 5A shows irrigation with good quality water, and that no salt accumulates in the rootzone. Given even good quality water contains some salt, the fact there is no build up shows that the salt is being leached. Pattern 5B illustrates the non-leaching scenario, where layer three remains dry. Medium quality irrigation water was used and the salt concentrates through transpiration and builds up to high levels. Pattern 5C shows high levels of salt in the topsoil progressively leached using good quality water.
The nine patterns illustrate the complex nature of irrigation. If a farmer waits too long to irrigate as in pattern 3B, the crop will be water stressed. If, when they irrigate, they apply too much water as in pattern 4B, they will leach out the fertilizer. But if they apply exactly the right amount of water over a long period of time without rainfall, the salt will accumulate, as in pattern 5B. Applying too little water will stress a crop and eventually accumulate salt. Applying too much water will leach nitrate and salt.
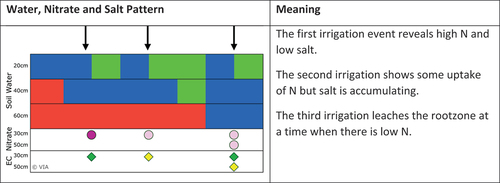
Water, nitrate and salt patterns are linked as shown in , which shows a rootzone with the top third wet and dry soil below. The first irrigation wets the soil to 40 cm and the WFD at 30 cm collects a water sample with high nitrate and low salt. The second irrigation shows lower nitrate, and since this was not a leaching event, we assume the crop is taking up nitrate. The third irrigation is a leaching event as the salt is moved down the profile. By this stage most of the nitrate has been used by the crop, so the leaching of nitrate is minimal.
Figure 6. A combined water, nitrate and salt pattern.
Adoption by farmers
The WFD was commercialized in 2004 and nearly 35,000 units have been distributed since then. It was originally marketed as an irrigation scheduling tool, but since the development of the Chameleon sensor ten years later, it has been primarily used for solute sampling. The uptake of the Chameleon sensor has been rapid since the first installation in a smallholder field in Tanzania in 2014, with more than 60,000 sensors being deployed in development projects or purchased by farmers. The two tools are complementary, providing information on irrigation depth, soil water status and the accumulation and leaching of salt and nitrate.
Chameleon sensors were first evaluated among small scale irrigators in southern Africa, who farmed in government or donor funded irrigation schemes. The schemes ranged from 20 ha to over 400 ha and farmer plots typically were in the range of 0.1 to 1 hectare. Farmers were provided with a Chameleon sensor array (three sensors at three depths) and a proportion of farmers also had WFDs, from which nitrate and EC measurements were made. Farmers were given basic training in the tools by project staff. They were told what the colours meant, but not what an optimum colour pattern might be. Farmers did not have to respond to the colours unless they had confidence in the tools and believed they would derive a benefit from doing so.
The data shown in were derived from 15 smallholder schemes in Tanzania and Malawi, involving 358 farmers monitoring 736 crops over a period of three years. A sample of farmers was surveyed covering 271 crops in Tanzania and 182 crops in Malawi. The most common crops in Tanzania included a range of vegetables, green maize and upland rice. The most common crops in Malawi included green and grain maize and dry beans.
Table 4. The changes in yield from survey data covering 15 irrigation schemes in Tanzania and Malawi.
Table 5. The number of Chameleon sensors and WFD readings taken and reductions in water use, fertilizer use and conflict.
Farmers were asked to estimate their yields, compared to what they harvested before the introduction of the tools (). One quarter of farmers in each country estimated that their yields had increased by more than 50%. However, one quarter of farmers in Tanzania and over a third in Malawi reported that their yields were the same or lower than before. Farmers obtaining lower yields were then asked for the major reason, which included; i) running out of water, ii) low use of inputs, iii) pests and diseases and iv) misleading information from the tools. Most farmers reported that low yields were due to running out of water. None of the 358 farmers reported misleading information from the soil water monitoring tools. Overall, farmers estimated that 70% and 63% of their crops had higher yields in Tanzania and Malawi respectively, which is remarkable given that the only intervention was the information from the tools. These farmers had to overcome all the usual problems that face small scale farmers, including inadequate supplies of water, low inputs, pests and diseases.
Each of the farmers had a Chameleon sensor array permanently installed in their field, but the portable readers which display the colours were generally held by an extension officer or a member of the project team. This meant that farmers could not always get a reading on demand. As the project developed, lead farmers were selected who could supervise readings for other farmers. Readings were generally taken once or twice per week, although Tanzania experimented with daily readings over certain periods to see if more data was useful to the farmers. WFD readings, which involved removing the water sample by syringe and measuring nitrate and EC, were always done by project team members or extension workers.
The majority of surveyed farmers reported that they used less water (). This was unexpected, as the general perception at most schemes was that water availability was a problem. Even more unexpected was that 86% of farmers in Tanzania claimed to have reduced their fertilizer rate. They reported applying less fertilizer more often, or fertilizer mixed with manure. The project team did not recommend that farmers should reduce water or fertilizer; these decisions were made and acted on by the farmers themselves. Yet these farmer decisions were consistent with the data assembled on the VIA platform. At many schemes, the blue colour predominated, particularly during the first part of the season. Similarly, many nitrate measurements were in the ‘high’ range, meaning that there may already be over 100 kg of nitrogen in soluble form in the upper rootzone. Farmers observed how rapidly nitrate test strips turned from purple to white, and how this coincided with wet soil at all depths, as measured by the Chameleon.
Discussion
The increase in yield combined with saving of water by smallholder irrigators in Africa after using Chameleon sensors and WFDs has been reported in Zimbabwe (Moyo et al., Citation2020), Mozambique (Chilundo et al., Citation2020), Tanzania (Mdemu et al., Citation2020; Stirzaker et al., Citation2017), Ethiopia (Mekonnen et al., Citation2022; Tiruye et al., Citation2022) and Malawi (Chikankheni, Citation2020). In many cases the benefits go well beyond the farmer on whose plot the equipment has been installed. Stirzaker et al. (Citation2017) reported how an irrigation scheme in Tanzania comprising almost 200 irrigators was transformed with just 20 farmers directly using the water and solute monitoring tools. Mekonnen et al. (Citation2022) reported that over 70% of farmers who received equipment in a large irrigation scheme in Ethiopia improved their water use. These farmers were encouraged to share their experience with farmers in a different part of the scheme without the tools, most of whom also improved their water use. Mdemu et al. (Citation2020) calculated that farmers using Chameleon sensors on a scheme in Tanzania reduced their water applications by 65% over three years. Their neighbours, who did not have equipment, reduced their irrigation by 47%. Similarly, Moyo et al. (Citation2020) reported that farmers in Zimbabwe without equipment learned from those who had it installed in their plots and obtained about two thirds of the benefits.
We expected that farmers would be motivated to increase yields, but the large reduction in water use observed at many schemes was surprising. Almost all the schemes were gravity fed and farmers paid a very low fee for their water allocation on an area basis, so there was little financial incentive to save water. Three reasons contributed to saving water. First, many schemes have scheduled days when irrigation water is made available. Irrigating on those days demonstrated a farmer’s commitment to the scheme and was part of their social cohesion. Farmers would need a good reason to break ranks from such norms, even when Chameleon sensors recorded blue at all depths. However, as farmers developed confidence in the tools, they were prepared to skip scheduled irrigation days altogether. This had the added advantage of saving time which could then be put to other tasks on the farm such as weeding (Moyo et al., Citation2020).
A second reason for saving water had to do with managing conflict on schemes. As shown in , conflict is common when farmers share infrastructure and need to wait their turn for water to be supplied to their plot. Conflict is often fuelled by a perceived scarcity of water, which starts to dissipate as farmers realize that the rootzone is wetter than they thought. Mdemu et al. (Citation2020) described the common situation of farmers on downstream plots frequently finding the canal empty. Over a three-year period, as irrigation opportunities were skipped, 83% of farmers reported less conflict between upstream and downstream users. Moyo et al. (Citation2020) reported that the greatest reductions in conflict occurred within the farming household itself. This may reflect stresses in deciding whether irrigation is needed or not, and the considerable time it takes to irrigate a farm, a job that usually falls to women.
The third reason for saving water was the realization that over irrigation leaches nutrients, which in turn reduces yield. It was surprising how quickly irrigators connected patterns that were consistently blue at all depths with nitrate measurement that dropped rapidly between successive readings. When farmers skipped scheduled irrigation days, they noticed two changes. First, ‘green’ started to replace blue on the Chameleon pattern, as the crops were allowed to dry the soil. Second, farmers observed that new growth tended to have a darker green colour, indicating greater uptake of nitrogen. Minimizing leaching is particularly important for smallholders for whom fertilizer is extremely expensive, and who cannot afford to supply nutrients to excess, as is common in high income countries (Stirzaker, Citation1999).
The appearance of green on the chameleon pattern gives important information. Gravity alone will not dry the soil to the suction represented by green, so the change from blue to green indicates that roots are actively extracting water at that layer. The first appearance of green at each depth is a good measure of the advancing rooting front. Knowing when roots are deeper in the soil allows the irrigator to let the topsoil dry a little, to reduce soil evaporation or leave room for rainfall. It also allows roots to pick up nitrate from deeper in the rootzone before it is leached. Knowing the depth of the rootzone, and the depth to which irrigation water infiltrates, is basic information without which irrigation cannot be managed efficiently.
Conclusion
A suite of tools was developed for monitoring water nitrate and salt with a focus on smallholder irrigators. The tools give output as colours and the colours represent thresholds for action. Data is visualized as colour patterns, which reveal the dynamics of water and solute change in the rootzone. Experience showed that irrigators can interpret basic patterns and take appropriate action. The most common experience was that farmers saw that their fields were wetter than they expected. For farmers with WFDs, the rapid change of the nitrate test strip from high to low nitrate also made a dramatic impact. Many farmers were able to connect these two observations i.e., too much water keeps the Chameleon blue and leaches the nitrate. Skipping scheduled irrigation days not only saved water but frequently resulted in increased yields, presumably due to less leaching. With more water left in the scheme canals, conflicts of water could be addressed. The learnings from a relatively small number of farmers monitoring quickly spread leading to scheme level changes.
Author contribution statement
Richard Stirzaker developed the concept of the VIA including the sensors and wrote the manuscript. Matthew Driver developed the electronics and data systems.
Ethics statement
This project has been approved by CSIRO’s Social Science Human Research Ethics Committee in accordance with the National Statement on Ethical Conduct in Human Research (2007) (ref 046/12 and 047/20). All farmers surveyed were voluntary participants in the project.
Acknowledgments
We thank our many partners and participating farmers for helping to create the Virtual Irrigation Academy.
Disclosure statement
No potential conflict of interest was reported by the author(s).
Additional information
Funding
References
- Annandale, J. G., Stirzaker, R. J., Singels, A., Van der Laan, M., & Laker, M. C. (2011). Irrigation scheduling research: South African experiences and future prospects. Water SA, 37(5), 751–764. https://doi.org/10.4314/wsa.v37i5.12
- Bjornlund, H., van Rooyen, A., & Stirzaker, R. (2017). Profitability and productivity barriers and opportunities in small-scale irrigation schemes. International Journal of Water Resources Development, 33(5), 690–704. https://doi.org/10.1080/07900627.2016.1263552
- Chikankheni, J. T. (2020) Benefit of using simple soil moisture monitoring tools in smallholder irrigation schemes in Malawi [ Master thesis, Australian National University].
- Chilundo, M., de Sousa, W., Christen, E. W., Faduco, J., Bjornlund, H., Cheveia, E., Munguambe, P., Jorge, F., Stirzaker, R., & Van Rooyen, A. F. (2020). Do agricultural innovation platforms and soil moisture and nutrient monitoring tools improve the production and livelihood of smallholder irrigators in Mozambique? International Journal of Water Resources Development, 36(sup1), S127–147. https://doi.org/10.1080/07900627.2020.1760799
- Christen, E., Ayars, J., Hornbuckle, J., & Hickey, M. (2006). Technology and practice for irrigation in vegetables. NSW Department of Primary Industries.
- Giordano, M., Scheierling, S. M., Tréguer, D. O., Turral, H., & McCornick, P. G. (2019). Moving beyond ‘more crop per drop’: Insights from two decades of research on agricultural water productivity. International Journal of Water Resources Development, 1–25. https://doi.org/10.1080/07900627.2019.1576508
- Holling, C. S. (2001). Understanding the complexity of economic, ecological, and social systems. Ecosystems, 4(5), 390–405. https://doi.org/10.1007/s10021-001-0101-5
- Hussain, I., & Hanjra, M. A. (2004). Irrigation and poverty alleviation: Review of the empirical evidence. Irrigation and Drainage, 53(1), 1–15. https://doi.org/10.1002/ird.114
- Lipton, M., Litchfield, J., & Faurès, J.-M. (2003). The effects of irrigation on poverty: A framework for analysis. Water Policy, 5, 413–427. https://doi.org/10.2166/wp.2003.0026
- Maas, E. V., & Hoffman, G. J. (1977). Crop salt tolerance—current assessment. Journal of the Irrigation and Drainage Division, 103(2), 115–134. https://doi.org/10.1061/JRCEA4.0001137
- Mdemu, M., Kissoly, L., Bjornlund, H., Kimaro, E., Christen, E. W., Van Rooyen, A., Stirzaker, R., & Ramshaw, P. (2020). The role of soil water monitoring tools and agricultural innovation platforms in improving food security and income of farmers in smallholder irrigation schemes in Tanzania. International Journal of Water Resources Development, 36(sup1), S148–170. https://doi.org/10.1080/07900627.2020.1765746
- Mekonnen, D. K., Yimam, S., Arega, T., Matheswaran, K., & Schmitter, P. M. (2022). Relatives, neighbors, or friends: Information exchanges among irrigators on new on-farm water management tools. Agricultural Systems, 203, 103492. https://doi.org/10.1016/j.agsy.2022.103492
- Molden, D. (2020). Scarcity of water or scarcity of management? International Journal of Water Resources Development, 36(2–3), 258–268. https://doi.org/10.1080/07900627.2019.1676204
- Molden, D., Burton, M., & Bos, M. G. (2007). Performance assessment, irrigation service delivery and poverty reduction: Benefits of improved system management. Irrigation and Drainage: The Journal of the International Commission on Irrigation and Drainage, 56(2–3), 307–320. https://doi.org/10.1002/ird.313
- Moyo, M., Van Rooyen, A., Bjornlund, H., Parry, K., Stirzaker, R., Dube, T., & Maya, M. (2020). The dynamics between irrigation frequency and soil nutrient management: Transitioning smallholder irrigation towards more profitable and sustainable systems in Zimbabwe. International Journal of Water Resources Development, 36(sup1), S102–S26. https://doi.org/10.1080/07900627.2020.1739513
- Passioura, J. B. (1988). Water transport in and to roots. Annual Review of Plant Physiology and Plant Molecular Biology, 39(1), 245–265. https://doi.org/10.1146/annurev.pp.39.060188.001333
- Peverill, K. I., Sparrow, L. A., & Reuter, D. J. (1999). Soil analysis: An interpretation manual. CSIRO Publishing.
- Shock, C. C., & Wang, F. X. (2011). Soil water tension, a powerful measurement for productivity and stewardship. HortScience, 46,178–185. https://doi.org/10.21273/HORTSCI.46.2.178
- Smith, L. E. D. (2004). Assessment of the contribution of irrigation to poverty reduction and sustainable livelihoods. International Journal of Water Resources Development, 20(2), 243–257. https://doi.org/10.1080/0790062042000206084
- Steduto, P., Faurès, J. M., Hoogeveen, J., Winpenny, J., & Burke, J. (2012). Coping with water scarcity: An action framework for agriculture and food security. Food and Agriculture Organization of the United Nations.
- Stirzaker, R. J. (1999). The problem of irrigated horticulture: Matching the biophysical efficiency with the economic efficiency. Agroforestry Systems, 45(1/3), 187–202. https://doi.org/10.1023/A:1006201807522
- Stirzaker, R. J. (2003). When to turn the water off: Scheduling micro-irrigation with a wetting front detector. Irrigation Science, 22(3–4), 177–185. https://doi.org/10.1007/s00271-003-0083-5
- Stirzaker, R. J. (2006) Factors affecting sensitivity of wetting front detectors. In V International Symposium on Irrigation of Horticultural Crops (pp. 647–653).
- Stirzaker, R. J., Biggs, H., Roux, D., & Cilliers, P. (2010). Requisite simplicities to help negotiate complex problems. Ambio, 39(8), 600–607. https://doi.org/10.1007/s13280-010-0075-7
- Stirzaker, R. J., Mbakwe, I., & Mziray, N. R. (2017). A soil water and solute learning system for small-scale irrigators in Africa. International Journal of Water Resources Development, 33(5), 788–803. https://doi.org/10.1080/07900627.2017.1320981
- Stirzaker, R. J., Stevens, J. B., Annandale, J. G., & Steyn, J. M. (2010). Stages in the adoption of a wetting front detector. Irrigation and Drainage, 59(4), 367–376. https://doi.org/10.1002/ird.472
- Tiruye, A. E., Asres Belay, S., Schmitter, P., Tegegne, D., Zimale, F. A., & Tilahun, S. A. (2022). Yield, water productivity and nutrient balances under different water management technologies of irrigated wheat in Ethiopia. PLoS Water, 1(12), e0000060. https://doi.org/10.1371/journal.pwat.0000060
- Turral, H., Svendsen, M., & Faures, J. M. (2010). Investing in irrigation: Reviewing the past and looking to the future. Agricultural Water Management, 97(4), 551–560. https://doi.org/10.1016/j.agwat.2009.07.012
- van der Laan, M., Stirzaker, R. J., Annandale, J. G., Bristow, K. L., & Du Preez, C. C. (2010). Monitoring and modelling draining and resident soil water nitrate concentrations to estimate leaching losses. Agricultural Water Management, 97(11), 1779–1786. https://doi.org/10.1016/j.agwat.2010.06.012