Abstract
Background. Several methods of randomization are available to create comparable intervention groups in a study. In the HOMERUS‐trial, we compared the minimization procedure with a stratified and a non‐stratified method of randomization in order to test which one is most appropriate for use in clinical hypertension trials. A second objective of this article was to describe the baseline characteristics of the HOMERUS‐trial. Methods. The HOMERUS population consisted of 459 mild‐to‐moderate hypertensive subjects (54% males) with a mean age of 55 years. These patients were prospectively randomized with the minimization method to either the office pressure (OP) group, where antihypertensive treatment was based on office blood pressure (BP) values, or to the self‐pressure (SP) group, where treatment was based on self‐measured BP values. Minimization was compared with two other randomization methods, which were performed post‐hoc: (i) non‐stratified randomization with four permuted blocks, and (ii) stratified randomization with four permuted blocks and 16 strata. In addition, several factors that could influence outcome were investigated for their effect on BP by 24‐h ambulatory blood pressure monitoring (ABPM). Results. Minimization and stratified randomization did not lead to significant differences in 24‐h ABPM values between the two treatment groups. Non‐stratified randomization resulted in a significant difference in 24‐h diastolic ABPM between the groups. Factors that caused significant differences in 24‐h ABPM values were: region, centre of patient recruitment, age, gender, microalbuminuria, left ventricular hypertrophy and obesity. Conclusion. Minimization and stratified randomization are appropriate methods for use in clinical trials. Many outcome factors should be taken into account for their potential influence on BP levels. Recommendation. Due to the large number of potential outcome factors that can influence BP levels, minimization should be the preferred method for use in clinical hypertension trials, as it has the potential to randomize more outcome factors than stratified randomization.
Introduction
The primary purpose of randomization in clinical trials is to create groups of patients that are similar with regard to baseline characteristics that have the potential to influence outcome. Otherwise differences in outcome at the end of a trial may be ascribed to prognostic features rather than the intervention. Therefore, randomization is essential for good clinical practice in order to achieve an optimal balance between groups.
Randomization can fail in two important ways. First, it can fail when an unequal number of patients is assigned to the treatment groups. Second, when the groups of patients are unbalanced for critical features that are known or suspected to affect prognosis, so‐called outcome factors. In this paper, we investigated which method of randomization is most appropriate in avoiding these potential failures. In order to attain this we compared three different methods of randomization: the procedure of minimization and two procedures that were performed post‐hoc – non‐stratified and stratified randomization Citation[1].
For this comparison, we used data from HOMERUS (Home vs Office MEasurements: Reduction of Unnecessary treatment Study), a randomized clinical trial that investigated whether self‐measurement of blood pressure (BP) at home is a reliable tool on which to base antihypertensive treatment Citation[2].
This paper serves two purposes: the primary aim is to describe three methods of randomization and the secondary purpose is to describe the baseline characteristics of the HOMERUS‐trial.
Patients and methods
The design of the HOMERUS‐trial has been described in detail elsewhere Citation[2]. In brief, HOMERUS is a multi‐centre, prospective, randomized, double‐blind trial with a parallel‐group design. Patients, aged 18 years and older whose office BP was above 139 mmHg systolic and/or 89 mmHg diastolic were randomly allocated to either the self‐pressure (SP) group or to the office pressure (OP) group. If randomized to the SP group, antihypertensive treatment was guided on the results of self‐blood pressure measurement (SBPM). In the OP group, treatment was titrated based on office blood pressure measurement (OBPM). At entry into the study, any existing antihypertensive therapy was discontinued whenever possible and patients entered a placebo run‐in period of 4 weeks duration before study treatment was initiated. If the treating physician considered interruption of treatment too hazardous, the patient was switched without run‐in period to the trial medication. Twenty‐four‐hour ambulatory blood pressure monitoring (ABPM), as a reference standard, and assessment of target organ damage (heart, kidney) took place at the end of the run‐in period and at the end of the trial.
Primary aim
Minimization
Randomization of patients was performed, according to the procedure of minimization Citation[1], by a blinded person at the coordinating centre using dedicated software. Once an eligible subject provided written informed consent, the coordinator entered the subject's characteristics into a computer program, which randomized the patient.
The six outcome factors used in the randomization process were: age (<40, 40–59 or ⩾60 years), gender, centre where the patient was treated (Maastricht, Nijmegen, Amsterdam, Groningen), clinical symptoms (yes or no), type of practice of recruiting centre (general practitioner or hospital practice) and whether the patients had a placebo run‐in period or not. Patients were considered to have clinical symptoms when they had a history of left ventricular hypertrophy (LVH), cardiovascular events, target organ damage of the kidney or retinopathy.
To prevent the possibility of predicting the next allocation with knowledge of characteristics from earlier patients, the probability of assignment to the treatment groups was set at 0.9 instead of 1. This means that there was a 10% chance that a patient was allocated to a treatment group different from what could be expected based on characteristics from earlier patients.
Post‐hoc randomization procedures
In order to ascertain the adequacy of the minimization procedure which was actually used in HOMERUS, this method was compared with two types of fixed post‐hoc randomization procedures: first, randomization with four permuted blocks without strata (non‐stratified randomization), and second, randomization with four permuted blocks and 16 strata (stratified randomization) Citation[1]. The four factors used for stratified randomization that resulted in 16 strata were: age (⩽50 or >50 years), gender, clinical symptoms (yes or no) and type of practice of recruiting centre (general practitioner or hospital practice).
Outcome factors
In order to test the influence of patient characteristics on BP levels we compared ABPM values between patients with and without some of the most common risk factors according to the European Society of Hypertension Citation[3]. Comparison was performed between patients with and without LVH, obesity (BMI>30 kg/m2), microalbuminuria, hypercholesterolaemia (total cholesterol>6.5 mmol/l), increased serum creatinine level (creatinine men 115–133, women 107–124 μmol/l) and diabetes mellitus (glucose>7.0 mm/l).
Secondary aim
Blood pressure measurement
At each visit, BP was measured three times in sitting position after 5 min of rest. The three measurements were averaged for analysis. ABPM was performed for 26 h. BP readings were obtained at 15‐min intervals from 07.00 to 23.00 h and at 30‐min intervals during the remainder of the 24‐h period. Readings from 09.00 to 21.00 h and from 01.00 to 06.00 h were used to calculate the average ABPM values. SBPMs were recorded during the week preceding the next visit. Recordings were performed for 7 consecutive days in the morning and in the evening with each session consisting of three readings in sitting position.
Laboratory analyses
Blood was drawn from fasting patients for determination of blood glucose, serum cholesterol (total and HDL‐cholesterol) and serum creatinine.
Two consecutive 24‐h urine collections were analysed for (micro)albuminuria. Microalbuminuria was defined as an albumin concentration between 30 and 300 mg/24 h and proteinuria as an albumin concentration of 300 mg/24 h or greater Citation[3].
Echocardiography
Two‐dimensionally guided echocardiograms of the left ventricle were taken at the cordal level with the patient in the partial left decubitus position. End‐diastolic left ventricular internal diameter, septal and posterior wall thickness, left ventricular total diameter were calculated from at least five consecutive heart cycles. Left ventricular mass was estimated according to Devereux & Reichek Citation[4] and indexed to body surface area. LVH is defined as left ventricular mass index (LVMI) exceeding 125 g/m2 in men and 110 g/m2 in women Citation[3]. All examinations were recorded on videotape and assessed by a blinded reader.
Data and statistical analysis
To reject the hypothesis of a systolic pressure difference larger than 5 mmHg and/or a diastolic pressure difference larger than 3 mmHg with a significance level of 5% (two‐sided) and a power of 80%, 292 randomized patients were needed (standard deviations of systolic and diastolic pressures 15 and 10 mmHg). To allow for a 20% drop‐out rate (no endpoints available), 360 patients had to be included. During the trial, the steering committee decided to expand the number of patients further, because of additional research to compliance with treatment.
Data are presented as mean±standard deviation. Between‐group comparisons involved the following statistical methods: one‐way analysis of variance, Student t‐test, Mann–Whitney, when not normally distributed, or chi‐square for proportions. To compare variance of measurements within a group of subjects, paired sample T‐tests were done. To improve mutual comparison of OBPM, SBPM and ABPM, the OBPM value of the third visit was used, as most patients were without antihypertensive treatment at that time, and ABPM and SBPM were assessed near that visit. All statistical calculations were performed using SPSS version 12.0 (SPSS, Inc. Chicago, Illinois).
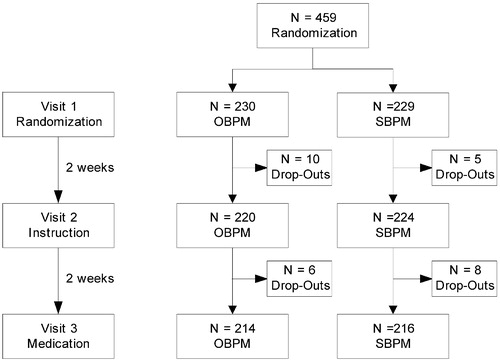
From April 2002 to October 2003, four university hospitals and surrounding general practices recruited 459 patients who were randomized to either the OP or SP group. Four weeks after randomization, i.e. at the time when study treatment was started, 29 patients (6%) had withdrawn from the study. However, this did not lead to inequality between the randomized groups (). As far as study assessments were concerned, patients who had dropped out did not differ from the remaining ones. Reasons for early termination were that patients had changed their mind about willingness to stop their current antihypertensive treatment or that they considered the visits to the hospital too cumbersome or that they thought the physical examination would be too exhausting.
Figure 1 Flow diagram of the run‐in phase in HOMERUS.
Patient characteristics
Patient characteristics (n = 459) are given in . There were no differences between the randomized groups, neither for these characteristics nor for the laboratory assessments, which were performed at 430 patients prior to visit 3 ().
Table I. Baseline characteristics of the randomized patients for the total group, the office pressure (OP) group and the self‐pressure (SP) group.
Table II. Laboratory results at baseline for the total group, the office pressure (OP) group and the self‐pressure (SP) group.
Results
Primary aim
Adequacy of randomization
shows the distribution of patients between the OP and SP group over the six pre‐specified outcome factors used for minimization. There were no differences among the factors between the randomized groups. Tables and show post‐hoc non‐stratified and stratified randomization, respectively, as distributed over the same factors that were used at the minimization procedure. Although there were no significant differences in distribution between the randomized groups over the six outcome factors, the minimization method was more balanced as compared to the other randomization methods.
Table IIIa. Result of random allocation using the minimization method.
Table IIIb. Result of random allocation using the randomization with four permuted blocks and without strata.
Table IIIc. Result of random allocation using the randomization with four permuted blocks and with 16 strata.
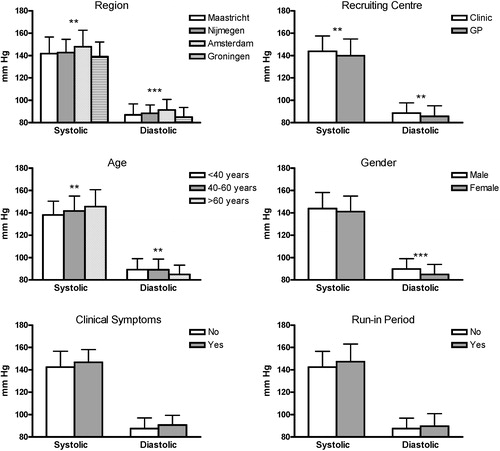
When looking at differences in 24‐h ABPM values in relation to the outcome factors, shows that BP differed significantly among four of the six factors.
Figure 2 Twenty‐four‐hour ambulatory blood pressure measurement (ABPM) illustrated for each outcome factor that was used for the minimization method. ***p<0.001; **p<0.03. Data are depicted as mean±standard deviation.
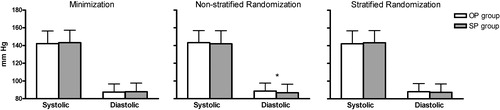
illustrates 24‐h ABPM values between the groups after randomizing patients according to the minimization, non‐stratified randomization and stratified randomization, respectively. Non‐stratified randomization resulted in a significant difference for 24‐h diastolic ambulatory BP.
Figure 3 Twenty‐four‐hour ambulatory blood pressure measurements for the office pressure (OP) and self‐pressure (SP) group as randomized with different randomization procedures. *p<0.05. Data are depicted as mean±standard deviation.
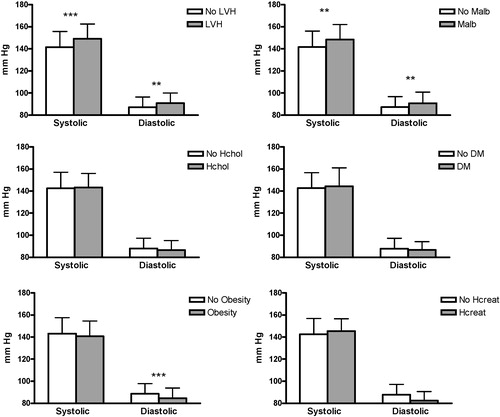
shows that patients with LVH, microalbuminuria and obesity had different BP values as compared to patients without these characteristics.
Figure 4 Twenty‐four‐hour ambulatory blood pressure measurements compared for patient characteristics that could influence prognosis. No LVH, patients without left ventricular hypertrophy; LVH, patients with left ventricular hypertrophy; Malb, microalbuminuria; Hchol, hypercholesterolaemia; DM, diabetes mellitus; Hcreat, elevated creatinine level. ***p<0.001;**p<0.03. Data are depicted as mean±standard deviation.
Secondary aim
Blood pressure
illustrates the office BP and heart rate measurements at enrolment and during the run‐in phase, as well as the results of ABPM (assessed ±3 weeks after enrolment, between the second and third visit) and SBPM (assessed 7 days preceding visit 3). During the 4 weeks going from visit 1 to visit 3, there was a significant increase ( p<0.001) in OBPM values from 5 mmHg systolic and 2 mmHg diastolic. Since visit 2 was an instruction visit, this was skipped for some patients in the OP group. At the time ABPM was performed, there were 430 patients in the study, of whom 18 patients (4%) refused to have ABPM since they had experienced serious discomfort during earlier measurements and six patients (1%) removed the device at night due to severe inconvenience. In the SP group, 11 patients (5%) did not perform or had incorrect initial SBPMs, as they had not understood the procedure; on average 39 measurements were performed. A significant stepwise difference was observed between OBPM, SBPM and ABPM, in which SBPM took an intermediate position with regard to systolic and diastolic BP ( p<0.001).
Table IV. Office blood pressure measurement (OBPM), ambulatory blood pressure measurement (ABPM) and self‐blood pressure measurement (SBPM) at enrolment.
At the end of the run‐in period, but before study medication was started, 33/430 patients (8%) appeared to have normal OBPM according to BHS guidelines Citation[5] (<140/90 mmHg) and 31 patients (7%) were normotensive according to their 24‐h ABPM (<125/80 mmHg). Of the 406 patients who delivered sufficient day‐ and night‐time BP values with their ABPM, 281 (69%) could be classified as dippers (defined as a night–day SBP and DBP fall ⩾10%), 146 of these (52%) belonged to the OP group. White coat hypertension (clinic BP⩾140 and/or 90 mmHg and 24‐h BP<125/80 mmHg) was found in 25 patients (6%), whereas 16 patients (4%) had reversed white coat hypertension (clinic BP<140/90 mmHg and 24‐h BP⩾125 or 80 mmHg). Overall, patients were more likely to have a systolic OBPM⩾140 mmHg (n = 389, 90%) than to have a diastolic OBPM⩾90 mmHg (n = 332, 77%).
Discussion
Primary aim
Our findings show that with the minimization and stratified randomization method, the two groups were well matched with respect to clinical characteristics. The choice of randomizing for the six factors used in this study seems to be justified by the significant differences in ambulatory BP level that were found in four of the six outcome factors. The non‐stratified randomization method should be avoided for use in clinical trials, as this resulted in a significant difference in diastolic ambulatory BP between the randomized groups.
For this study, several limitations should be taken into account; minimization was actually performed in this study, whereas the other methods have been performed post‐hoc. Clinical symptoms, for which patients were randomized, were only registered when the patient or the treating physician knew this. We randomized for some factors that had no influence on treatment. In the present study, 459 patients were randomized of which 412 eventually performed the 24‐h ABPM that was used to determine similarity between the treatment groups. It is therefore possible that differences between the treatment groups are derived from missing ABPMs, although the number of patients that performed ABPM was similar in both groups.
The non‐stratified randomization procedure resulted in a rather balanced distribution, which is probably caused by the use of four permuted blocks. These four blocks provide an equal number of patients between the treatment groups after having randomized every four patients. After each four patients, two have randomized to the OP group and two to the SP group, which can occur in six ways: (i) OOSS, (ii) OSOS, (iii) OSSO, (iv) SSOO, (v) SOSO and (vi) SOOS. With permuted blocks of size four, the number of patients assigned to each treatment within a block can never differ by more than two.
Some authorities argue that for large trials it is unnecessary to stratify Citation[6], Citation[7]; however, this cannot be concluded from our results. Although there were no differences for each outcome factor separately, non‐stratified randomization eventually resulted in a difference in 24‐h diastolic BP between the groups.
Stratified randomization provided more similarity with respect to outcome factors. There are several arguments that plead for use of this method: it diminishes the occurrence of type I Citation[8], Citation[9] and type II Citation[10–12] errors and facilitates subgroup and interim analyses Citation[13]. The latter is related to the fact that stratified randomization provides balance in a small population. Because of this, some authoritative bodies believe that stratified randomization is necessary for a valid comparison in small trials (n<100) Citation[14]. A disadvantage of stratified randomization is the fact that the number of outcome factors for which can be randomized is limited. According to Therneau, stratified randomization begins to fail when the number of factor level combinations approaches half the sample size Citation[15]. If we would have randomized for six factors, as were used with the minimization method, a number of 4×2×3×2×2×2 = 192 strata would be needed. According to Kernan et al. the amount of factor levels should even be smaller. Their advice is that the maximum number of strata should be less than n/(B×4), where n = number of patients in the trial and B = the block size Citation[12]. Therefore, when many variables can affect prognosis or treatment responsiveness, minimization seems the most appropriate method.
With minimization, the allocation of the next participant in a trial depends (wholly or partly) on the characteristics of those participants already enrolled. The aim is that each allocation should minimize the imbalance across multiple factors Citation[16]. As shown in this study and also by others Citation[17], minimization ensures excellent balance between groups for several outcome factors, even in small trials. For this reason, minimization should be used in hypertension trials, as there are many factors that influence BP, clearly demonstrated with the data from the HOMERUS population. The present data confirmed that age, gender, LVMI, microalbuminuria, region, centre of recruitment and BMI influenced BP level.
In our opinion, the HOMERUS population provided an excellent opportunity to determine the most appropriate randomization method out of three. Since BP value is the most important outcome, the treatment groups have to be similar for BP level. As shown in the present study, many outcome factors can influence BP level. Therefore, this study required well‐performed randomization for many outcome factors in order to exclude the chance of an unbalanced distribution for one factor that could influence outcome and possibly cause a type I error.
Secondary aim
Participants of the HOMERUS‐trial could be characterized as middle‐aged, mild to moderate hypertensives, with one or two cardiovascular risk factors. Target organ damage, i.e. either LVH or albuminuria, was seen in 14% of the population. Overall, the average 10‐year cardiovascular risk in the patients ranged between 10% and 20%, according to the ESH/ESC hypertension guidelines Citation[18]. Most patients, who were included in HOMERUS, were treated with antihypertensive medication at study entrance, among which beta‐blockers and diuretics were most frequently prescribed. There was a stepwise difference between OBPM, SBPM and ABPM values, in which OBPM was highest and SBPM took an intermediate position with regard to systolic and diastolic BP. Most patients (69%) could be classified as dippers and 6% of the subjects had white coat hypertension. Furthermore, according to OBPM more patients were characterized as being hypertensive by their systolic BP than by their diastolic BP.
Conclusion
The results of this study led us to conclude that minimization and stratified randomization provide a balanced distribution over the outcome factors. Although the HOMERUS‐trial had more than 400 participants, non‐stratified randomization led to a difference in treatment groups and, therefore, should not be used in clinical trials. Stratified randomization may approach accuracy of the minimization method, but has the disadvantage that the amount of outcome factors that can be randomized is limited. Since there are many factors that can influence BP level, the method of minimization, which also allows subgroup and interim analysis, should be the preferred randomization method in hypertension trials.
Acknowledgement
This study was supported by grant 945‐01‐043 from ZONMW (Den Haag).
References
- Pocock S. J., Simon R. Sequential treatment assignment with balancing for prognostic factors in the controlled clinical trial. Biometrics 1975; 31: 103–115
- Verberk W. J., Kroon A. A., Kessels A. G., Dirksen C., Nelemans P. J., Lenders J. W., et al. Home versus Office blood pressure MEasurements: Reduction of Unnecessary treatment Study: rationale and study design of the HOMERUS trial. Blood Press 2003; 12: 326–333
- 2003 European Society of Hypertension–European Society of Cardiology guidelines for the management of arterial hypertension. J Hypertens 2003; 21: 1011–1053
- Devereux R. B., Reichek N. Echocardiographic determination of left ventricular mass in man. Anatomic validation of the method. Circulation 1977; 55: 613–618
- Williams B., Poulter N. R., Brown M. J., Davis M., McInnes G. T., Potter J. F., et al. British Hypertension Society guidelines for hypertension management 2004 (BHS‐IV): Summary. BMJ 2004; 328: 634–640
- Meier P. Stratification in the design of a clinical trial. Control Clin Trials 1981; 1: 355–361
- Peto R., Pike M. C., Armitage P., Breslow N. E., Cox D. R., Howard S. V., et al. Design and analysis of randomized clinical trials requiring prolonged observation of each patient. I. Introduction and design. Br J Cancer 1976; 34: 585–612
- Birkett N. J. Adaptive allocation in randomized controlled trials. Control Clin Trials 1985; 6: 146–155
- Feinstein A. R., Landis J. R. The role of prognostic stratification in preventing the bias permitted by random allocation of treatment. J Chronic Dis 1976; 29: 277–284
- Miettinen O. S. Stratification by a multivariate confounder score. Am J Epidemiol 1976; 104: 609–620
- Grizzle J. E. A note on stratifying versus complete random assignment in clinical trials. Control Clin Trials 1982; 3: 365–368
- Kernan W. N., Viscoli C. M., Makuch R. W., Brass L. M., Horwitz R. I. Stratified randomization for clinical trials. J Clin Epidemiol 1999; 52: 19–26
- Simon R. Restricted randomization designs in clinical trials. Biometrics 1979; 35: 503–512
- Armitage P., Gehan E. A. Statistical methods for the identification and use of prognostic factors. Int J Cancer 1974; 13: 16–36
- Therneau T. M. How many stratification factors are “too many” to use in a randomization plan?. Control Clin Trials 1993; 14: 98–108
- Altman D. G., Bland J. M. Treatment allocation by minimisation. BMJ 2005; 330: 843
- Brown M. J., Palmer C. R., Castaigne A., de Leeuw P. W., Mancia G., Rosenthal T., et al. Morbidity and mortality in patients randomised to double‐blind treatment with a long‐acting calcium‐channel blocker or diuretic in the International Nifedipine GITS study: Intervention as a Goal in Hypertension Treatment (INSIGHT). Lancet 2000; 356: 366–372
- Cifkova R., Erdine S., Fagard R., Farsang C., Heagerty A. M., Kiowski W., et al. Practice guidelines for primary care physicians: 2003 ESH/ESC hypertension guidelines. J Hypertens 2003; 21: 1779–1786