
Abstract
Background: The association between elevated blood pressure (BP) and childhood obesity has been documented in several studies. However, little is known the difference in BP levels among children and adolescents with different patterns of fat distribution. The present study examined the association of subcutaneous fat distributional pattern with obesity and elevated BP among children and adolescents.
Methods: A total of 38,687 students (19,386 boys and 19,301 girls) aged 7–17 years participated in the study. Body mass index (BMI) cutoff points recommended by the International Obesity Task Force (IOTF) were used to define overweight and general obesity. Abdominal obesity was defined as waist-to-height ratio (WHtR) ≥ 0.5. Relatively high BP (RHBP) status was defined as systolic blood pressure (SBP) and/or diastolic blood pressure (DBP) ≥ 95th percentile for age and gender. All individuals were classified into four groups (Q1–Q4) according to the age and sex-specific quartiles of subscapular to triceps skinfold thickness ratio (STR), the prevalence rates of overweight, general obesity, abdominal obesity and RHBP among the four groups were compared.
Results: In both boys and girls, significant differences in the prevalence rates of overweight, general obesity, abdominal obesity and RHBP were observed among the four groups, an increasing trend was observed from the Q1 (STR <25 th) group to the Q4 (STR ≥ 75th) group (p < 0.01). Children and adolescents with high STR had higher prevalence of overweight, obesity and RHBP than their counterparts with low STR (p < 0.01).
Conclusion: Truncal pattern of subcutaneous fat distribution is associated with obesity and elevated BP among children and adolescents. Public health attention should not only focus on the amount of body fat, but also on the distributional pattern of body fat.
Introduction
The prevalence of obesity in children and adolescents, with its rapid rising trend [Citation1,Citation2] and attendant health risks [Citation3], has become an important public health concern facing the world today [Citation4]. In 2009–2010, 18.2% of US children and adolescents aged 6–19 years were obese [Citation5]. China is the largest developing country in the world, along with the rapid economic growth, children and adolescents are becoming increasingly obese [Citation6]. It was estimated that 5.1% of Chinese children and adolescents aged 7–18 years were obese in 2010 [Citation7].
Body mass index (BMI) is perhaps the most commonly used measure for defining overweight and obesity in clinical practice and population surveys. However, BMI cannot distinguish between fat and fat-free mass, it provides no information on body fat distribution. Several studies have shown that compared with BMI, body fat distribution plays a greater role in the development of obesity-related complications such as cardiovascular disease and type 2 diabetes [Citation8]. Skinfold thickness (SFT) measurements are widely used to assess body fat because the measurements are non-invasive, simple and less expensive than laboratory-based techniques. Furthermore, subscapular to triceps skinfold thickness ratio (STR) as an indicator of trunk versus peripheral distribution of body fat has been widely applied in large-scale epidemiological studies [Citation9–11].
The association between elevated blood pressure (BP) and childhood obesity has been documented in several studies. However, little is known the difference in BP levels among children and adolescents with different patterns of fat distribution. In this article, based on a large sample, we report the association of subcutaneous fat distributional pattern with obesity and elevated BP among children and adolescents in Shandong, China.
Subjects and methods
The study was approved by the Ethical Committee of the Shandong Center for Disease Control and Prevention, Shandong, China.
Study population
Data for this study were obtained from a large cross-sectional survey of schoolchildren. A total of 38,687 students (19,386 boys and 19,301 girls) from 17 districts in Shandong Province, students of Han nationality, aged 7–17 years, participated in the National Surveys on Chinese Students’ Constitution and Health, which were carried out in September to October 2014. The sampling method was stratified multistage sampling based on selected primary and secondary schools. Six public schools (two primary schools, two junior high schools, and two senior high schools) from each of the 17 districts in Shandong were randomly selected and invited to participate in the study. From the selected schools, two classes in each grade were selected, and all students of the selected classes were invited to join the study. All subjects were primary and secondary students, ranging from 7 to 17 years of age, and all were of Han ancestry that accounts for ∼99.32% of the total population in Shandong. All subjects voluntarily joined this study with informed consents.
Measurements
All measurements were performed by a team of trained health professionals in each of the 17 districts. Each professional is required to pass a training course for anthropometric measurement organized by the investigation team in Shandong. All measurements were taken using the same type of apparatus and followed the same procedures [Citation12]. Height without shoes was measured using metal column height-measuring stands to the nearest 0.1 cm. Weight was measured using lever scales to the nearest 0.1 kg while the subjects wore their light clothes. Waist circumference (WC) was measured midway between the lowest rib and the superior border of the iliac crest with an inelastic measuring tape (Weiye, A-003; Shenzhen Weiye Measuring tool Company) at the end of normal expiration to the nearest 0.1 cm. BMI was calculated from their height and weight (kg/m2), waist-to-height ratio (WHtR) was calculated as WC divided by height. SFT were measured on the right side of the body using Skinfold Caliper (Minjian, GMCS-PZQ; Beijing Xindong Huateng Sports Instruments Company, Limited) to the nearest 0.5 mm, at the two sites: (i) triceps, halfway between the acromion process and the olecranon process, and (ii) subscapular, 1.0 cm below the inferior angle of the scapula, at an angle of 45° to the lateral side of the body. In each participant, three measurements were taken, and the middle value was recorded for one skinfold site. Subscapular to triceps skinfold thickness ratio (STR), an index of subcutaneous adipose tissue distribution (truncal/peripheral), was calculated based on the measurements at the two sites. Systolic blood pressure (SBP) and diastolic blood pressure (DBP) were measured using a mercury sphygmomanometer after each subject had rested for at least 15 min in a sitting position. BP was measured twice on the right arm with an appropriately sized cuff (covering 1/2∼3/4 of the length of the upper arm) and the average value was recorded on the study form. DBP was defined via Korotkoff Sound 5.
Definitions
The BMI cutoff points recommended by the International Obesity Task Force (IOTF) were used to define overweight and general obesity [Citation13]. Abdominal obesity was defined as WHtR ≥ 0.5 [Citation14]. Relatively high BP (RHBP) status was defined as SBP and/or DBP ≥ 95th percentile for age and gender according to the BP reference standards for Chinese children and adolescents established in 2010 [Citation15]. The age- and sex-specific quartiles of STR were calculated (), and all subjects were classified into four groups (Q1, STR < 25th. Q2, 25th ≤ STR < 50th. Q3, 50th ≤ STR < 75th. Q4, STR ≥ 75th). Subjects in the upper fourth (Q4) were defined as ‘truncal distribution’, and those in the lower fourth (Q1) were defined as ‘peripheral distribution’.
Table 1. The quartiles of subscapular to triceps ratio in boys and girls aged 7–17 years.
Statistical analyses
Considering the BMI, WC, WHtR, SBP and DBP levels of children change with age, Z-scores of BMI, WC, WHtR, SBP and DBP were calculated based on the distribution of the total sample, and comparisons among the four groups were made by one-way ANOVA (post-hoc analyses by LSD test). Prevalence rates of overweight, general obesity, abdominal obesity and RHBP were determined, and comparisons among the four groups were made by χ2 test. All analyses were performed with the statistical package SPSS 11.5. Significance was defined at the 0.05 level.
Results
The characteristics of BMI, WC, WHtR, SBP and DBP among different groups by STR categories are presented in . In both boys and girls, statistical significant differences in BMI, WC, WHtR, SBP and DBP were observed among the four groups (p < 0.01). With increasing quartiles of STR, subjects tended to have higher BMI, WC, WHtR and BP levels. The comparisons of BMI, WC and BP levels in children and adolescents aged 7–17 with different patterns of subcutaneous fat distribution are shown in . For both boys and girls, the mean values of BMI, WC, SBP and DBP were significantly higher in ‘truncal distribution’ group (STR ≥ 75th) than in ‘peripheral distribution’ group (STR < 25th) in all age groups (p < 0.01), the range of differences being 4.3–6.8 Kg/m2, 12.9–19.1 cm, 3.3–4.1 mmHg and 3.0–4.9 mmHg for boys, and 3.7–5.4 Kg/m2, 9.2–14.3 cm, 3.2–4.9 mmHg and 2.8–3.6 mmHg for girls.
Figure 1. Mean values of BMI and WC in boys and girls with different patterns of fat distribution. (BMI, body mass index. WC, waist circumference. STR, subscapular to triceps skinfold thickness ratio. Q1, STR < 25th. Q4, STR ≥ 75th).
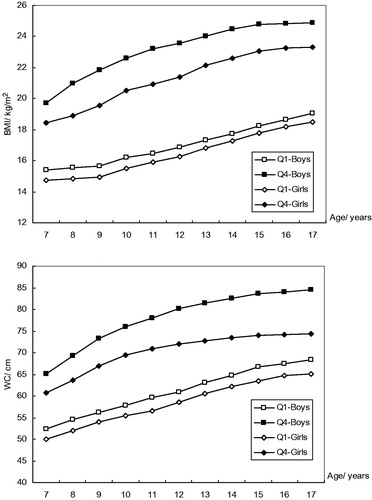
Figure 2. Mean values of SBP and DBP in boys and girls with different patterns of fat distribution. (SBP, systolic blood pressure. DBP, diastolic blood pressure. STR, subscapular to triceps skinfold thickness ratio. Q1, STR < 25th. Q4, STR ≥ 75th).
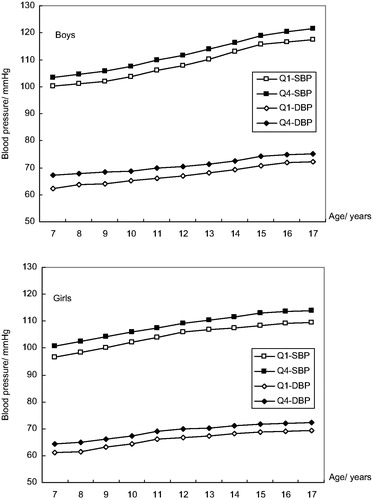
Table 2. Comparisons of Z-score for BMI, WC, WHtR, SBP and DBP in different groups categorized by STR.
The prevalence of overweight, obesity and RHBP in different groups categorized by STR are shown in . For both boys and girls, an increasing trend was observed from the Q1 group to the Q4 group (p < 0.01). For boys, the prevalence of overweight, general obesity and abdominal obesity increased from 11.93, 1.97 and 5.62% in the Q1 group to 20.96, 16.02 and 29.28% in the Q4 group, respectively (p < 0.01); and for girls, from 5.20, 0.55 and 1.73% in the Q1 group to 19.21, 6.08 and 14.84% in the Q4 group, respectively (p < 0.01). Similarly, the prevalence of RHBP increased with the STR, from 14.98% for boys and 12.79% for girls in the Q1 group to 25.49% for boys and 20.76 for girls in the Q4 group (p < 0.01). In a word, children and adolescents with ‘truncal distribution’ (STR ≥ 75th) had higher prevalence of overweight, obesity and RHBP than their counterparts with ‘peripheral distribution’ (STR < 25th).
Table 3. Prevalence of overweight, general obesity, abdominal obesity and relatively high BP in different groups categorized by STR.
Discussion
To the best of our knowledge, this is the first study examining the patterns of subcutaneous fat distribution and its association with obesity and elevated BP among children and adolescents in Shandong, one of the populous provinces in China. Based on a large sample survey, we found that truncal pattern of subcutaneous fat distribution is associated with obesity and elevated BP.
BMI is commonly used to assess a child's weight status but it does not provide information about the distribution of body fat. It has been recognized that the relationship between obesity and cardiovascular risk factors depends not only on the amount of body fat but also on its distribution [Citation8,Citation10]. A number of different tools and methodologies have been developed to measure body composition, and SFT have been shown to be closely correlated with total body fatness [Citation16–19]. Subscapular and triceps skinfolds were used because they are sites easy to locate and measure. Furthermore, ratio based on the two skinfolds (STR) has often been used as an index of the distribution of subcutaneous fat between truncal and peripheral depots, and has been proposed as a marker of cardiovascular risk [Citation10,Citation20].
Epidemiological studies have illustrated convincingly that fat distribution is associated with cardiovascular risk factors in both children and adults [Citation8,Citation10,Citation21]. Several studies in children and adolescents have observed a significant relationship between cardiovascular risk factors and STR, children and adolescents with truncal obesity are at a substantially increased risk for the development of multiple cardiovascular risk factors [Citation22]. Tresaco et al. observed a negative association between STR and HDL-cholesterol levels in male adolescents [Citation23]. A negative association between STR and HDL cholesterol levels has also been found among children and adolescents aged 4–19 years in the Third National Health and Nutrition Examination Survey (NHANES III) [Citation24]. Misra et al. reported a high prevalence of insulin resistance is associated with truncal body fat patterning in Indian children [Citation25]. Therefore, several studies suggested that fat distribution is a more important independent correlate of cardiovascular risk factors than percent body fat in children and adolescents [Citation21]. In this study, we found that obesity and elevated BP is associated with the distributional pattern of subcutaneous fat in children and adolescents, children and adolescents with truncal fat distribution had higher prevalence of obesity and elevated BP than those with peripheral fat distribution. Together with the above literatures, our results suggested that more attention should be paid to monitoring of fat distribution among children and adolescents, public health attention should not only focus on the amount of body fat, but also on the changes in distributional pattern of body fat.
Childhood overweight and obesity has increased dramatically during the past decades, both in developing and developed countries [Citation1,Citation2]. In the present study, we found that the total prevalence of overweight and obesity were 17.83 and 7.73% for boys, and 12.27 and 2.89% for girls by the IOTF BMI cut-offs in the large sample. When WHtR was used to diagnose abdominal obesity, we also found 16.44% of boys and 7.79% of girls suffer from abdominal obesity. These figures indicated a widespread epidemic situation among children and adolescents in Shandong China. Comprehensive strategies of intervention should include periodical monitoring, education on pattern of nutrition, physical exercises and healthy dietary behavior, to achieve reasonable dietary intake, increase physical activity, a change in sedentary lifestyles and corresponding behavioral modifications.
The major strength of this study is that, based on the data from a large population, it examines the patterns of subcutaneous fat distribution and its association with obesity and elevated BP among children and adolescents. However, three limitations are noted. Firstly, BP measurement at a single visit usually overestimates hypertension prevalence; however, the purpose of using BP categories in the analysis was to obtain a general idea of the extent of high BP in the studied adolescents rather than to diagnose the presence of hypertension among them. Thus, in this paper, we use the term ‘relatively high BP’ rather than ‘high BP’. Secondly, because of various restraints, other biochemical indicators (e.g., blood lipids and blood glucose) were not measured in the sample; an in-depth factor analysis could not be carried out. We hope that future studies will address this topic. Thirdly, the absence of international and national STR cut-offs for fat distribution was also a limitation, so the definition for distributional pattern of subcutaneous fat in this study was relative and shortcoming was inevitable.
In summary, this study demonstrated that obesity and elevated BP is associated with the distributional pattern of subcutaneous fat in children and adolescents, children and adolescents with truncal fat distribution had higher prevalence of obesity and elevated BP than those with peripheral fat distribution. Therefore, public health attention should not only focus on the amount of body fat, but also on the changes in distributional pattern of body fat.
Acknowledgements
We thank all the team members and all participants. Special thanks to Mr. B Yu for providing access to the survey data.
Disclosure statement
There are no conflicts of interest on behalf of any of the authors.
Additional information
Funding
References
- Wang Y, Lobstein T. Worldwide trends in childhood overweight and obesity. Int J Pediatr Obes. 2006;1:11–25.
- de Onis M, Blössner M, Borghi E. Global prevalence and trends of overweight and obesity among preschool children. Am J Clin Nutr. 2010;92:1257–1264.
- Franks PW, Hanson RL, Knowler WC, et al. Childhood obesity, other cardiovascular risk factors, and premature death. N Engl J Med. 2010;362:485–493.
- Karnik S, Kanekar A. Childhood obesity: a global public health crisis. Int J Prev Med. 2012;3:1–7.
- Ogden CL, Carroll MD, Kit BK, et al. Prevalence of obesity and trends in body mass index among US children and adolescents, 1999–2010. JAMA. 2012;307:483–490.
- Cheng TO. China’s epidemic of child obesity: an ounce of prevention is better than a pound of treatment. Int J Cardiol. 2014;172:1–7.
- Ji CY, Chen TJ. Empirical changes in the prevalence of overweight and obesity among Chinese students from 1985 to 2010 and corresponding preventive strategies. Biomed Environ Sci. 2013;26:1–12.
- Despres JP. Body fat distribution and risk of cardiovascular disease: an update. Circulation. 2012;126:1301–1313.
- Moreno LA, Mesana MI, González-Gross M, et al. Body fat distribution reference standards in Spanish adolescents: the AVENA Study. Int J Obes Relat Metab Disord. 2007;31:1798–1805.
- Tanne D, Medalie JH, Goldbourt U. Body fat distribution and long-term risk of stroke mortality. Stroke. 2005;36:1021–1025.
- Moreno LA, Fleta J, Sarria A, et al. Secular changes in body fat patterning in children and adolescents of Zaragoza (Spain), 1980–1995. Int J Obes Relat Metab Disord. 2001;25:1656–1660.
- Research Section of the Constitution and Health of Chinese Students (RSCHCS). Report on the Physical Fitness and Health Research of Chinese School Students. Beijing: Higher Education Press, 2012; pp. 23–70. (in Chinese).
- Cole TJ, Lobstein T. Extended international (IOTF) body mass index cut-offs for thinness, overweight and obesity. Pediatr Obes. 2012;7:284–294.
- McCarthy HD, Ashwell M. A study of central fatness using waist-to-height ratios in UK children and adolescents over two decades supports the simple message: ‘keep your waist circumference to less than half your height’. Int J Obes Relat Metab Disord. 2006;30:988–992.
- Mi J, Wang TY, Meng LH, et al. Development of blood pressure reference standards for Chinese children and adolescents. Chin J Evid Based Pediatr. 2010;15:4–14. [in Chinese].
- Mei Z, Grummer-Strawn LM, Wang J, et al. Do skinfold measurements provide additional information to body mass index in the assessment of body fatness among children and adolescents? Pediatrics. 2007;119:e1306–e1313.
- Freedman DS, Wang J, Ogden CL, et al. The prediction of body fatness by BMI and skinfold thicknesses among children and adolescents. Ann Hum Biol. 2007;34:183–194.
- Steinberger J, Jacobs DR, Raatz S, et al. Comparison of body fatness measurements by BMI and skinfolds vs. dual energy X-ray absorptiometry and their relation to cardiovascular risk factors in adolescents. Int J Obes Relat Metab Disord. 2005;29:1346–1352.
- Addo OY, Pereira MA, Himes JH. Comparability of skinfold thickness to DXA whole-body total fat in their associations with serum triglycerides in youths. Eur J Clin Nutr. 2012;66:989–993.
- Pi-Sunyer FX. The epidemiology of central fat distribution in relation to disease. Nut Rev. 2004;62:120–126.
- Daniels SR, Morrison JA, Sprecher DL, et al. Association of body fat distribution and cardiovascular risk factors in children and adolescents. Circulation. 1999;99:541–545.
- Freedman DS, Serdula MK, Srinivasan SR, et al. Relation of circumferences and skinfold thicknesses to lipid and insulin concentrations in children and adolescents: the Bogalusa Heart Study. Am J Clin Nutr. 1999;69:308–317.
- Tresaco B, Moreno LA, Ruiz JR, et al. Truncal and abdominal fat as determinants of high triglycerides and low HDL-cholesterol in adolescents. Obesity (Silver Spring). 2009;17:1086–1091.
- Gillum RF. Distribution of waist-to-hip ratio, other indices of body fat distribution and obesity and associations with HDL cholesterol in children and young adults aged 4–19 years: the Third National Health and Nutrition Examination Survey. Int J Obes Relat Metab Disord. 1999;23:556–563.
- Misra A, Vikram NK, Arya S, et al. High prevalence of insulin resistance in postpubertal Asian Indian children is associated with adverse truncal body fat patterning, abdominal adiposity and excess body fat. Int J Obes Relat Metab Disord. 2004;28:1217–1226.