
Abstract
Background
The prevalence of elevated blood pressure (BP) has been raised worldwide. Food consumption, eating habits, and nutritional lifestyle related to meal timing, skipping meals, and meal contents have recently received more attention in studies on BP and metabolic syndrome. Purpose: This study evaluated the association between habitual food consumption, eating behavior, and meal timing with BP among Jordanian adults.
Methods
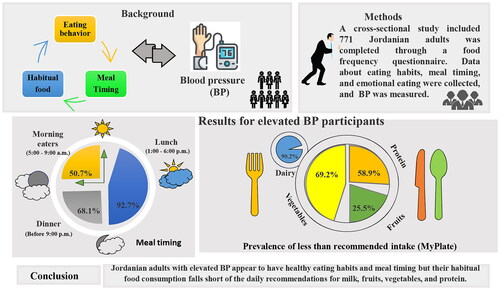
A cross-sectional study included 771 Jordanian adults. A food frequency questionnaire was completed. Data about eating habits, meal timing, and emotional eating were collected. BP was measured.
Results
The prevalence of less than recommended intake of vegetables, milk, protein, and fruits was higher in participants with elevated BP (69.2%, 90.2%, 58.9%, and 25.5%, respectively) as compared to the normal BP group (p < 0.001). Consuming vegetables and milk less than the recommended was reported to significantly increase the likelihood of elevated BP by OR= (1.60, and 2.75 (95%CI: 1.06-2.40; 1.62-4.66). Hence, consuming more than recommended fruit reduced the risk of elevated BP by OR = 0.56 (95%CI: 0.38-0.82). A 63.2% of elevated BP participants have three meals daily, a higher percentage of intake of one (23.5%) and two (45.7%) snacks. However, they had a higher percentage of morning eaters (50.7%), had lunch between 1:00-6:00 PM (92.7%), and had dinner between 6:00 and 9:00 PM (68.1%).
Conclusions
Although Jordanian adults with elevated BP appear to have healthy eating habits and meal timing and frequency, their habitual food consumption falls short of the daily recommendations for milk, fruits, vegetables, and protein.
Plain summary
Numerous epidemiological studies have revealed a steadily rising prevalence of elevated BP, and one critical independent and modifiable risk factor for this condition is obesity.
One global non-communicable diseases (NCD) target adopted by the World Health Assembly in 2013 is to lower the prevalence of raised BP by 25% by 2025 compared with its 2010 level.
Lifestyle improvement is a cornerstone of CVD prevention; diet is one of the most effective strategies for attaining BP reduction and control as low-salt diets, dietary approaches to stop hypertension (DASH), a low-salt Mediterranean diet, an energy-restriction diet, vegetarian diet, and alternate-day fasting.
Eating habits and nutritional lifestyle related to meal timing, skipping meals, and meal contents have recently received more attention in studies on BP and metabolic syndrome.
a relationship between elevated BP and metabolic syndrome, infrequent fruit eating, skipping meals, irregular meal frequency and timing, and obesity has been found among adults.
It has been found that earlier meal timing could reduce cardiometabolic disease burden and aid in weight loss; on the other hand, meal frequency was inversely associated with the prevalence of abdominal obesity, elevated BP, and elevated triglycerides. Morning eating was associated with a lower prevalence of metabolic syndrome than no morning eating.
Graphical Abstract
1. Introduction
Numerous epidemiological studies have revealed a steadily rising prevalence of elevated BP, and one critical independent and modifiable risk factor for this condition is obesity [Citation1, Citation2]. Also, elevated BP is among the most critical risk factors for ischaemic heart disease, stroke, other cardiovascular diseases (CVD), chronic kidney disease, and dementia [Citation3]. One global non-communicable diseases (NCD) target adopted by the World Health Assembly in 2013 is to lower the prevalence of raised BP by 25% by 2025 compared with its 2010 level [Citation4, Citation5]. Raised BP is defined as systolic BP (SBP) ≥140 mmHg or diastolic BP (DBP)≥90 mmHg [Citation3].
A study also showed an increased risk of CVD in those with high-normal BP, that is, 130–139 mmHg for SBP and 85–89 mmHg for DBP, compared with those with optimal BP, defined as SBP < 120 mmHg and DBP < 80 mmHg [Citation6]. Lifestyle improvement is a cornerstone of CVD prevention. Diet is one of the most effective strategies for attaining BP reduction and control as low-salt diets, dietary approaches to stop hypertension (DASH), a low-salt Mediterranean diet, an energy-restriction diet, and alternate-day fasting [Citation7–9]. Also, vegetarian diets are associated with significant reductions in BP compared with omnivorous diets, suggesting that they may play a vital role in the primary prevention and overall management of hypertension [Citation10, Citation11]. A high dose of vegetables, whole grains, some low-fat dairy products, and a limited intake of red meat, sweets, and trans-hydrogenated fats are other characteristics of the DASH diet. The low-salt Mediterranean diet is contrary to the Westernized diet. Furthermore, these diets work best when they result in significant weight loss [Citation9, Citation12]. Moreover, some nutraceuticals (such as lycopene, beetroot, magnesium, calcium, vitamin C, and beverages high in catechins) might reduce BP [Citation9].
The primary diet and lifestyle modifications that were recommended for the reduction of elevated BP are sodium restriction (< 1500 mg/d or minimally an absolute reduction of at least 1000 mg/d, increased dietary potassium intake (3500–5000 mg/d), weight loss to target ideal body weight (for overweight/obese patients), proper physical activity, moderation of alcohol intake and a healthy DASH-like diet rich in fruits, vegetables, whole grains and low-fat dairy products with reduced saturated and total fat [Citation13].
Eating habits and nutritional lifestyle related to meal timing, skipping meals, and meal contents have recently received more attention in studies on BP and metabolic syndrome. Many studies approved that long eating duration and late first and last meal timing are linked to cardiometabolic risks [Citation14–16]. Also, several findings suggested that skipping breakfast or bedtime meals and/or snacks are risk factors for poor cardiovascular health [Citation17, Citation18]. The indicated potential molecular mechanism by which skipping breakfast could induce abnormal lipid metabolism related to the altered circadian oscillation of hepatic gene expression [Citation19].
An epidemiological study finding showed that jetlag eating patterns and day-to-day irregularity in the energy intake timing, eating span, and extent of evening eating might cause cardiometabolic disease burden [Citation20]. Adults were also found to have a relationship between elevated BP and metabolic syndrome, infrequent fruit eating, skipping meals, irregular meal frequency and timing, and obesity [Citation21, Citation22].
On the other hand, it has been found that earlier meal timing could reduce cardiometabolic disease burden and aid in weight loss; interventions should be done to test this [Citation23].
Additionally, meal frequency was inversely associated with the prevalence of abdominal obesity, elevated BP, and elevated triglycerides. Morning eating was associated with a lower prevalence of metabolic syndrome than no morning eating [Citation24].
No studies evaluate the association between BP, habitual food consumption, eating behavior, and meal timing among Jordanian adults. Therefore, this study aimed to describe and assess the association between habitual food consumption, eating behavior, and meal timing with BP among Jordanian adults.
2. Materials and methodology
2.1. Study Design and Participants
A population-based cross-sectional study was conducted in the Hashemite Kingdom of Jordan (March-May/2022). A randomly selected population sample was invited to participate in this study. The target sample was chosen from three governmental hospitals in the central regions of Jordan. It was collected from individuals regularly visiting these hospitals for follow-up care and/or their caregivers.
This study randomly recruited individuals irrespective of disease status for the NCD screening. Inclusion criteria were Jordanian, aged above 18 years, able to communicate, having BP measurements in the data set, and willing to participate. Exclusion criteria were Jordanians below 18 years old pregnant women having renal disease, cancer, anemia, liver diseases, and hypothyroidism. Of the 2376 participants seen, and as the BP test is not a routine procedure, only 771 participants matched the inclusion criteria and agreed to participate.
2.2. Ethical Approval of the Study Protocol
The study protocol was reviewed and approved by the institutional review board of The Hashemite University (No.19/1/2022/2023) and Jordan Ministry of Health (MBA/20219) by the Helsinki Declaration. Before enrolment in the study, informed oral consent was obtained from each willing and eligible subject.
2.3. Data collection
The questionnaire was written in English, translated into regional Arabic, and again into English to assure accuracy. Additionally, pre-testing surveys, using appropriate methodologies, and employing specialists for each task ensured the data’s quality. By scheduling daily meetings with data collectors after the data-gathering process was complete, the principal investigator verified the data’s completeness, correctness, and consistency. A qualified nutritionist conducted the participant interviews, gathered the necessary data, and checked the collected anthropometric data to ensure accuracy under the supervision of the principal investigator. To determine the body mass index (BMI), researchers examined the participants’ height and weight, and then BMI (kg/m2) was calculated according to Quetelet’s formula [Citation25]. Then, the BMI values were categorized into groups based on World Health Organization categories [Citation26].
2.4. Dietary assessment and eating behavior evaluation
The average daily portion size from each food group, as reported by a valid Food frequency questionnaire (FFQ), was recalled by participants. Food items from different food groups are included in the FFQ, which was created to measure habitual food consumption. The FFQ was modified to measure the daily intake of each food group in ounces and cups [Citation27, Citation28].
Based on MyPlate, dietary recommendations for each age group and total energy intake were determined for each participant. To meet the recommended daily energy intake, there should be a certain number of servings from each of the five food groups—grains, vegetables, fruits, protein, and dairy (Supplementary file 1). According to Al Hourani et al. (2023), Jordanian adults’ average daily calorie consumption was around 2400 kcal, while 2200 kcal for older adults [Citation29]. Then, participants were classified into three groups regarding meeting the MyPlate recommendations: lower than recommendations, meeting the recommendations, and more than recommendations.
Also, participants were asked to answer questions regarding their eating behaviors, including meal timing and frequency, as well as late-night and fast-food consumption. For meal frequency, participants were asked to describe their regular eating meals, food groups (most and most minor food groups consumed, type of consumed snacks, and most skipped meals), and eating frequency (number of meals and snacks/day). Meal timing was categorized as eating in the morning (breakfast and snacks), evening (lunch and snacks), and nighttime (dinner and snacks) [Citation24]. Eating times included: morning eating (eating between 5:00–9:00 AM), non-morning eating, evening eating (eating between 6:00–9:00 PM), and night eating (eating after 9:00 PM) [Citation24, Citation30].
2.5. Blood pressure measurement
Regarding the hospital’s protocols, a digital BP monitor (Omron M4, Koyoto, Japan) was used to assess BP. Thirty minutes before measurement, study participants were allowed to relax by seated with uncrossed legs and refraining from caffeine or smoking. The left upper arm of the participant was placed at the same level as the heart (is often the preferred arm to use). After that, three seated BP readings were taken one to five minutes apart (to prevent hyperemia to the upper arm [Citation31,Citation–32]). Refraining from coffee and smoking for 120 minutes [Citation33]. Finally, the participant’s BP status was calculated using the mean of the second and third readings [Citation34]. SBP of more than 120 mmHg or DBP of more than 80 mmHg or both were considered elevated BP [Citation35].
2.6. Statistical Analysis
Analysis was conducted using SPSS software (IBM SPSS Statistics for Windows, Version 23.0. Armonk, NY: IBM Corp). The normality of the distributions was assessed through the Kolmogorov-Smirnov test and Kurtosis and Skewness values. Participants’ characteristics were described using frequencies and percentages (%) for categorical variables and presented as means with standard deviation (SD) for continuous variables. The chi-square (χ2) test was performed to test the differences between participants for categorical. In contrast, the Multivariate analysis of variance (MANOVA)-test was performed to analyze differences between normally distributed variables (using gender, education, smoking, job, having disease, and BMI as confounding factors). Multinominal regression analysis assessed the correlation between food group classification based on MyPlate recommendation as an independent factor and BP calcification as a dependent factor, considering gender, BMI, smoking, job, diseases, and education level as confounding factors. A p-trend was calculated using linear regression and adjusted to age, gender, BMI, smoking, and education level as confounding factors. Linear regression tests were used to calculate the p-value for the trend. Findings with a p-value of < 0.05 were considered to be statistically significant.
3. Results
3.1. The general characteristics
The general characteristics of the study population based on blood pressure classification are shown in . The participant with normal blood pressure had a mean age of 46.3 ± 19.0y, weight of 69.1 ± 12.9 kg, height of 164.1 ± 10.3 cm, waist circumference of 85.1 ± 13.2 cm, hip circumference of 98.6 ± 16.4 cm, and BMI of 26.0 ± 8.2 kg/m2. For elevated blood pressure participants, the mean age was 55.3 ± 16.6y, 76.4 ± 11.9kg for weight, 166.5 ± 8.4cm for height, 78.6 ± 24.5cm for waist circumference, 90.3 ± 27.0cm for hip circumference, 27.6 ± 4.0kg/m2 for BMI. Among normal participants, 33.8% were males and 41.2% were females, 50.6% of them had normal weight, 49.9% had high school or less education and 36.5% had university level or higher education. On the other hand, the elevated blood pressure participants had a 41.2% prevalence of males and 58.8% of females, 50.4% of them were overweight, and 74.2% had high school or less education. Most of the participants with normal and elevated blood pressure were married (68.6% and 76.7%; respectively), smokers (52.3% and 48.5%; respectively), and had no job (70.9% and 76.2%; respectively). 63.6% of normal pressure participants had no chronic disease. 74.6% of elevated blood pressure had at least one chronic disease (specifically diabetes II, CVD, or their combination).
Table 1. Sample general characteristics based on Blood pressure categorization (n = 771).
3.2. The food group consumption and their percent consumption from MyPlate recommendation
As shown in . A, the mean consumptions of vegetables (2.5 ± 1.0 cup), fruits (2.4 ± 1.0 cup), and milk (1.6 ± 1.1 cup) were significantly higher among participants with normal BP in comparison to participants with elevated BP (2.2 ± 0.9 cup, 2.1 ± 0.9 cup, and 1.3 ± 0.9 cup, p<0.001; respectively). A similar result was seen in mean percent consumption from MyPlate recommendation of vegetables, fruit, and milk (. B), which was higher in the participants with normal BP (83.3 ± 33.4, 118.2 ± 48.6, and 154.8 ± 37.0, p<0.001; respectively) compared to participants with elevated BP (71.8 ± 30.3, 105.3 ± 43.4, and 41.7 ± 30.5, p<0.001; respectively). In contrast, participants with elevated BP had higher fat consumption (8.1 ± 5.4) compared to participants with normal BP (6.2 ± 4.9, p<0.001).
Figure 1. The Mean ± SD of food group consumption and their percent consumption from MyPlate recommendation among Blod pressure calcification for the total population. ** The value adjusted for gender, education, smoking, job, having disease, and BMI. The value is considered significant at p < 0.05. BP: Blood pressure

3.3. The food group consumption based on the MyPlate recommendation to less, more, or meeting recommendation
After classifying the food group consumption based on the MyPlate recommendation to less, more, or meeting recommendation (), the result revealed that although the prevalence of less than recommended intake from vegetables was the highest in both groups, participants with elevated BP had a higher percentage (69.2%) comparing to the participant with normal BP (54.1%). Moreover, participants with normal BP had a higher prevalence of meeting the recommendation and more than the recommended intake of vegetables (24.4% and 21.5%, respectively) in comparison to participants with elevated BP (21.6% and 9.2%, respectively) (p<0.001). For fruit consumption, participants with elevated BP had higher percentages of less or meeting the recommendations than the normal BP group (25.5% and 41.5% vs. 19.8% and 34.8%). On the other hand, participants with normal BP had the highest percentage of more than the recommendation of fruits (45.4% vs. 33.1% for elevated BP, p= 0.002). Most participants with normal or elevated BP had a high prevalence of grain consumption less than the recommended (86.7% and 81.5%, respectively). Regarding protein consumption, the elevated BP participants had a higher percentage of consumption, less than the recommended (58.9%) compared to normal BP participants (53.9%). In comparison, the normal BP participants had higher prevalences of consumption than the recommended (42.5% vs. 34.9% for elevated BP). Regardless of their BP status, most participants had a high prevalence of milk consumption that was less than recommended. However, elevated BP participants had the highest percentage (90.2% vs. 75.8% for normal BP). Normal BP participants had a higher percentage of meeting the recommended (18.1% vs. 7.8% for elevated BP) and more than the recommended milk intake (6.0% vs. 2.0% for elevated BP).
Table 2. Comparison of Food group consumption classification based on MyPlate Recommendation among blood pressure classification.
3.4. Multinominal regression analysis of food group classification based on MyPlate recommendation
To further clarify the association between the consumption of food groups based on MyPlate recommendation and BP, a Multinominal regression analysis was conducted and presented in . The consumption of vegetables less than the recommended was reported to increase significantly the likelihood of having elevated BP by OR = 1.60 (95%CI: 1.06-2.40). Also, the consumption of vegetables had a protective effect against having elevated BP with a p-value of trend = 0.007. The consumption of fruit more than the recommended reduced the risk of elevated BP by OR = 0.56 (95%CI: 0.38-0.82). On the other hand, consuming milk less than recommended increased the likelihood of elevated BP by OR = 2.75 (95%CI: 1.62-4.66).
Table 3. Multinominal regression analysis of food group classification based on MyPlate recommendation as an independent factor and BP classification as a dependent factor considering the confounding factor.
3.5. The meal frequency, and eating behavior among the study participants
The meal frequency and eating behavior of the study participants are shown in and . As illustrated in , two-thirds of elevated and Normal BP participants reported not skipping meals. The reported number of meals revealed that 68.2% of normal BP participants and 63.2% of elevated BP have three meals daily. Regarding the number of snacks, the participant with elevated BP reported a higher percentage of intake of one (23.5%) and two (45.7%) snacks daily compared to normal BP participants (18.4% and 39.4%, respectively). While normal BP participants reported a higher prevalence of intake of three snacks daily (31.2%) compared to elevated BP participants (20.2%). Most participants from both groups reported not having late food intake. For fast food consumption, 57% of normal BP participants reported consuming fast food 1-5 times/week, while 40.5% of elevated BP reported consuming fast food 1-5 times/week. On the other hand, of the elevated BP participants, 32.5% reported that they do not consume fast food, and 27.1% consumed fast food 1-3 times/month. This percentage was higher than normal BP participants (22.4% and 20.6%, respectively). Two-quarters of both groups reported that the most consumed food group was cereals. The most registered missed food groups were dairy products and legumes.
Figure 2. The prevalence of main meal timing among study population

Table 4. Meal frequency and eating behavior among the study population.
3.6. Meal timing and eating behavior
The main meals consumption are shown in , 50.7% of elevated BP participants were morning eaters compared to 40.8% of normal BP participants. In contrast, 46.4% of normal BP participants were non-morning eaters compared to 39.5% of elevated BP participants. Most of the participants had their lunch between 1:00 and 6:00 PM. Even though having dinner between 6:00 and 9:00 PM was prevalent among participants, the elevated BP participants had a higher percentage (68.1%) than normal BP participants (52.7%). Of normal BP participants, 30.0% were night eaters (After 9:00 PM), while 19.0% of elevated BP participants were night eaters.
4. Discussion
Researchers have focused on habitual food consumption across communities, particularly among those who have NCDs. Obesity is a critical risk factor for various NCDs, strongly associated with its prevalence, and food group intake and/or skipping are correlated to increase or decrease these diseases’ incidence. In the current study, we attempted to assess the habitual food intake, meal timing, emotional eating, and eating behaviors among Jordanian adults who were divided into two groups based on their BP readings: the regular BP group and the elevated BP group. The present data indicated that consumption of fruits, vegetables, and milk among elevated BP participants was lower than among regular participants. The prevalence of less than recommended intake among elevated BP participants was higher for the vegetable and protein groups. Vegetable consumption less than recommended increases the likelihood of having BP; at the same, it has a protective effect against elevated BP when consumed more than recommended. However, fruit consumption more than recommended decreases the likelihood of elevated BP. These results are consistent with many other results approved in several studies. Kimani et al. found that daily vegetables and fruit intake were linked to lower BP (p < 0.05) [Citation36]. Also, Gibbs et al. found that SBP was correlated with strict plant-based diets; DASH -5.53mmHg (95% confidence intervals −7.95, −3.12), Mediterranean -0.95mmHg (−1.70, −0.20), Vegan −1.30 mmHg (−3.90,1.29), Lacto-ovo vegetarian −5.47mmHg (−7.60,−0.34), Nordic −4.47mmHg (−7.14, −1.81), high-fiber −0.65 mmHg (−1.83,0.53), high-fruit and vegetable −0.57mmHg (−7.45,6.32)); on DBP, similar findings were observed [Citation37]. In Rio de Janeiro, Brazil, it has been found that lower weekly consumption of fruits (PR 1·37; 95% CI 1·07, 1·74) remained significantly associated with increased BP [Citation21]. Krubb and colleagues (2015) approved that a 100 g increase in adolescent fruit and vegetable intake was prospectively associated with a 0.9 mmHg reduction in SBP in young adult females (P = 0.02) but not in males (P = 0.8). using data from the National Health and Nutrition Examination Survey (NHANES) 2007–2014 to evaluate the associations between dietary intakes of total, cereal, vegetable, fruit, and fiber and hypertension among adults revealed that the odds ratios (95% confidence intervals) of hypertension for the highest tertile intakes of total, cereal, vegetable, fruit, and fiber were 0.62 (0.52–0.75), 0.80 (0.67–0.96), 0.82 (0.69–0.98), and 0.86 (0.71–1.04), respectively [Citation38]. Fruits and vegetables also include significant flavonoids, which may help decrease BP. According to reports, flavonoids contain cardioprotective qualities such as antioxidant, anti-inflammatory, and inducing apoptotic actions [Citation39, Citation40]. Notably, rich in fruits and vegetables, potassium is essential for regulating BP. Low dietary potassium increases sodium retention, which in turn raises BP. On the other hand, a high-potassium diet causes the kidneys to eliminate more salt and water, which lowers BP and heart rate [Citation41, Citation42].
Regarding the higher prevalence of less-than-recommended protein consumption, dairy products, and legumes were the most reported missed food groups in the present study. In line with the current findings, Buendia and colleagues found that lower mean SBP and DBP were linked to higher protein intake, regardless of the protein source. In addition, participants who consumed the most total protein had a 40% lower risk of having elevated BP (95% CI, 0.45 to 0.78). Also, higher fiber and protein diets resulted in a 59% (95% CI, 0.37-0.66) reduction in the chance of developing elevated BP [Citation43]. Moreover, protein intake at lunch was independently and negatively associated with SBP [Citation44]. Unlike the present findings, Bergia et al. approved that consuming a higher-protein, lower-fat meal does not influence BP compared to a lower-protein, higher-fat meal [Citation45]. Also, in Dutch adults, Der Kuil et al. found no correlation between changes in SBP and DBP and total protein intake [Citation46]. The contraindication of the role of protein intake in BP elevation or reduction could be related to the study population, age group, protein source and quality, and other adjusted confounding variables such as weight and gender. Furthermore, the meal timing and snack meal protein content could affect BP, as Berryman et al. (2021) revealed. They found that protein intake at breakfast was inversely associated with DBP (−0.39 ± 0.10 mmHg, P = 0.0003) and SBP (−0.40 ± 0.13 mmHg, P = 0.0038). Moreover, Protein intake from snacks was inversely associated with DBP (−0.41 ± 0.09 mmHg, P < 0.0001) and CVD risk score (−0.0018 ± 0.0004, P = 0.0001) [Citation47].
In the current data, the prevalence of less than recommended intake was higher for the milk group in elevated BP participants. At the same time, less than recommended milk consumption increases the likelihood of elevated BP, and one of the most reported missed food groups was dairy products. The findings mentioned above are consistent with other studies’ findings. Hence, increased consumption of dairy products, low-fat/fat-free dairy products, low-fat/skimmed milk, and yogurt were linked to smaller annualized increases in SBP and a decreased risk of projected hypertension incidence. Additionally, it was discovered that changes in DBP were inversely correlated with total dairy and total low-fat/fat-free dairy consumption. Dairy consumption, when included in a nourishing and energy-balanced diet pattern, may help with BP regulation and postpone or prevent the onset of hypertension [Citation48]. On the other hand, Roy and colleagues found that ambulatory (24-hour) SBP did not differ substantially between the high-dairy and no-dairy groups. Moreover, DBP and pulse pressure did not significantly alter during the condition for office or ambulatory assessments. Compared to the no-dairy control, adding a single serving of full-fat dairy products to an adult’s regular diet has no hypotensive effects [Citation49]. Remarkably, milk and its derivatives are regarded as the primary source of calcium, which has become increasingly important when considering elevated BP. According to growing epidemiological and animal research, a low calcium diet raises blood pressure; calcium intake may lower BP via modulating intracellular calcium levels in vascular smooth muscle cells and vascular volume via the renin-angiotensin-aldosterone pathway [Citation50].
Notably, the fat intake was higher in the elevated BP group than in the normal BP group. Despite the lack of data regarding the types of fats consumed, many studies approved the association between elevated BP and fat intake. In Tamil Nadu, South India, the highest intake of fat was significantly correlated to the risk of abdominal obesity (P < 0.001), hypertension (P = 0.04), and impaired fasting glucose (P = 0.01) [Citation51]. Increasing dietary fat intake has been linked to overweight and obesity, a modifiable risk factor for elevated BP and hypertension [Citation1, Citation2, Citation52], as obesity is a common and rising problem in Jordan among different age groups. According to the BMI in Jordan, nearly 75% of men and women were overweight or obese, with the age-standardized prevalence of obesity being 60.4% for men and 75.6% for women; obesity also has been linked to various metabolic abnormalities in adults, such as higher probabilities of diabetes mellitus, elevated BP, hypertension, elevated triglycerides, and low levels of HDL cholesterol in adults [Citation53].
Regardless of BP status, most participants ate three meals and two snacks. However, participants with elevated BP tend to significantly consume less high prevalence of fast foods (1-5 times/week) (40.5%) and non-fast-food consumption (32.5%) as compared to normal BP participants (57.0% and 22.5%, respectively). Moreover, about half of elevated BP participants are morning eaters. Also, most of them consumed dinner between 6-9 PM, had a lower prevalence of night eating, and had a lower prevalence of skipping breakfast.
These results reflect awareness among elevated BP Jordanian adults regarding dietary practices and meal timing compared to healthy people despite the gap in the habitual food intake from different recommended food groups. In Rio de Janeiro, Brazil, it has been found that fewer meals per day (PR 1·72; 95% CI 1·21, 2·43) and overweight (PR 1·78; 95% CI 1·31, 2·20) remained significantly associated with increased BP [Citation21]. However, Ahadi et al. found that BP did not significantly differ between non-skipper students and breakfast skippers (P = 0.1). Non-skipping adolescents ate more fresh fruits, dried fruits, and vegetables and drank milk more frequently compared with breakfast skippers, while the skippers showed a higher intake of salty snacks, soft drinks, packed fruit juice, and fast foods (all P < 0.001) [Citation54]. Contrary, it has been found that subjects who skipped breakfast or the afternoon snack had a higher risk of poor cardiovascular health (OR= 1.613; 95%CI: 1.121–2.320; p = 0.010; and OR = 1.409; 95%CI:1.110–1.788, p = 0.005; respectively). Moreover, they identified three clusters of individuals based on eating habits; from cluster 1 to cluster 3, eating time interval and frequency increased, and this was associated with increases in cardiovascular health scores from 8.70 (SEM = 0.10) in cluster 1 and 9.06 (SEM = 0.08) in cluster 2 to 9.42 (SEM = 0.09) in cluster 3 (p-trend = 0.019). In contrast, higher eating time intervals and frequency may promote ideal cardiovascular health [Citation17]. Daily breakfast eaters were less likely to have CVD risk factors, including elevated serum low-density lipoprotein (LDL) cholesterol, low serum high-density lipoprotein (HDL) cholesterol, and elevated BP [Citation55]. SBP and DBP decreased only in the intermittent fasting studies that achieved 6% to 7% weight loss [Citation56, Citation57]. Ha and Song (2019) found that meal frequency was negatively correlated with the prevalence of abdominal obesity, high BP, and high triglycerides. Morning eating was linked to a lower prevalence of metabolic syndrome (odds ratio (OR), 0.73; 95% confidence interval (CI), 0.57-0.93 for men and OR, 0.69; 95% CI, 0.54-0.89 for women) compared to not eating in the morning, whereas night eating was linked to a 48% higher prevalence of metabolic syndrome (OR, 1.48; 95% CI, 1.15-1.90 in men only) [Citation24]. No doubt, eating behavior, meal timing, and frequency have improved among participants with elevated BP compared to those who have normal BP in the current findings. Still, there is a lack of knowledge and practices regarding variation in food group consumption, dietary recommendations, and nutritional awareness, which may contribute to elevated BP.
Our study is limited by the cross-sectional design, which disallowed a causality assumption. Instead of looking at the nutritional composition of each meal, this study focused on the expected daily dietary intake from each food group; it is important to look at the composition and quantity of food consumed in addition to the timing of meals. Further research on the effects of participant factors like gender and lifestyle is required to understand the relationship between meal timing and weight loss rate. In addition, it should be noted that the data in this study lacks information about physical activity, fat types, and salt intake. Finally, rather than differentiating between SBP and DBP, our analysis and discussion focused on the elevated BP.
5. Conclusion
Participants with elevated BP were more frequently to consume less fruit, milk, protein, and vegetables than recommended by MyPlate. Consuming more fruit than recommended decreases the risk of elevated BP. Additionally, most people with elevated BP eat three meals and two snacks daily while avoiding or eating fast food less frequently. Remarkably, half of the participants with elevated BP were considered morning eaters, and less than a fifth reported night eating. To be brief, Jordanian adults with elevated BP appear to have appropriate meal timing and eating habits as long as the daily MyPlate requirements for various food groups are not met.
Our study demonstrates the need to increase Jordanians’ understanding of the various food groups’ recommendations, especially for adults with elevated BP. Future public health campaigns may draw information from this study addressing Jordanians’ eating habits and dietary behaviors with elevated BP. Given the rising prevalence of BP in Jordan, it should be emphasized how essential it is to examine the influence of weight status and various lifestyles. Therefore, additional research related to the current hypothesis of better nutrition related to elevated BP may be tested in an intervention study - randomizing half of their people with elevated BP to a healthy intervention is advised.
Declarations
Source of Support
None.
Authors Declaration
The authors declare no conflict of interest.
Ethics approval
The study protocol was reviewed and approved by the institutional review board of The Hashemite University (No.19/1/2022/2023) and Jordan Ministry of Health (MBA/20219).
Consent to participate
All participants were informed about the study objectives at the beginning of the questionnaire, then they expressed their informed consent to participate, and their data were anonymous.
Authors’ contribution
Lana M. Agraib conceived the research idea, data analysis, and manuscript preparation. Buthaina Alkhatib conceived the research idea and prepared the manuscript. Islam Al-Shami conceived the research idea, preparation, and overall scientific management and participated in manuscript preparation and data collection. All authors critically revised the manuscript, approved the final version to be published, and agreed to be accountable for all aspects of the work.
List of Abbreviations
| BP | = | blood pressure |
| CVD | = | cardiovascular diseases |
| DASH | = | dietary approaches to stop hypertension |
| DBP | = | diastolic blood pressure |
| NCD | = | non-communicable diseases |
| SBP | = | systolic blood pressure |
Supplemental Material
Download MS Word (16.7 KB)Acknowledgment
We introduce a great thanks to the study participants.
Additional information
Funding
References
- Drozdz D, Alvarez-Pitti J, Wójcik M, et al. Obesity and cardiometabolic risk factors: from childhood to adulthood. Nutrients. 2021;13(11):1. doi: 10.3390/nu13114176.
- Mills K, Stefanescu A, He J. The global epidemiology of hypertension Katherine. Physiol Behav. 2016;176:139–13.
- Zhou B, Perel P, Mensah GA, et al. Global epidemiology, health burden and effective interventions for elevated blood pressure and hypertension. Nature Reviews Cardiology. 2021;18(11):785–802. doi: 10.1038/s41569-021-00559-8.
- Kontis V, Mathers CD, Rehm J, et al. Contribution of six risk factors to achieving the 25 × 25 non-communicable disease mortality reduction target: a modelling study. The Lancet. 2014;384(9941):427–37. doi: 10.1016/S0140-6736(14)60616-4.
- WHO. World Health Organization, report on the global tobacco epidemic, 2013: enforcing bans on tobacco advertising, promotion and sponsorship: World Health Organization; 2013.
- Vasan RS, Larson MG, Leip EP, et al. Impact of high-normal blood pressure on the risk of cardiovascular disease. New England journal of medicine. 2001;345(18):1291–7. doi: 10.1056/NEJMoa003417.
- Cui Y, Cai T, Zhou Z, et al. Health effects of alternate-day fasting in adults: a systematic review and meta-analysis. Frontiers in nutrition. 2020:256. doi: 10.3389/fnut.2020.586036.
- Nicoll R, Henein MY. Caloric restriction and its effect on blood pressure, heart rate variability and arterial stiffness and dilatation: a review of the evidence. International journal of molecular sciences. 2018;19(3):751. doi: 10.3390/ijms19030751.
- Cicero AF, Veronesi M, Fogacci F. Dietary intervention to improve blood pressure control: beyond salt restriction. High Blood Pressure & Cardiovascular Prevention. 2021:1–7. doi: 10.1007/s40292-021-00474-6.
- Jafari S, Hezaveh E, Jalilpiran Y, et al. Plant-based diets and risk of disease mortality: a systematic review and meta-analysis of cohort studies. Critical reviews in food science and nutrition. 2022;62(28):7760–72. doi: 10.1080/10408398.2021.1918628.
- Lee KW, Loh HC, Ching SM, et al. Effects of vegetarian diets on blood pressure lowering: a systematic review with meta-analysis and trial sequential analysis. Nutrients. 2020;12(6):1604. doi: 10.3390/nu12061604.
- Rodríguez-Ramírez S, Martinez-Tapia B, González-Castell D, et al. Westernized and diverse dietary patterns are associated with overweight-obesity and abdominal obesity in Mexican adult men. Frontiers in Nutrition. 2022;9:891609. doi: 10.3389/fnut.2022.891609.
- Flack JM, Adekola B. Blood pressure and the new ACC/AHA hypertension guidelines. Trends in cardiovascular medicine. 2020;30(3):160–4. doi: 10.1016/j.tcm.2019.05.003.
- Dashti HS, Gómez-Abellán P, Qian J, et al. Late eating is associated with cardiometabolic risk traits, obesogenic behaviors, and impaired weight loss. The American journal of clinical nutrition. 2021;113(1):154–61. doi: 10.1093/ajcn/nqaa264.
- St-Onge M-P, Ard J, Baskin ML, et al. Meal timing and frequency: implications for cardiovascular disease prevention: a scientific statement from the American Heart Association. Circulation. 2017;135(9):e96–e121. doi: 10.1161/CIR.0000000000000476.
- da Cunha NB, Teixeira GP, Rinaldi AEM, et al. Late meal intake is associated with abdominal obesity and metabolic disorders related to metabolic syndrome: a chrononutrition approach using data from nhanes 2015-2018. Clinical Nutrition. 2023.
- Maugeri A, Kunzova S, Medina-Inojosa J, et al. Association between eating time interval and frequency with ideal cardiovascular health: Results from a random sample Czech urban population. Nutrition, Metabolism and Cardiovascular Diseases. 2018;28(8):847–55. doi: 10.1016/j.numecd.2018.04.002.
- Watanabe Y, Saito I, Henmi I, et al. Skipping breakfast is correlated with obesity. Journal of Rural Medicine. 2014;9(2):51–8. doi: 10.2185/jrm.2887.
- Shimizu H, Hanzawa F, Kim D, et al. Delayed first active-phase meal, a breakfast-skipping model, led to increased body weight and shifted the circadian oscillation of the hepatic clock and lipid metabolism-related genes in rats fed a high-fat diet. PLoS One. 2018;13(10):e0206669. doi: 10.1371/journal.pone.0206669.
- Makarem N, Sears DD, St‐Onge MP, et al. Variability in daily eating patterns and eating jetlag are associated with worsened cardiometabolic risk profiles in the American Heart Association Go Red for women strategically focused research network. Journal of the American Heart Association. 2021;10(18):e022024. doi: 10.1161/JAHA.121.022024.
- Domingos TB, Pereira AF, Yokoo EM, et al. Low fruit consumption and omission of daily meals as risk factors for increased blood pressure in adults. British Journal of Nutrition. 2016;116(4):683–91. doi: 10.1017/S0007114516002397.
- Alkhulaifi F, Darkoh C. Meal timing, meal frequency and metabolic syndrome. Nutrients. 2022;14(9):1719. doi: 10.3390/nu14091719.
- Boege HL, Bhatti MZ, St-Onge M-P. Circadian rhythms and meal timing: impact on energy balance and body weight. Current opinion in biotechnology. 2021;70:1–6. doi: 10.1016/j.copbio.2020.08.009.
- Ha K, Song Y. Associations of meal timing and frequency with obesity and metabolic syndrome among Korean adults. Nutrients. 2019;11(10):2437. doi: 10.3390/nu11102437.
- Nieman DC, Lee R. Nutritional assessment: McGraw-Hill Education United States of America; 2019.
- WHO. World Health Organizatio, Obesity: preventing and managing the global epidemic. Report of a WHO consultation 2000 [Available from: https://apps.who.int/iris/handle/10665/42330
- Kobayashi T, Kamimura M, Imai S, et al. Reproducibility and validity of the food frequency questionnaire for estimating habitual dietary intake in children and adolescents. Nutrition journal. 2011;10(1):1–12. doi: 10.1186/1475-2891-10-27.
- Babić D, Sindik J, Missoni S. Development and validation of a self-administered food frequency questionnaire to assess habitual dietary intake and quality of diet in healthy adults in the Republic of Croatia. Collegium antropologicum. 2014;38(3):1017–26.
- Al Hourani H, Alkhatib B, Al-Shami I, et al. Energy and macronutrient intakes in Jordan: a population study. Scientific Reports. 2023;13(1):12736. doi: 10.1038/s41598-023-39900-1.
- Khraiwesh H, Alkhatib B, Hasan H, et al. The impact of sleep quality, meal timing, and frequency on diet quality among remote learning university students during the COVID-19 pandemic. 2023.
- Eguchi K, Kuruvilla S, Ogedegbe G, et al. What is the optimal interval between successive home blood pressure readings using an automated oscillometric device? Journal of hypertension. 2009;27(6):1172. doi: 10.1097/hjh.0b013e32832a6e39.
- Mancia G, Fagard R, Narkiewicz K, et al. 2013 ESH/ESC guidelines for the management of arterial hypertension: the Task Force for the Management of Arterial Hypertension of the European Society of Hypertension (ESH) and of the European Society of Cardiology (ESC). European heart journal. 2013;34(28):2159–219.
- Freestone S, Ramsay LE. Effect of coffee and cigarette smoking on the blood pressure of untreated and diuretic-treated hypertensive patients. The American journal of medicine. 1982;73(3):348–53. doi: 10.1016/0002-9343(82)90725-2.
- Shukuri A, Tewelde T, Shaweno T. Prevalence of old age hypertension and associated factors among older adults in rural Ethiopia. Integrated blood pressure control. 2019:23–31. doi: 10.2147/IBPC.S212821.
- CaseyJrDE, Thomas RJ, Bhalla V, et al. 2019 AHA/ACC clinical performance and quality measures for adults with high blood pressure: a report of the American College of Cardiology/American Heart Association Task Force on Performance Measures. Circulation: Cardiovascular Quality and Outcomes. 2019;12(11):e000057. doi: 10.1161/HCQ.0000000000000057.
- Kimani-Murage EW, Muthuri SK, Oti SO, et al. Evidence of a double burden of malnutrition in urban poor settings in Nairobi, Kenya. PloS one. 2015;10(6):e0129943. doi: 10.1371/journal.pone.0129943.
- Gibbs J, Gaskin E, Ji C, et al. The effect of plant-based dietary patterns on blood pressure: a systematic review and meta-analysis of controlled intervention trials. Journal of hypertension. 2021;39(1):23–37. doi: 10.1097/HJH.0000000000002604.
- Sun B, Shi X, Wang T, et al. Exploration of the association between dietary fiber intake and hypertension among US adults using 2017 American College of Cardiology/American Heart Association Blood Pressure Guidelines: NHANES 2007–2014. Nutrients. 2018;10(8):1091. doi: 10.3390/nu10081091.
- Jiang W, Wei H, He B. Dietary flavonoids intake and the risk of coronary heart disease: a dose-response meta-analysis of 15 prospective studies. Thrombosis research. 2015;135(3):459–63. doi: 10.1016/j.thromres.2014.12.016.
- Clark JL, Zahradka P, Taylor CG. Efficacy of flavonoids in the management of high blood pressure. Nutrition reviews. 2015;73(12):799–822. doi: 10.1093/nutrit/nuv048.
- Kimani S, Mirie W, Chege M, et al. Association of lifestyle modification and pharmacological adherence on blood pressure control among patients with hypertension at Kenyatta National Hospital, Kenya: a cross-sectional study. BMJ open. 2019;9(1):e023995. doi: 10.1136/bmjopen-2018-023995.
- Rheinschild E. Fruit and veggies rich in potassium may be key to lowering blood pressure. New study by Keck School of Medicine of USC researcher links increased dietary potassium with lower hypertension. 2017.
- Buendia JR, Bradlee ML, Singer MR, et al. Diets higher in protein predict lower high blood pressure risk in Framingham Offspring Study adults. American journal of hypertension. 2015;28(3):372–9. doi: 10.1093/ajh/hpu157.
- Coelho-Júnior HJ, Aguiar SdS, Gonçalves IdO, et al. High Protein Intake at Lunch Is Negatively Associated with Blood Pressure in Community-Dwelling Older Adults: A Cross-Sectional Study. Nutrients. 2023;15(5):1251. doi: 10.3390/nu15051251.
- Bergia RE, Campbell WW, Roseguini BT, et al. A high-protein meal does not improve blood pressure or vasoactive biomarker responses to acute exercise in humans. Nutrition Research. 2020;81:97–107. doi: 10.1016/j.nutres.2020.08.001.
- Altorf-van der Kuil W, Engberink MF, Vedder MM, et al. Sources of dietary protein in relation to blood pressure in a general Dutch population. PloS one. 2012;7(2):e30582. doi: 10.1371/journal.pone.0030582.
- Berryman CE, Lieberman HR, Fulgoni III VL, et al. Greater protein intake at breakfast or as snacks and less at dinner is associated with cardiometabolic health in adults. Clinical nutrition. 2021;40(6):4301–8. doi: 10.1016/j.clnu.2021.01.018.
- Wang H, Fox CS, Troy LM, et al. Longitudinal association of dairy consumption with the changes in blood pressure and the risk of incident hypertension: the Framingham Heart Study. British Journal of Nutrition. 2015;114(11):1887–99. doi: 10.1017/S0007114515003578.
- Roy S, Lapierre S, Baker B, et al. High dietary intake of whole milk and full-fat dairy products does not exert hypotensive effects in adults with elevated blood pressure. Nutrition research. 2019;64:72–81. doi: 10.1016/j.nutres.2019.01.003.
- Villa-Etchegoyen C, Lombarte M, Matamoros N, et al. Mechanisms involved in the relationship between low calcium intake and high blood pressure. Nutrients. 2019;11(5):1112. doi: 10.3390/nu11051112.
- Narasimhan S, Nagarajan L, Vaidya R, et al. Dietary fat intake and its association with risk of selected components of the metabolic syndrome among rural South Indians. Indian Journal of Endocrinology and Metabolism. 2016;20(1):47. doi: 10.4103/2230-8210.172248.
- Jiang SZ, Lu W, Zong XF, et al. Obesity and hypertension. Experimental and therapeutic medicine. 2016;12(4):2395–9. doi: 10.3892/etm.2016.3667.
- Ajlouni K, Khader Y, Batieha A, et al. An alarmingly high and increasing prevalence of obesity in Jordan. Epidemiology and Health. 2020;42. doi: 10.4178/epih.e2020040.
- Ahadi Z, Qorbani M, Kelishadi R, et al. Association between breakfast intake with anthropometric measurements, blood pressure and food consumption behaviors among Iranian children and adolescents: the CASPIAN-IV study. Public health. 2015;129(6):740–7. doi: 10.1016/j.puhe.2015.03.019.
- Witbracht M, Keim NL, Forester S, et al. Female breakfast skippers display a disrupted cortisol rhythm and elevated blood pressure. Physiology & behavior. 2015;140:215–21. doi: 10.1016/j.physbeh.2014.12.044.
- Varady KA, Hoddy KK, Kroeger CM, et al. Determinants of weight loss success with alternate day fasting. Obesity research & clinical practice. 2016;10(4):476–80. doi: 10.1016/j.orcp.2015.08.020.
- Parvaresh A, Razavi R, Abbasi B, et al. Modified alternate-day fasting vs. calorie restriction in the treatment of patients with metabolic syndrome: A randomized clinical trial. Complementary therapies in medicine. 2019;47:102187. doi: 10.1016/j.ctim.2019.08.021.