
 ?Mathematical formulae have been encoded as MathML and are displayed in this HTML version using MathJax in order to improve their display. Uncheck the box to turn MathJax off. This feature requires Javascript. Click on a formula to zoom.
Abstract
Aim
The accumulation of uremic toxins, such as asymmetric dimethylarginine (ADMA), has emerged as one of the major cardiovascular disease-related risk factors in patients with end-stage renal disease (ESRD). Based on the low molecular weight of ADMA, hemodialysis (HD) should theoretically effectively remove ADMA. In this study, we investigated the clearance behavior of ADMA during high-flux HD.
Methods
Eight HD patients without residual renal function were included. Blood samples were collected at 0, 30, 60, 120 and 240 min after dialysis started, as well as 1 h and 48 h after dialysis. ADMA level was detected by HPLC-MS/MS. Herein, the ADMA level in blood cells and the ADMA protein binding rate were measured. Accordingly, the dialyzer extraction ratio was also determined.
Results
The reduction ratio (RR) of ADMA (corrected for hemoconcentration) was significantly lower, at only 37.21 ± 6.44%, than that of urea and creatinine (p < .05). Interestingly, its clearance from plasma was precipitous early in dialysis and became slowly from 60 to 240 min. Additionally, a greater inlet erythrocyte than plasma concentration was found for ADMA. The dialyzer extraction ratio was comparable between ADMA and creatinine or urea (83 ± 5% for ADMA vs. 84 ± 3% and 88 ± 2% for creatinine and urea, respectively; both p>.05). Urea and creatinine had a slight rebound ratio of less than 10% at 1 h after the completion of HD. In contrast, considerable rebound of approximately 30% was detected in ADMA.
Conclusion
This study suggests that ADMA may present a multicompartmental distribution that cannot be representatively reflected by the urea kinetics model.
Introduction
Cardiovascular disease (CVD) is the leading cause of mortality in end-stage renal disease (ESRD) patients with an incidence of 10–20 times higher than that in the general population [Citation1]. Traditional risk factors, including diabetes mellitus, hypertension, obesity, dyslipidemia, and smoking, do not completely account for the excess CVD in this patient group. Indeed, other factors, including the accumulation of uremic toxins, such as asymmetric dimethylarginine (ADMA), have emerged as major risk factors in patients with ESRD [Citation2–4].
Nitric oxide (NO) is derived from the metabolism of L-arginine [Citation5]. It is considered to play a protective role in the cardiovascular system because it inhibits vascular muscle cell proliferation and the adhesion of monocytes to the endothelium [Citation2]. The enzyme NO synthase (NOS) can be inhibited by endogenous methylarginines, and ADMA is considered to be one of these endogenous NOS inhibitors [Citation5]. Substantial evidence has shown that increased plasma concentration of ADMA is consistently related to cardiovascular complications in ESRD patients [Citation2,Citation6–8].
ADMA is a guanidino compounds with a low molecular weight of 202 Da, Theoretically, hemodialysis (HD) should be very effective in eliminating this endogenous NOS inhibitor in the blood. However, this may not be the case, as pointed out by many studies reporting an ADMA reduction ratio between 20 and 40% during maintenance HD [Citation9–12]. Eloot et al. [Citation13,Citation14] also demonstrated that the kinetic behavior of some small water-soluble guanidino molecules is different from that of urea during HD. In addition, it has beesuggested that [Citation15,Citation16] red blood cell (RBCs), which may act as modulators of the plasma ADMA level, cause the presence of substantial quantities of protein-incorporated ADMA.
To the best of our knowledge, the intradialytic kinetics of ADMA has not been thoroughly studied during high-flux HD. To gain better insights into the kinetics of ADMA as an intracellularly sequestered solute, we investigated the level and clearance behavior of ADMA in stable maintenance HD patients. Erythrocytes are virtually the only easily accessible intracellular compartment, and the compartmental distribution between plasma and erythrocytes was examined in this study. We elucidated that the clearance behavior of ADMA may differ from that of urea.
Materials and methods
Patients and dialysis prescription
A total of 8 stable maintenance HD patients without residual renal function were included in this study. Patients less than 18 years old, with diabetes mellitus, systemic lupus erythematosus or hemolytic disease, with less than 3 months on HD, with hospitalization or an acute illness within 1 month, with changes in the dialysis prescription within 1 month before sample collection, and treated with erythropoietin or estrogen within the last 3 weeks were excluded. All patients had been regularly dialyzed three times a week with high-flux dialyzers (FX60, Fresenius) for 4 h per session. A delivered spKt/V dose reached at least 1.4 in the last 3 months, as calculated by the Daurgirdas’ second-generation equation [Citation17]. A constant dialysate flow rate of 500 mL/min and blood flow rate of 250 mL/min were applied for a total treatment of 4 h. All subjects were provided with a standard low-protein diet before the onset of the investigative dialysis treatment. During the investigative dialysis session and in the subsequent one hour, patients remained in bed, and no food or beverage were allowed. The investigative dialysis treatment was defined as the first HD session after the longest dialysis interval of a week [Citation18,Citation19]. This study was undertaken in accordance with the Helsinki Declaration and was approved by the hospital ethical committee, and written informed consent was obtained from all subjects and the clinical trial was registered at http://www.chictr.org.cn/index.aspx (ChiCTR1800015368).
Sample collection and analysis
The predialysis blood sample was obtained from arteriovenous fistula before the infusion of saline or heparin and taken from the inlet and outlet blood lines 30, 60, 120 and 240 min after starting dialysis while stopping ultrafiltration and maintaining the blood pump. Venous blood was taken from the arm of contralateral arteriovenous fistula 1 h after the end of dialysis. It was assumed that 1 h was sufficient for the equilibration of fluid between the plasma and the remainder of the extracellular compartment. An additional blood sample was obtained immediately prior to the next HD session (∼48 h later) in patients. Two-milliliter blood samples were immediately centrifuged at 3000 rpm for 10 min, after which the plasma was stored at −80 °C until analysis. And additional 1-mL blood sample was then subjected to lysis by three freeze-thaw cycles with 1 min of freezing in liquid nitrogen and 5 min of thawing in a 37 °C water bath. The blood lysis appeared complete as judged by the minimal to absent sediment using hematoxylin and eosin staining.
The concentrations of urea, creatinine, albumin, hemoglobulin were determined by an automatic biochemistry analyzer. Hematocrit was measured using freshly drawn blood at various time points during and after HD. To correct plasma solutes level due to hemoconcentration by ultrafiltration, the ratio of serum albumin after versus before dialysis was calculated [Citation20].
Sample ADMA level was measured by high-performance liquid chromatography coupled with tandem mass spectrometry (HPLC-MS/MS) [Citation21,Citation22]. For whole blood ADMA level determination, the whole-blood lysate was thawed, 50 µL of the sample was transferred to an Eppendorf tube, and 50 µL of 10% trichloroacetic acid was added for deproteinization. The sample was left on ice for 10 min and then centrifuged. The supernatant was used for determination of the whole-blood ADMA concentration. The ADMA concentration in blood cell (basically erythrocytes) was determined after subtraction of the plasma contents from the whole-blood contents, taking into account the volume occupied by packed cells, which was based on instantaneous hematocrit determinations, as follows [Citation19].
To detect the binding state of ADMA to plasma protein, the protein binding rate was measured (n = 23). Briefly, the plasma were introduced into the ultra-centrifugal filter of a 10-kD molecular weight cutoff membrane (Pall, USA) and then centrifuged [Citation23]. And the protein binding was also determined by means of equilibrium dialysis against phosphate buffer PH = 7.4 [Citation24].
Calculation of dialyzer extraction ratio
To determine the removal capacity of the solutes through dialyzer, the clearance by dialysis irrespective of the blood flow rate was assessed. From the inlet and outlet plasma concentrations, Cplasma inlet (Cpi) and Cplasma outlet (Cpo), the dialyzer extraction ratio (E) was calculated considering diffusion [Citation14]:
Reduction ratio
Analogous to the definition for the urea reduction ratio, the ADMA reduction ratio (RR) can be defined as a function of the predialysis (Cpre) and postdialysis (Cpost) concentrations [Citation14]. Cpost was corrected using the change in serum albumin.
Effective solute removal
Due to redistribution in the body compartments following dialysis, the effective reduction ratio (RReff) will be smaller than calculated with RR if a multi-compartmental distribution is present [Citation13]. One hour was considered to be sufficient for reequilibration across the various compartments of the body. Additionally, measuring solute level 60 min postdialysis would most “truly” reflect the solute clearance. The concentration at 60 min postdialysis (C60min post) allowed calculating the RReff for the different solutes [Citation13]. C60min post was corrected using the change in serum albumin.
Statistical analysis
Data were described as mean ± standard deviations. Repeated measurements were tested for statistical significance using ANOVA and the Scheffe’F test. Correlations between parameters were investigated by performing Pearson correlation analysis. Statistical significance was accepted for P less than 0.05. SPSS version 16.0 for windows software (SPSS Inc. Chicago, IL, USA.) was used for the statistical analysis.
Results
Patients’ demographics and hemodialysis characteristics
Eight male patients were included with the age of 50.71 ± 9.80 years old and average dialysis vintage of 128.86 ± 32.86 months. The causes of ESRD were that glomerulonephritis in 5 cases and unknown in the other 3 cases. The main characteristics of the patients and their dialysis sessions are shown in .
Table 1. Patient demographics and hemodialysis characteristics.
Plasma concentration of different compounds and erythrocyte level of ADMA
The concentrations of the studied compounds in plasma and erythrocyte were determined in various time points throughout dialysis (). In comparison to the predialysis inlet concentration, the plasma urea and creatinine levels continued to decrease over the course of dialysis, whereas there were no significant changes in the plasma inlet ADMA level from 60 min after starting dialysis (p>.05) (). Notably, the change in levels between the inlet and outlet was almost consistent for plasma urea, creatinine, and ADMA. A higher inlet erythrocyte than plasma concentration was found for ADMA. The erythrocyte inlet concentration did not alter significantly over time for ADMA, whereas there was a difference for urea (p < .05) ().
Table 2. Plasma and erythrocyte concentration at different times during and after dialysis.
Comparison of the ADMA and BUN solute clearance
Applying the solute concentration at 1 h postdialysis, the RReff values (corrected for hemoconcentration) of ADMA (17.60 ± 5.50%) were significantly lower than urea (71.33 ± 2.38%) and creatinine (67.41 ± 4.52%) (both p < .05). A compartmental distribution could be indicated by the finding that there was a significant difference between the RR and RReff values for urea and ADMA (both p < .05) (). Notably, ADMA was almost entirely free and not protein bound (89.79 ± 7.43%). The result was not different when using the equilibrium dialysis method to determine the protein-bound fraction.
Table 3. Reduction Ratio (RR) and effective reduction ratio (RReff) for the different compounds (corrected for hemoconcentration).
The tendency of solute clearance in plasma can be more clearly observed when depicted as a line chart (). The urea and creatinine levels declined in an expected asymptotic manner during HD therapy. During the first hour of dialysis, the slope of ADMA in plasma was precipitous, similar to that for urea, and then became slower from 60 to 240 min ().
Figure 1. The mean solute levels of plasma ADMA and urea throughout the course of HD, 60 min postdialysis and prior to the next HD treatment (values are expressed as a fraction of the predialysis, initial plasma level). *p < .05 compared with the initial fraction of the predialysis level.
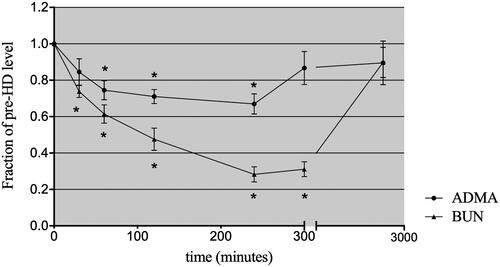
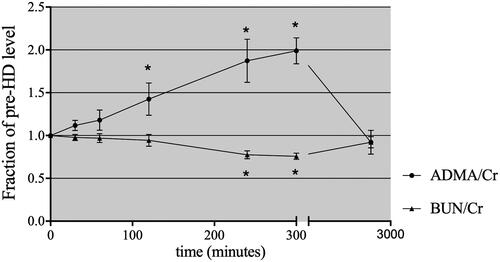
A slight rebound ratio less than 10% for urea and creatinine was detected at 1 h after completion of HD. The urea and creatinine levels remained low, at 31.59 ± 3.63% and 36.67 ± 4.83% of the predialysis values, respectively. In contrast, the ADMA level at 1 h postdialysis was significantly higher than that at the end of dialysis, at 86.68 ± 0.09% of the initial level, with considerable rebound of approximately 30%. At the beginning of the next dialysis session (48 h postdialysis), the urea and ADMA levels had returned to approximately 90% of the predialysis values (). When the level of ADMA and urea was expressed relative to the serum creatinine concentration, the clearance behavior of ADMA and urea could be observed more clearly (). The concentration of ADMA in erythrocytes remained constant after dialysis ().
Figure 2. Time course of plasma ADMA/creatinine ratios during HD, 60 min postdialysis and prior to the next HD treatment. *p < .05 compared with the initial fraction of the predialysis level.
Analysis showed that predialysis plasma ADMA level was positively correlated with hemoglobulin level (r = 0.779, p < .05) and erythrocyte ADMA level (r = .792, p < .05), whereas no correlation was found between predialysis plasma levels of ADMA and albumin (p>.05).
Solute removal by the dialyzer
To assess the dialyzer solute removal efficiency during dialysis, the extraction ratio was calculated for different time points during dialysis. ADMA, creatinine and urea, defined as small soluble molecules, exhibited high dialyzer extraction ratio (the mean value of all time points: 83 ± 5% for ADMA vs. 84 ± 3% and 88 ± 2% for creatinine and urea, respectively; p>.05 for both ADMA vs. urea and ADMA vs. creatinine). This suggests that the dissimilarity in kinetic behavior among the different solutes cannot be explained by a difference in dialyzer extraction ratio during dialysis.
Discussion
The present study aimed to evaluate the behavior of ADMA in stable HD and to compare it with a standard marker of dialysis adequacy, urea. Our study shows that the clearance of ADMA is significantly lower than that of urea and creatinine, and that the ADMA level rebounds to high plasma levels postdialysis. ADMA shows behaviors that are not well predicted by the behavior of urea despite being comparable in terms of a low molecular weight.
The dialyzer extraction ratio of ADMA did not differ from that of urea or creatinine and maintained a high value of approximately 83% during HD. As a consequence, the dissimilarity in clearance behavior between ADMA and urea and creatinine cannot be explained by inconsistent dialyzer extraction ratio. Kielstein et al. [Citation25] found that removal of ADMA in standard dialysis was hampered because the compound is protein bound. In our study, we found that the ADMA protein binding rate was only approximately 10–19% using the multiple detection method, which is consistent with the findings reported by Tsikas et al. [Citation26,Citation27]. More likely, ADMA removal is hindered by complex kinetics and distribution.
In our study, dialytic removal resulted in an early and profound decrease in the plasma ADMA level at most during the first hour of dialysis. This indicated that only a very small amount of ADMA was present in the easily accessible plasma compartment. High differences in the ADMA concentration were detected between erythrocyte and plasma. This suggests that ADMA mainly existed intracellularly and was hardly removed, resulting in a smaller RReff. Our data showed that plasma ADMA level immediately increased at 1 h after dialysis compared to that at the end of dialysis. The hemoconcentration did not play a role in this increase because there was no significant change in the total protein level during HD (data not shown). Others have noted similar plasma ADMA postdialytic rebound [Citation28,Citation29]. This large degree of rebound and the data presented suggests its kinetic behavior is different from that of urea. These data elicit the hypothesis that reequilibration of the plasma with other compartments, such as erythrocytes, is considered more likely to be responsible for the rebound effect, which contributes to the low effective removal of ADMA during HD.
For such sequestered toxin, the duration and frequency of dialysis may need to be increased to facilitate its whole-body elimination. Such seems to be the case with phosphate, another intracellular solute, slow nocturnal dialysis or short daily dialysis is highly effective in controlling serum phosphate [Citation30–32]. Other study has found that peritoneal dialysis might be more effective on ADMA removal than HD and hemodiafiltration [Citation33]. Finally, it should be noted that the presented data are based on the results of a single dialysis session for each investigated time schedule with a limited number of patients. Nevertheless, we found that ADMA behaved differently from solutes with comparable molecular weight, such as creatinine and urea, during HD.
In conclusion, the present study shows the removal behavior of ADMA during and after high-flux HD and suggests that not all changes in small soluble molecular concentrations in uremia and dialysis are representatively reflected by the kinetics of urea. Since increased ADMA blood concentrations are associated with cardiovascular complications in patients with ESRD, further understanding the dynamics of ADMA clearance in HD patients may help identify new removal strategies and improve the outcome of ESRD.
Acknowledgement
We are extremely grateful to the participants of our study.
Disclosure statement
No potential conflict of interest was reported by the author(s).
Additional information
Funding
References
- Collins AJ, Foley RN, Chavers B, et al. USRDS 2011 ADR: ESRD providers. Am J Kidney Dis. 2012;59:A7.
- Tripepi G, Raso FM, Sijbrands E, et al. Inflammation and asymmetric dimethylarginine for predicting death and cardiovascular events in ESRD patients. Clin J Am Soc Nephrol. 2011;6(7):1714–1721.
- Zoccali C, Bode-Boger S, Mallamaci F, et al. Plasma concentration of asymmetrical dimethylarginine and mortality in patients with end-stage renal disease: a prospective study. Lancet. 2001;358(9299):2113–2117.
- Zoccali C, Mallamaci F, Tripepi G. Traditional and emerging cardiovascular risk factors in end-stage renal disease. Kidney Int Suppl. 2003; 63:S105–S110.
- Teerlink T. ADMA metabolism and clearance. Vasc Med. 2005;10:S73–S81.
- Zoccali C, Benedetto FA, Maas R, CREED Investigators, et al. Asymmetric dimethylarginine, C-reactive protein, and carotid intima-media thickness in end-stage renal disease. J Am Soc Nephrol. 2002;13(2):490–496.
- Shafi T, Hostetter TH, Meyer TW, et al. Serum asymmetric and symmetric dimethylarginine and morbidity and mortality in hemodialysis patients. Am J Kidney Dis. 2017;70(1):48–58.
- Zhou S, Zhu Q, Li X, et al. Asymmetric dimethylarginine and all-cause mortality: a systematic review and meta-analysis. Sci Rep. 2017;7:44692.
- Kalousova M, Kielstein JT, Hodkova M, et al. No benefit of hemodiafiltration over hemodialysis in lowering elevated levels of asymmetric dimethylarginine in ESRD patients. Blood Purif. 2006;24(5–6):439–444.
- Grooteman MP, Wauters IM, Teerlink T, et al. Plasma dimethylarginine levels in chronic hemodialysis patients are independent of the type of dialyzer applied. Blood Purif. 2007;25(3):281–289.
- Mochizuki S, Ono J, Yada T, et al. Systemic nitric oxide production rate during hemodialysis and its relationship with nitric oxide-related factors. Blood Purif. 2005;23(4):317–324.
- Vanholder R, Pletinck A, Schepers E, et al. Biochemical and clinical impact of organic uremic retention solutes: a comprehensive update. Toxins (Basel). 2018;10(1):33.
- Eloot S, Torremans A, Smet R, et al. Kinetic behavior of urea is different from that of other water-soluble compounds the case of the guanidino compounds. Kidney Int. 2005;67(4):1566–1575.
- Eloot S, Torremans A, De Smet R, et al. Complex compartmental behavior of small water-soluble uremic retention solutes: evaluation by direct measurements in plasma and erythrocytes. Am J Kidney Dis. 2007;50(2):279–288.
- Billecke SS, Kitzmiller LA, Northrup JJ, et al. Contribution of whole blood to the control of plasma asymmetrical dimethylarginine. Am J Physiol Heart Circ Physiol. 2006;291(4):H1788–96.
- Billecke SS, D'Alecy LG, Platel R, et al. Blood content of asymmetric dimethylarginine: new insights into its dysregulation in renal disease. Nephrol Dial Transplant. 2008;24(2):489–496.
- Daugirdas JT. Second generation logarithmic estimates of single-pool variable volume Kt/V: an analysis of error. J Am Soc Nephrol. 1993;4(5):1205–1213.
- Polinder-Bos HA, Garcia DV, Kuipers J, et al. Hemodialysis induces an acute decline in cerebral blood flow in elderly patients. J Am Soc Nephrol. 2018;29(4):1317–1325.
- Ponda MP, Quan Z, Melamed ML, et al. Methylamine clearance by haemodialysis is low. Nephrol Dial Transplant. 2010;25(5):1608–1613.
- Montagnana M, Lippi G, Tessitore N, et al. Effect of hemodialysis on traditional and innovative cardiac markers. J Clin Lab Anal. 2008;22(1):59–65.
- Schwedhelm E, Maas R, Tan-Andresen J, et al. High-throughput liquid chromatographic-tandem mass spectrometric determination of arginine and dimethylated arginine derivatives in human and mouse plasma. J Chromatogr B Analyt Technol Biomed Life Sci. 2007;851(1–2):211–219.
- Kalantari S, Nafar M. An update of urine and blood metabolomics in chronic kidney disease. Biomark Med. 2019;13(7):577–597.
- Meyer TW, Leeper EC, Bartlett DW, et al. Increasing dialysate flow and dialyzer mass transfer area coefficient to increase the clearance of protein-bound solutes. J Am Soc Nephrol. 2004;15(7):1927–1935.
- Curran RE, Claxton CR, Hutchison L, et al. Control and measurement of plasma pH in equilibrium dialysis: influence on drug plasma protein binding. Drug Metab Dispos. 2011;39(3):551–557.
- Kielstein JT, Boger RH, Bode-Boger SM, et al. Low dialysance of asymmetric dimethylarginine (ADMA)-in vivo and in vitro evidence of significant protein binding. CN. 2004;62(10):295–300.
- Tsikas D, Engeli S, Beckmann B, et al. Asymmetric dimethylarginine (ADMA) is present in plasma proteins of healthy subjects at the low nmol-per-g-level. Nitric Oxide. 2010;22(4):316–317.
- Tsikas D, Beckmann B. Albumin from human serum does not contain asymmetric dimethylarginine (ADMA). Clin Biochem. 2009;42(16–17):1739–1740.
- Rifai K, Bode-Boeger SM, Martens-Lobenhoffer J. Removal of asymmetric dimethylarginine during artificial liver support using fractionated plasma separation and adsorption. Scand J Gastroenterol. 2010;45(9):1110–1115.
- MacAllister RJ, Rambausek MH, Vallance P, et al. Concentration of dimethyl-L-arginine in the plasma of patients with end-stage renal failure. Nephrol Dial Transplant. 1996;11(12):2449–2452.
- Achinger SG, Ayus JC. The role of daily dialysis in the control of hyperphosphatemia. Kidney Int Suppl. 2005;67:S28–S32.
- Leypoldt JK. Kinetics of beta2-microglobulin and phosphate during hemodialysis: effects of treatment frequency and duration. Semin Dial. 2005;18(5):401–408.
- Mucsi I, Hercz G, Uldall R, et al. Control of serum phosphate without any phosphate binders in patients treated with nocturnal hemodialysis. Kidney Int. 1998;53(5):1399–1404.
- Zhang DL, Liu J, Liu S, et al. The differences of asymmetric dimethylarginine removal by different dialysis treatments. Ren Fail. 2010;32(8):935–940.