
Abstract
Objectives
The goal of our study was to evaluate the potential role of sTNF-RI as a biomarker of renal involvement in SLE patients and active SLE.
Methods
The study sample consisted of two cohorts. The discovery cohort included 16 SLE patients without renal involvement (non-LN), 60 lupus nephritis (LN) patients and 21 healthy controls (HCs) and the replication cohort included 18 SLE non-LN patients, 116 LN patients and 36 HCs.
Results
The sTNF-RI levels differed significantly in the discovery cohort. The plasma sTNF-RI levels were higher in LN patients than in non-LN patients (p = .009) and HCs (p = 4 × 10⁻⁶). Plasma sTNF-RI levels were significantly higher in non-LN patients than in HCs (p = .03). The finding was confirmed in independent replication cohort (LNs vs. non-LN, p = 4.053 × 10⁻⁷; LNs vs. HCs, p = 2.395 × 10⁻¹⁸; non-LN vs. HCs, p = 2.51 × 10⁻⁴). The plasma sTNF-RI levels were associated with disease activity, renal function in SLE patients and urine protein in LN patients. The multivariate analysis revealed that high sTNF-RI was an independent risk factor for renal involvement. The multivariate logistic regression results suggested that high TNF-RI, high systolic blood pressure, high serum creatinine, low C4 and positive anti-dsDNA were independent risks of active SLE patients. A nomogram was constructed based on the results of multivariate logistic regression analysis and it was practical in predicting the risk of the active SLE patients. Immunohistochemistry suggested that the expression of TNF-RI in the kidney was increased.
Conclusions
Plasma sTNF-RI might be a good biomarker of renal involvement and disease activity in SLE patients.
1. Introduction
Systemic lupus erythematosus (SLE) is an autoimmune disorder that is characterized by the disruption of immune tolerance and autoantibody formation. It can involve many organs and systems, including the skin, kidney and hematopoietic system [Citation1]. Lupus nephritis (LN) is a common complication and is associated with a poor prognosis in SLE. Asians reportedly have a higher incidence of LN [Citation2], and the early diagnosis of LN is critical for timely management and patient survival. Kidney biopsy is the gold standard for diagnosing LN, but it is invasive [Citation3,Citation4]. Currently, renal involvement in SLE is usually evaluated by urinalysis or by measuring serum creatinine or eGFR. Therefore, finding earlier biomarkers is very important for the timely prediction of renal impairment in SLE patients.
Cytokines, particularly tumor necrosis factor-α (TNF-α), play an essential role in the pathogenesis of SLE. Previous studies had shown that SLE patients had high levels of serum TNF-α, and TNF-α was correlated with disease activity in SLE [Citation5]. Increased renal expression of TNF-α was observed in lupus mice. Tumor necrosis factor receptor I (TNF-RI), the classic ligand for TNF-α, is correlated with chronic diseases, including autoimmune diseases. TNF-RI is ubiquitously expressed on almost all cell types in humans and plays an important role in proinflammatory effects. Moreover, it can activate signaling pathways that lead to cell death [Citation6,Citation7].
Accumulating evidence indicates the involvement of TNF-RI in the development of SLE. Sharapova et al. reported that autoantibodies from SLE patients interact with TNF-RI, thereby inducing murine fibroblast cell death [Citation8]. In a retrospective study of Caucasians, soluble TNF-RI (sTNF-RI) was identified as a potential marker to distinguish SLE patients without renal impairment from LN patients [Citation9].
The goal of our study was to evaluate the potential value of sTNF-RI as a biomarker for the prediction of renal involvement and renal function in Chinese SLE patients.
2. Materials and methods
2.1. Study population
SLE patients who were hospitalized at the Nephrology Hospital of the First Affiliated Hospital of Zhengzhou University between July 2019 and February 2021 were enrolled. Patients with tumors, pregnancy or other autoimmune diseases were excluded. The study sample consisted of two cohorts. The discovery cohort included 60 LN patients, 16 SLE patients without renal involvement (non-LN) and 21 healthy controls (HCs). The replication cohort included 116 LN patients, 18 non-LN patients and 36 HCs. All of the SLE patients met the American College of Rheumatology (ACR) revised criteria [Citation10] as updated in 1997 [Citation11]. The patients with LN were confirmed by renal biopsy and classified based on the current International Society of Nephrology/Renal Pathologic Society (ISN/RPS) 2003 criteria [Citation12]. All patients were recruited from the First Affiliated Hospital of Zhengzhou University. All subjects were fully informed about the characteristics and purpose of our study and provided informed consent. Our study was approved by the Ethical Committee of the Medical Ethics Committee of Zhengzhou University First Hospital (2019-KY-134).
We collected clinical data at the time of collecting the samples and the data of pathological characteristics at the time of renal biopsy. The disease activity (SLEDAI) was assessed by the SLE Disease Activity Index 2000 [Citation13]. In addition, we also calculated the estimated glomerular filtration rate (eGFR) by using the Modification of Diet in Renal Disease Study equations (eGFR-MDRD) [Citation14] and Chronic Kidney Disease Epidemiology Collaboration equations (eGFR-EPI) [Citation15].
2.2. Definition of renal impairment
Renal impairment is defined by the following: 1. Urine protein/creatinine ratio ≥ 0.2; 2. Persistent proteinuria ≥ 0.15 g/d or greater than 1+ by dipstick; 3. Cellular casts including red blood cells (RBCs), hemoglobin, granular, tubular, or mixed, and cellular casts limited to RBC or WBC casts can be substituted for cellular casts in the absence of infection); 4. Active urinary sediment: 5 RBCs/HPF, 5 white blood cells (WBCs)/HPF; and 5. Renal biopsy supports the diagnosis of LN.
2.3. Determination of plasma TNF-RI levels
Peripheral blood samples were collected with EDTA-K2 anticoagulant tubes after an overnight fast. Plasma was obtained by centrifugation at 3000 rpm for 10 min within 1 h. All samples were aliquoted and stored at −80 °C until this analysis. The levels of plasma sTNF-RI in the discovery cohort were detected and quantified by Quantibody® Human Inflammation Array 3 (Cat# QAH-INF-G3-4, Raybiotech), and the levels of plasma TNF-RI in the replication cohort were detected and quantified by the Human TNF-RI Quantikine ELISA Kit (R&D Systems, Minneapolis, MN) according to the manufacturer’s instructions.
2.4. Immunohistochemistry of TNF-RI expression
Renal lesion tissues were harvested from a renal tissue biopsy, and normal kidney tissue samples adjacent to renal cancer served as normal controls. The deposition of TNF-RI in the kidneys of LN patients with different types was detected by immunohistochemistry (IHC). Two class II LN patients, 1 class III LN patient, 2 class IV LN patients, 3 class V patients and 5 normal controls were included. The renal tissues were prepared into 4 µm thick paraffin sections using polyclonal rabbit anti-human TNR-RI (21574-1-AP, Proteintech) at a 1:100 dilution. The TNF-RI-positive area was quantified using the ImageJ analysis system.
2.5. Statistical analysis
χ2 tests or Fisher’s exact tests were used for categorical variables, and data are presented as n, %. Mann–Whitney tests or independent-samples T tests were used for continuous variables, and data are presented as the mean ± standard deviation (SD) or median and interquartile range (IQR). Pearson’s correlation coefficient was applied to detect the correlation between the level of plasma sTNF-RI and clinical indicators. Univariate and multivariate logistic regression analyses were used to explore the variables that were independently related to LN and active SLE. Then, the nomogram was generated based on multivariate logistic regression. In addition, calibration curves, decision curve analysis (DCA) and receiver operating characteristic (ROC) curves were plotted to determine the reliability of our nomogram. All data were analyzed by using R software version 4.1.2, and p < .05 was considered significant.
3. Result
3.1. Study population characteristics
The baseline characteristics of the patients and healthy controls are shown in . In the discovery cohort, non-LN patients had a median disease duration of 6.5 months (range 1–51.75 months), and the LN patients had a median disease duration of 12 months (range 1–63.25 months). In the replication cohort, the SLE without renal involvement patients had a median disease duration of 6.5 months (range 1–33.25 months), and the LN patients had a median disease duration of 12 months (range 1–48 months).
Table 1. Clinical data of SLE patients and healthy controls the discovery cohort and the replication cohort.
3.2. Plasma sTNF-RI levels were increased in non-LN patients and LN patients
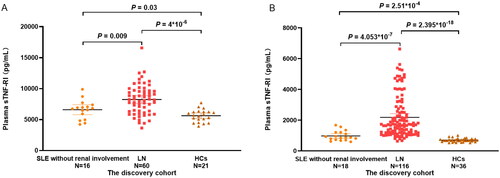
Of the 21 inflammatory factors tested, plasma sTNF-RI levels differed significantly in the discovery cohort. The plasma sTNF-RI levels were significantly higher in LN patients [8220.94 (6338.67–9645.84) pg/ml] than non-LN patients [6791.14 (5210.08–7308.11) pg/ml] (p = .009) and HCs [5706.72 (4779.93–6257.09) pg/ml] (p = 4 × 10⁻⁶). sTNF-RI levels were higher in the non-LN group than in the HCs (p = .03) (). The finding was confirmed in the independent replication cohort. ELISA determined that the plasma sTNF-RI levels of LN patients [1714.91 (1192.87–2704.57) pg/ml] were significantly higher than non-LN patients [870.58 (721.84–1208.55) pg/ml] (p = 4.053 × 10⁻⁷) and HCs [677.87(615.31–739.1) pg/ml](p = 2.395 × 10−18) and differed significantly between non-LN patients and HCs (p = 2.51 × 10⁻⁴) ().
Figure 1. Plasma sTNF-RI levels in SLE without renal impairment patients, LN patients and healthy controls (HCs) of the discovery cohort (A) and in the replication cohort (B).
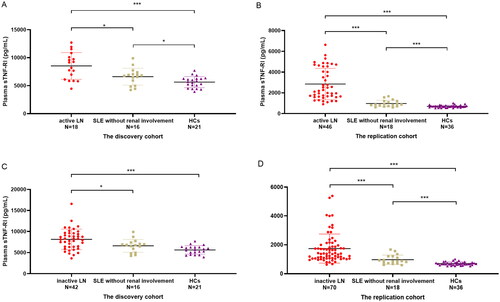
Because the disease activity was significantly different in the LN groups, we analyzed the difference between active LN patients (SLEDAI > 9) and inactive LN patients (SLEDAI ≤ 9). In the discovery cohort, we did not observe significant changes between active LN patients and inactive LN patients (p = .508). We noticed that the plasma sTNF-RI levels were significantly higher in active LN patients or in inactive LN patients than in HCs or non-LN patients (p < .001 and p = .021, respectively, in active LN; p < .001 and p = .017, respectively, in inactive LN). In the replication cohort, the plasma sTNF-RI levels gradually increased in HCs, non-LN patients, inactive LN patients and active LN patients. A significant difference was found between every two groups (p < .001) ().
Figure 2. Plasma sTNF-RI levels in active LN patients (SLEDAI > 9), SLE without renal impairment patients and HCs of the discovery cohort (A) and in the replication cohort (C), plasma sTNF-RI levels in inactive LN patients (SLEDAI ≤ 9), SLE without renal impairment patients and HCs of the discovery cohort (B) and in the replication cohort (D). SLEDAI: SLE disease activity, *p < .05, ****p < .001.
The level of plasma sTNF-RI was not different in different types of LN patients. Specifically, the expression of plasma sTNF-RI did not differ between proliferative LN patients (class III/IV, class V + III or IV) and membranous LN (class II or V) (Supplemental Material Table 1, and Citation2].
3.3. Increased plasma sTNF-RI levels were associated with increased disease activity, decreased renal function in SLE patients and the level of urine protein in LN patients
We compared the plasma sTNF-RI levels between SLE patients with and without particular clinical features. In the discovery cohort, plasma sTNF-RI levels in SLE patients with serositis or thrombocytopenia were significantly higher than those in SLE patients without serositis or thrombocytopenia (serositis p = .015; thrombocytopenia p = .019). The SLE patients without anti-Sm antibodies showed significantly increased plasma sTNF-RI levels compared with those with anti-Sm antibodies (p = .039). However, this finding could not be verified in the replication cohort ().
Table 2. Plasma sTNF-RI levels in the presence or absence of manifestations in SLE patients.
In the discovery cohort, we found that the level of plasma sTNF-RI was positively correlated with SLEDAI, serum creatinine, urea, uric acid, systolic blood pressure and total cholesterol, while it was inversely correlated with eGFR-EPI, eGFR-MDRD and serum albumin. In the replication cohort, we found that the level of plasma sTNF-RI was positively correlated with SLEDAI, anti-dsDNA Ab, serum creatinine, urea, uric acid, systolic blood pressure, diastolic blood pressure, total cholesterol, triglycerides, and low-density lipoprotein, while it was inversely correlated with C3, eGFR-EPI, eGFR-MDRD and serum albumin. We also recalculated the SLEDAI of LN patients excluding the renal domains, and our data showed that plasma sTNF-RI was positively correlated with SLEDAI (Supplemental Material Table 2, and Citation4].
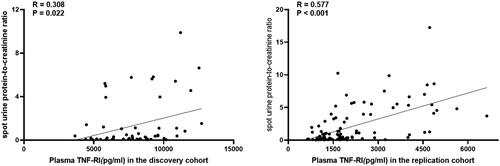
Figure 3. Correlation of plasma sTNF-RI and urine protein-to-creatinine ratio in LN patients of the discovery cohort and in the replication cohort.
To assess the association of plasma sTNF-RI concentrations with renal function decline, we divided LN patients with eGFR-EPI < 90 mL/min/1.73 m2 into two groups: chronic acute renal failure (CRF) groups and acute renal failure (ARF) groups. In the replication cohort, plasma sTNF-RI levels were significantly higher in the ARF group than in the CRF group (25 vs. 14, 3837.05 (2407.99–4858.57) vs. 2136.66 (1513.4–4003.82, p = .007).
One patient in the discovery cohort and 1 patient in the replication cohort lacked physical urine examination because of anuria from end-stage renal disease, and 5 patients in the discovery cohort and 10 patients in the replication cohort lacked urine spot urine protein-to-creatinine ratio. Our data showed that in the discovery cohort, LN patients who had urine protein greater than 1+ showed a higher incidence of plasma sTNF-RI levels [17 vs. 42, 9578.65 (7329.79–11,021.64) vs. 7771.65 (6069.59–8925.46), p = .016]. A more detailed analysis demonstrated that the level of plasma sTNF-RI was positively correlated with the spot urine protein-to-creatinine ratio (Spearman’s Rho correlation = 0.308, p = .022). This finding was confirmed in our replication cohort. In the replication cohort, LN patients who had urine protein greater than 1+ showed a higher incidence of plasma sTNF-RI levels [43 vs. 72, 2747.84 (1653.2–4547.11) vs. 1412.44 (1085.55–1861.94), p < .001]. The level of plasma sTNF-RI was positively correlated with the urine protein-to-creatinine ratio (Spearman’s Rho correlation = 0.577, p < .001) ().
3.4. Development of a disease diagnosis model for LN patients from non-LNs and active SLE from inactive SLE
To further evaluate the risk factors for LN in SLE patients, we performed univariate logistic regression in the validation cohort, and the model results showed that high TNF-RI, high SBP, low C4 and high UA were risk factors for LN in SLE patients. These factors were included in the multivariate logistic regression model, and the results showed that high TNF-RI was an independent risk factor for LN in SLE patients (). The ROC results suggested that the use of TNF-RI to distinguish LN from SLE patients had good efficacy [the value of the area under the ROC curve (AUC) 0.872, 95% CI 0.794–0.950, cutoff value 949.47 pg/ml, sensitivity 93.1%, and specificity 66.7%] ().
Figure 4. ROC of TNF-RI in differentiating LN patients from SLE without renal impairment patients. ROC: receiver operating characteristic; AUC: the value of the area under the ROC curve.
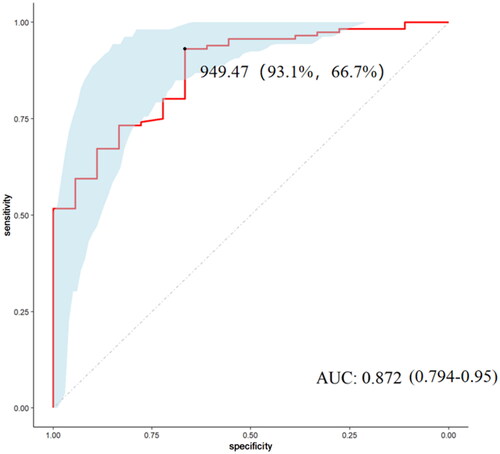
Table 3. Logistic regression analysis in differentiating LN patients from no-LNs.
To identify the risk factors for SLE patients with high disease activity (SLEDAI > 9), we performed univariate logistic regression in the validation cohort. The model results showed that high TNF-RI, high SBP, high DBP, high Scr, low C3, low C4, high UA and anti-dsDNA positivity were risk factors for SLE patients with high disease activity (SLEDAI > 9). In the multivariate logistic regression model, the results showed that high TNF-RI, high DBP, high serum creatinine, low C4 and anti-ds-DNA positivity were independent risk factors for active SLE patients (). We depicted a nomogram to visualize the model (). Next, we plotted ROC curves to assess relative accuracies (). The results showed that the ROC curve based on the obtained potential risk factors identified by multivariate logistic regression analysis had the best efficiency, with an AUC of 0.889 (95% CI 0.830–0.948), a specificity of 85.7% and a sensitivity of 78%. The calibration curve indicated that the model had great calibration capability (). The results of decision curve analysis (DCA) showed that the established nomogram had the best net benefit and a wide range of threshold probabilities ().
Figure 5. (A) Nomogram based on the active SLE diagnosis model; (B) ROC curves comparing the nomogram (a) with anti-dsDNA (b), TNF-RI (c), serum creatinine (Scr) (d) and diastolic blood pressure (DBP) (e); (C) calibration curve of the nomogram; (D) DCA of the nomogram. ROC: receiver operating characteristic; AUC: the value of the area under the ROC curve; DCA: decision curve analysis.
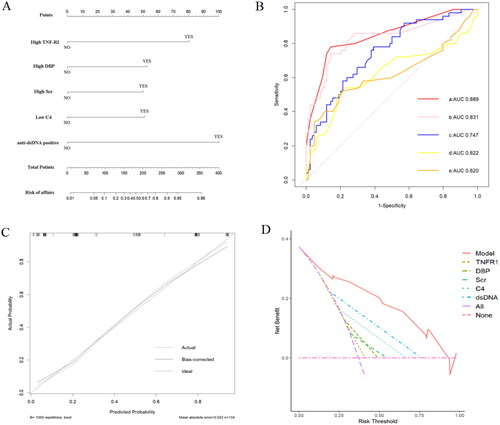
Table 4. Logistic regression analysis in differentiating active SLE from inactive SLE.
3.5. Renal TNF-RI expression increased in LN patients
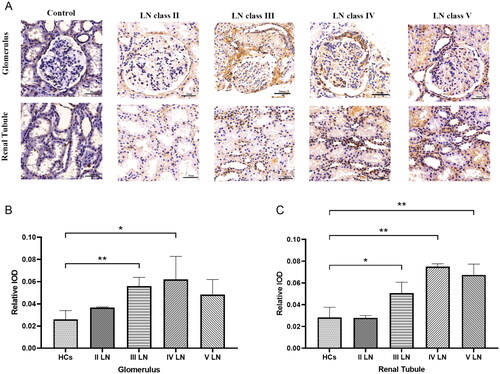
IHC results showed that TNF-RI was present predominantly in the nucleus. The expression levels of TMF-RI among different types of LN and the control group are listed in . In the normal kidney and type II LN, TNF-RI was faintly stained in the tubulointerstitium and the glomeruli. TNF-RI in the glomeruli of patients with proliferative LN increased significantly. In contrast, the TNF-RI-positive area was significantly higher in the renal tubules of patients with type III, IV and V LN. ().
Figure 6. Renal TNF-RI expression in LN patients and controls. (A) Images show TNF-RI immunostaining in the glomeruli and tubulointerstitium. A representative image was shown (scale bar 50 µm); The positive area was quantified with different types and healthy control in glomerulus (B) and renal tubule (C).*p < .05、**p < .01.
4. Discussion
We performed a discovery-replication study to investigate the association between plasma sTNF-RI levels and SLE patients in the Chinese population. Our data showed that plasma sTNF-RI could distinguish between SLE patients with and without renal involvement. Moreover, plasma sTNF-RI was closely related to disease activity and renal function in SLE patients and the level of urine protein in LN patients.
Previous studies reported that TNF-RI could be a new biomarker for early renal decline in patients with type 2 diabetes and that serum sTNF-RI was correlated with plasma creatinine values in patients with sepsis syndrome [Citation16–19], but relatively few investigations have evaluated the function of TNF-RI in patients with LN. As the predominant mediator of TNF signaling, increasing evidence supported the important role of TNF-RI signaling in the pathogenesis of SLE [Citation20]. TNF-RI is expressed in a wide variety of cells, and it is present primarily in glomeruli and peritubular endothelial cells [Citation21]. TNF-RI can promote both proinflammatory and proapoptotic functions, while chronic inflammation is postulated to be involved in deteriorating renal function [Citation22,Citation23]. A large body of evidence suggests that serum sTNF-RI is associated with inflammatory renal disease [Citation24–26]. A previous study reported that serum sTNF-RI levels were associated with renal interstitial fibrosis in patients with glomerulopathies [Citation27]. High levels of TNF-RI in the circulation could activate the production of proinflammatory cytokines and chemokines, which may induce direct renal injury [Citation28]. Previous studies reported higher levels of urinary and serum TNF-RI in LN patients than in HCs and SLE patients. Moreover, TNF-RI was strongly correlated with disease activity in SLE patients and the level of urine protein in LN patients [Citation9,Citation29]. In our study, we set more stringent emission standards for renal impairment. We excluded patients who presented proteinuria during the course of the disease in the SLE without renal impairment group, and we still obtained the same result. Moreover, TNF-RI was associated with renal damage and disease activity after adjusting for potential confounding factors. Our data also showed that plasma sTNF-RI levels were significantly higher in LN patients with ARF than in LN patients with CRF. Furthermore, sTNF-RI could reportedly contribute directly to microvascular kidney injury, which in turn can lead to a sharp decline in renal function. The specific mechanism remains to be further studied. A particularly interesting novel finding was that plasma sTNF-RI levels and urine protein in LN patients were positively correlated. sTNF-RI is excreted in urine, so higher levels of TNF-RI may also indicate glomerular hypofiltration. However, an important consideration was that we also found such differences in the levels of plasma sTNF-RI between SLE patients without renal involvement and HCs, and the urine protein level of the latter was similar to that of HCs. We speculated that plasma TNF-RI might represent renal dysfunction more efficiently and sensitively than urine protein. This finding still merits further evaluation. Moreover, plasma sTNF-RI showed high specificity and sensitivity for the diagnosis of renal involvement and disease activity in SLE patients in our data.
As in previous reports [Citation30], we found that glomerular TNF-RI was strongly increased in proliferative LN. We also observed that TNF-RI expression was increased, especially in renal tubular epithelial cells, in LN patients. Tubular damage plays an important role in the pathophysiology and progression of LN. Proximal renal tubular epithelial cells (PTECs) play an active role in the initiation of immune-mediated injury in LN [Citation31]. However, the role of TNF-RI in the renal tubules has been neglected. Further studies are needed.
Our study also had some limitations. First, it is a monocentric trial with a small sample size. Second, because of the lower sensitivity of ACR criteria, patients with very recent onset of the disease or with less common manifestations may be missed.
As described previously, we suggest that plasma sTNF-RI could be used in clinics as a noninvasive and useful biomarker for SLE disease activity and prediction of renal involvement.
Author contributions
XR.L collected the samples, performed the data and wrote this manuscript. YY.Q, YF.Z, Y.C helped in the samples collection and data analysis. ZZ.Z designed the entire study, the provided partial financial support and expert advice. All the authors mentioned had read and approved this final version of the manuscript.
Supplemental Material
Download PDF (440.4 KB)Disclosure statement
We declare that this study was conducted in the absence of any financial or commercial relationships that could be construed as a potential conflict of interest.
Data availability statement
The data that support the findings of this study are available on request from the first author and corresponding author underlying reasonable request.
Additional information
Funding
References
- Durcan L, O'Dwyer T, Petri M. Management strategies and future directions for systemic lupus erythematosus in adults. Lancet. 2019;393(10188):2332–2343.
- Jakes RW, Bae SC, Louthrenoo W, et al. Systematic review of the epidemiology of systemic lupus erythematosus in the Asia-Pacific region: prevalence, incidence, clinical features, and mortality. Arthritis Care Res. 2012;64(2):159–168.
- Almaani S, Meara A, Rovin BH. Update on lupus nephritis. Clin J Am Soc Nephrol. 2017;12(5):825–835.
- Kiriakidou M, Ching CL. Systemic lupus erythematosus. Ann Intern Med. 2020;172(11):Itc81–itc96.
- Idborg H, Eketjäll S, Pettersson S, et al. TNF-α and plasma albumin as biomarkers of disease activity in systemic lupus erythematosus. Lupus Sci Med. 2018;5(1):e000260.
- Gane JM, Stockley RA, Sapey E. TNF-α autocrine feedback loops in human monocytes: the pro- and anti-Inflammatory roles of the TNF-α receptors support the concept of selective TNFR1 blockade in vivo. J Immunol Res. 2016;2016:1079851.
- Borghi A, Verstrepen L, Beyaert R. TRAF2 multitasking in TNF receptor-induced signaling to NF-κB, MAP kinases and cell death. Biochem Pharmacol. 2016;116:1–10.
- Sharapova TN, Romanova EA, Soshnikova NV, et al. Autoantibodies from SLE patients induce programmed cell death in murine fibroblast cells through interaction with TNFR1 receptor. Sci Rep. 2020;10(1):11144.
- Adhya Z, El Anbari M, Anwar S, et al. Soluble TNF-R1, VEGF and other cytokines as markers of disease activity in systemic lupus erythematosus and lupus nephritis. Lupus. 2019;28(6):713–721.
- Tan EM, Cohen AS, Fries JF, et al. The 1982 revised criteria for the classification of systemic lupus erythematosus. Arthritis Rheum. 1982;25(11):1271–1277.
- Hochberg MC. Updating the American College of Rheumatology revised criteria for the classification of systemic lupus erythematosus. Arthritis Rheum. 1997;40(9):1725.
- Weening JJ, D'Agati VD, Schwartz MM, et al. The classification of glomerulonephritis in systemic lupus erythematosus revisited. Kidney Int. 2004;65(2):521–530.
- Gladman DD, Ibañez D, Urowitz MB. Systemic lupus erythematosus disease activity index 2000. J Rheumatol. 2002;29(2):288–291.
- Levey AS, Bosch JP, Lewis JB, et al. A more accurate method to estimate glomerular filtration rate from serum creatinine: a new prediction equation. Modification of diet in renal disease study group. Ann Intern Med. 1999;130(6):461–470.
- Levey AS, Stevens LA, Schmid CH, et al. A new equation to estimate glomerular filtration rate. Ann Intern Med. 2009;150(9):604–612.
- Schrauben SJ, Shou H, Zhang X, et al. Association of multiple plasma biomarker concentrations with progression of prevalent diabetic kidney disease: findings from the chronic renal insufficiency cohort (CRIC) study. J Am Soc Nephrol. 2021;32(1):115–126.
- Nowak N, Skupien J, Smiles AM, et al. Markers of early progressive renal decline in type 2 diabetes suggest different implications for etiological studies and prognostic tests development. Kidney Int. 2018;93(5):1198–1206.
- Froon AH, Bemelmans MH, Greve JW, et al. Increased plasma concentrations of soluble tumor necrosis factor receptors in sepsis syndrome: correlation with plasma creatinine values. Crit Care Med. 1994;22(5):803–809.
- Bergquist M, Samuelsson L, Larsson A, et al. TNFR1, TNFR2, neutrophil gelatinase-associated lipocalin and heparin binding protein in identifying sepsis and predicting outcome in an intensive care cohort. Sci Rep. 2020;10(1):15350.
- Chen G, Goeddel DV. TNF-R1 signaling: a beautiful pathway. Science. 2002;296(5573):1634–1635.
- Al-Lamki RS, Wang J, Vandenabeele P, et al. TNFR1- and TNFR2-mediated signaling pathways in human kidney are cell type-specific and differentially contribute to renal injury. FASEB J. 2005;19(12):1637–1645.
- Feng YM, Thijs L, Zhang ZY, et al. Glomerular function in relation to circulating adhesion molecules and inflammation markers in a general population. Nephrol Dial Transplant. 2018;33(3):426–435.
- Niewczas MA, Pavkov ME, Skupien J, et al. A signature of circulating inflammatory proteins and development of end-stage renal disease in diabetes. Nat Med. 2019;25(5):805–813.
- Lee SM, Yang S, Cha RH, et al. Circulating TNF receptors are significant prognostic biomarkers for idiopathic membranous nephropathy. PLoS One. 2014;9(8):e104354.
- Bhatraju PK, Zelnick LR, Shlipak M, et al. Association of soluble TNFR-1 concentrations with long-term decline in kidney function: the multi-ethnic study of atherosclerosis. J Am Soc Nephrol. 2018;29(11):2713–2721.
- Srivastava A, Schmidt IM, Palsson R, et al. The associations of plasma biomarkers of inflammation with histopathologic lesions, kidney disease progression, and mortality-the Boston kidney biopsy cohort study. Kidney Int Rep. 2021;6(3):685–694.
- Sonoda Y, Gohda T, Suzuki Y, et al. Circulating TNF receptors 1 and 2 are associated with the severity of renal interstitial fibrosis in IgA nephropathy. PLoS One. 2015;10(4):e0122212.
- Navarro JF, Mora-Fernández C. The role of TNF-alpha in diabetic nephropathy: pathogenic and therapeutic implications. Cytokine Growth Factor Rev. 2006;17(6):441–450.
- Zheng CZ, Yan WW, Luo YL, et al. Value of sTNF-R1 and linc0597 as indicators for disease activity and diagnosis of lupus nephritis. Eur Rev Med Pharmacol Sci. 2020;24(10):5582–5591.
- Aten J, Roos A, Claessen N, et al. Strong and selective glomerular localization of CD134 ligand and TNF receptor-1 in proliferative lupus nephritis. J Am Soc Nephrol. 2000;11(8):1426–1438.
- Hill GS, Delahousse M, Nochy D, et al. Proteinuria and tubulointerstitial lesions in lupus nephritis. Kidney Int. 2001;60(5):1893–1903.