
 ?Mathematical formulae have been encoded as MathML and are displayed in this HTML version using MathJax in order to improve their display. Uncheck the box to turn MathJax off. This feature requires Javascript. Click on a formula to zoom.
Abstract
Purpose
Little is known about the effect of visit-to-visit ultrafiltration volume (UV) variability on the outcome. In this study, we investigated the association between visit-to-visit UV variability and all-cause mortality in patients receiving hemodialysis (HD).
Methods
We consecutively enrolled patients who received maintenance HD in our center from March 2015 to March 2021. UV variability was defined using standard deviation (UVSD) and coefficient of variation (UVCV) (standard deviation divided by the mean). The relationship between UV variability and all-cause mortality was assessed using univariate and multivariate Cox proportional hazard regression models. Receiver operating characteristic curves were used to evaluate the predictive abilities of UVSD and UVCV for short-term and long-term survival rates.
Results
A total of 283 HD patients were included. The mean age was 57.54 years, and 53% were males. Follow-up was done for a median of 3.38 years (IQR 1.83–4.78). During the follow-up period, 73 patients died. Cox proportional hazards models indicated that UVSD and UVCV (higher versus lower) were positively associated with all-cause mortality (p=.003 and p<.001, respectively), while in multivariable-adjusted models, only higher UVCV remained significantly associated with all-cause mortality in patients receiving HD (HR 2.55 (95% CI 1.397–4.654), p=.002). Moreover, subgroup analyses showed that the predictive performance of UVCV was more accurate among older patients, males and patients with comorbidities.
Conclusions
Visit-to-visit UV variability, especially UVCV, is a helpful indicator for predicting all-cause mortality in patients receiving HD, especially for older patients, males and those with comorbidities.
Introduction
Hemodialysis (HD) remains the most used kidney replacement therapy worldwide, accounting for over two-thirds of all kidney replacement therapies [Citation1]. Compared with the general population and even peritoneal dialysis counterparts, patients receiving HD have significantly higher mortality [Citation2]. Although dialysis technology and services have vastly improved, the outcome of HD is still not optimistic [Citation3]. Among the known causes of death for patients receiving HD, cardiovascular disease is the major cause of mortality and accounts for more than 50% [Citation4]. Consequently, exploring the risk factors is extremely important for improving the survival rate of HD patients.
HD patients frequently experience unpleasant symptoms, such as postdialysis light-headedness, fatigue and worsening cramps during dialysis treatment [Citation5]. This suggests that volume management is essential and a vital component of dialysis treatment for HD patients [Citation4]. Volume overload results in peripheral edema, breathlessness-induced hypertension, left ventricular hypertrophy, and heart failure [Citation6]. Extracellular volume overload is a critical contributor to the high risk of cardiovascular mortality in patients undergoing HD [Citation7,Citation8]. However, aggressive volume removal is associated with intradialytic hypotension (IDH), myocardial stunning, and greater mortality and morbidity [Citation9]. Currently, there are no precise indicators of fluid volume, and there is uncertainty about how to achieve ideal volume, especially in extracellular water.
In current clinical practice, dry weight targeting is subjective and influenced by many factors [Citation10]. The difficulty lies in assessing volume status and deciding how much fluid to remove during HD, namely, ultrafiltration volume (UV). Previous studies have shown that a higher ultrafiltration rate (defined as UV per unit time and weight) contributes to poorer prognosis in HD patients [Citation11,Citation12]. However, there is little evidence to support it as a good indicator for volume control [Citation13]. It is worth noting that, to date, little is known about the effect of visit-to-visit UV variability on the outcome. Thus, we aim to assess the impact of visit-to-visit UV variability on all-cause mortality in patients receiving HD.
Materials and methods
Study subjects
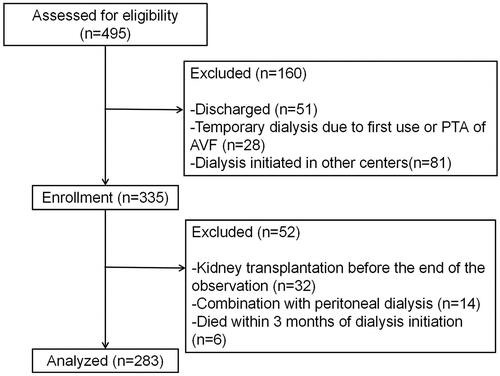
A total of 283 HD patients from the Department of Nephrology at Xinqiao Hospital, Army Medical University, from March 2015 to March 2021, were retrospectively analyzed (). The inclusion criterion was as follows: patients received maintenance HD treatment in our center for at least 3 months. All patients received 4 h of conventional HD three times weekly. The sodium concentration in dialysis is usually 135–140 mmol/L, which should be selected according to blood pressure control. Individualized sodium concentration can be selected when hypertension is not well controlled, such as low-sodium dialysis, high-sodium dialysis, or sequential dialysis with sodium concentration from high to low. The follow-up period was from the first dialysis to the occurrence of the primary outcome. Otherwise, the final follow-up time was the most recent visit. The exclusion criteria were as follows: age below 18 years; received kidney transplantation in the follow-up period; combination with peritoneal dialysis; lack of clinical information data or clear medical history.
Figure 1. Flowchart showing the procedure for the selection of study participants. PTA: percutaneous transluminal angioplasty; AVF: arteriovenous fistula.
Clinical and laboratory information
The following data were collected at the time of the first dialysis: age, sex, body mass index (BMI), B-type natriuretic peptide, presence of hypertension, diabetes, cardiovascular disease (myocardial infarction, cerebral infarction, cerebral hemorrhage, coronary heart disease, chronic heart failure, and peripheral vascular diseases), and chronic kidney disease etiology. Residual urine after 3 months of dialysis was collected during a 24-h period of the interdialytic interval. Intradialytic hypotension is defined as a decrease in systolic blood pressure by 20 mm Hg, which is based on K/DOQI clinical practice guidelines [Citation14]. Blood pressure measurements were made pre- and post-HD every 30 min during the treatment. Hemoglobin, serum albumin, serum calcium, serum phosphorus, and serum intact parathyroid hormone (iPTH) were obtained from the most recent routine laboratory tests, in which blood samples were collected before HD.
Definitions of UV variability
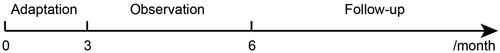
After a 3-month dialysis adaptation period, a series of visits were conducted for six consecutive months from the observation period to evaluate UV variability. Every dialysis was regarded as a visit, and dialysis-related information was recorded. The patient’s adaptation, visit-to-visit observation and follow-up after dialysis are shown in . The standard deviation (SD) and coefficient of variation (CV) were calculated using the indices of UV variability. CV is SD divided by mean. UV data during the observation period were recorded and used to calculate UV variability. The calculation formulas are as follows:
where n is the total dialysis time of each patient, and the mean was calculated from all UV data. For all included patients, the number of dialysis ranged from 129 to 1021, with a median of 562.
Figure 2. Schematic diagram of patient adaptation, visit-to-visit observation, and follow-up after dialysis.
Subgroup analysis
Patients were divided into different subgroups according to the following characteristics for further analysis: age greater than or less than 65 years, sex, presence or absence of diabetes, and presence or absence of CVD. Next, we analyzed the effect of UVSD and UVCV on all-cause mortality among different subgroup populations. The analysis method was the same as that for the whole population.
Statistical analysis
Continuous variables are shown as the average ± SD or the median and interquartile range depending on the normal distribution results using the Kolmogorov–Smirnov test, whereas categorical variables are described as percentages (%). The t-test was applied for normally distributed data, and the Mann–Whitney U-test was applied for nonnormally distributed data. The Chi-squared test was applied for variable data. Hazard ratios (HRs) were estimated using Cox proportional hazard regression analyses for the relationships between all covariates (including demographic, clinical, and laboratory information) and all-cause mortality. The relationship between UV variability and all-cause mortality was plotted using the Kaplan–Meier method and assessed using the log-rank test. Receiver operating characteristic (ROC) curve analysis was used to compare the efficiency of two UV variability indices in predicting 6-month, 1-, 3-, and 5-year survival rates. The statistical significance of ROC was performed using DeLong’s test. All statistical analyses were performed with SPSS Statistics 23 (IBM Company, Chicago, IL). For multiple comparisons, Bonferroni’s correction was applied and p<.0125 was considered significant. In other cases, p value is set to .05.
Results
Baseline characteristics of the included patients
In the final analysis, 283 patients were included in the study. The average age of the participants was 59.5 years, with 53% of them being males. A total of 81 (29%) participants had diabetes, and 100 (35%) had cardiovascular disease. In 97% of cases, arteriovenous fistulas or arteriovenous grafts were used for dialysis. For CKD etiology, 114 (40%) patients had glomerulonephritis, 73 (26%) had diabetic nephropathy, 30 (11%) had hypertension, and 48 (17%) had other causes. A summary of the patients’ characteristics and laboratory data is provided in . The median value of UVSD was 627.6, while the median UVCV was 0.29. Based on these values, patients were divided into two groups (higher and lower). Compared with patients with lower UVSD, patients with higher UVSD were much older and more likely to be female but had significantly lower levels of serum phosphorus and iPTH. However, there was only a significant difference in BMI, dialysis vintage and IDH incidence between the higher UVCV group and lower UVCV group ().
Table 1. The general clinical characteristics of the included participants.
UV variability and mortality
During a median follow-up of 3.38 years (IQR 1.83–4.78), a total of 73 patients died. Next, we analyzed the potential risk factors for overall mortality. As determined by univariate Cox proportional hazard regression analyses, we found that age, hemoglobin, serum albumin, serum phosphorus, and serum iPTH were positively associated with all-cause mortality (). For categorical variables, we set non-CVD, nondiabetic, fistula/graft, and glomerulonephritis as references. We also found that the following variables were positively associated with all-cause mortality: CVD, diabetes, catheter use, diabetes, and CKD of unknown cause. The Kaplan–Meier curve illustrated that patients with higher UVSD or UVCV had a higher all-cause mortality (). As a next step, we conducted a multivariable analysis to explore the association between UV variability and all-cause mortality. Cox proportional hazards models indicated that UVSD (HR 1.674 (95% CI 1.044–2.684), p=.030) and UVCV (HR 2.509 (95% CI 1.519–4.141), p<.001) (higher versus lower) were positively associated with all-cause mortality in univariate analyses, while after adjusting for age, CVD, diabetes, vascular access, CKD etiology, hemoglobin, serum albumin, serum phosphorus, and serum iPTH, only higher UVCV remained significantly associated with all-cause mortality in patients receiving HD (HR 2.55 (95% CI 1.397–4.654), p=.002) ().
Figure 3. Survival comparing according to UVSD (A) or UVCV (B) between higher and lower groups using the Kaplan–Meier method.
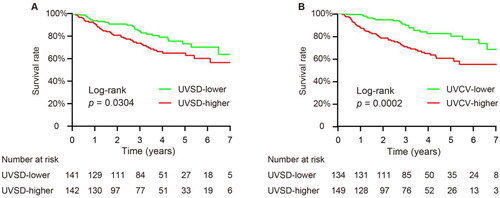
Figure 4. Multivariate analysis using the Cox proportional hazard regression analyses. All-cause mortality risk analysis according to the UVSD (A) or UVCV (B); adjusted for age, CVD, diabetes, vascular access, CKD etiology, hemoglobin, serum albumin, serum P, and serum iPTH.
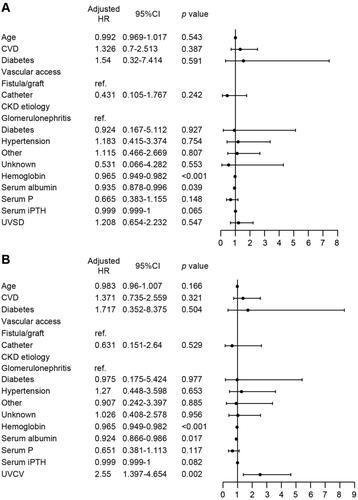
Table 2. Univariate analysis of the associations between variables and all-cause mortality using Cox proportional hazard regression analyses.
Subgroup analysis
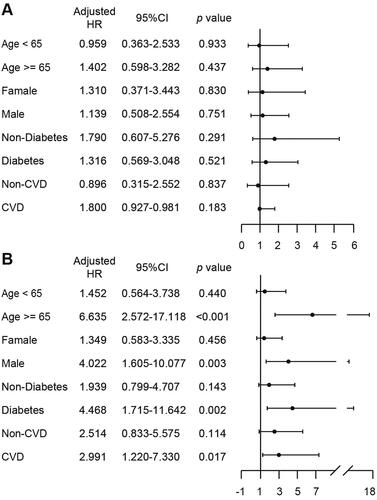
Further subgroup analyses were conducted to determine the relationship between UV variability and all-cause mortality in specific populations. Patients were grouped by age, sex, and comorbidities. Similar to the analysis for the whole population (), UVSD was not a useful predictor of all-cause mortality. Interestingly, we found that UVCV had better predictive ability in patients who were older (HR 6.635 (95% CI 2.572–17.118), p<.001), male (HR 4.022 (95% CI 1.605–10.077), p=.003), had diabetes (HR 4.468 (95% CI 1.715–11.642), p=.002) or had CVD (HR 2.991 (95% CI 1.220–7.330), p=.017) than in the entire population ().
Figure 5. Subgroup analysis according to age, gender, with or without comorbidities. All-cause mortality risk analysis according to UVSD (A) or UVCV (B); adjusted for age, CVD, diabetes, vascular access, CKD etiology, hemoglobin, serum albumin, serum P, and serum iPTH.
Survival rates for UV variability
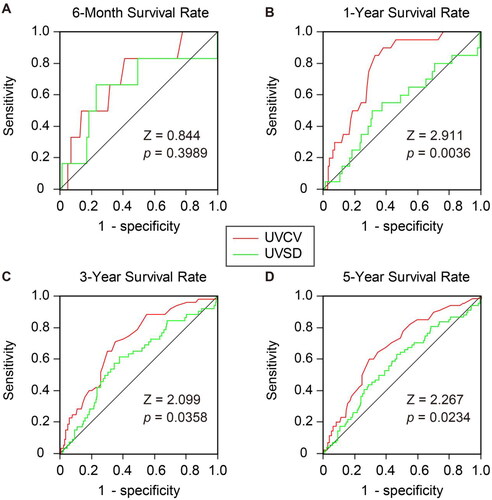
Finally, we compared UVSD and UVCV in predicting survival rates at different time points. ROC analysis was used to compare the predictive efficiency of two UV variability indices. After applying Bonferroni’s correction for multiple testing, our results showed that the ROC areas for UVSD and UVCV were comparable at six months (p=.3989), 3 years (p=.0358), and 5 years (p=.0234). Only at 1 year, UVCV had a better predictive ability for long-term survival than UVSD (p=.0036) ().
Figure 6. Comparison of the area under the curve (AUC) between UVSD (green) and UVCV (red) in predicting 6-month (A), 1-year (B), 3-year (C) and 5-year (D) survival rate. The significances of ROC AUC between UVCV and UVSD were tested by Z test.
Discussion
The present study demonstrates that visit-to-visit UV variability could predict all-cause mortality in patients receiving HD. Compared with UVSD, UVCV might be a better predictor for long-term survival, especially in patients who are older, male, and those with comorbidities.
To the best of our knowledge, this study is the first to investigate the association between visit-to-visit UV variability and all-cause mortality in patients with HD. Although the underlying causes were not clear, our data allowed for some speculations. Volume overload is prevalent among HD patients because kidneys are unable to maintain fluid homeostasis in ESRD patients [Citation15]. Kidneys are subjected to fluid accumulation during interdialytic intervals. However, excessive interdialytic weight gain (IDWG) and the consequent excessive intradialytic weight loss constitute a cyclical multiple-system organ stress, especially in the cardiovascular system [Citation16]. Previous studies have shown that higher IDWG results in cardiac chamber remodeling [Citation17], diastolic dysfunction and myocardial stunning [Citation18]. These cardiovascular injuries are associated with increased all-cause and cardiovascular mortality [Citation19–21]. These results indicate that a large fluctuation in volume status before and after HD predicts a poor prognosis. In the present study, visit-to-visit UV variability reflects another fluctuation of volume status. This fluctuation derives from dialysis sessions, distinct from that before and after HD.
Specifically, lower visit-to-visit UV variability means more stable fluid and solute removal between dialysis sessions, whether high or low absolute UV, which is theoretically helpful for the body to establish a balance of volume. This is of vital importance for maintaining cardiovascular function. Patients with higher UV variability are more vulnerable to experiencing large fluctuations in fluid and solutes between dialysis sessions. This poor condition goes against the body’s requirement of maintaining proper multiple-system organ function. For the cardiovascular system, higher UV variability increases the incidence of hypotension caused by excessive ultrafiltration or heart failure caused by insufficient ultrafiltration. Therefore, increased UV variability accompanies an increased risk of cardiovascular function impairment and poor outcomes. From this perspective, the link between higher UV variability and increased all-cause mortality seems reasonable and plausible.
Moreover, other variables’ variability among HD patients has also been studied. These results similarly show that high variability was associated with poor outcomes. For instance, numerous studies have shown that higher blood pressure variability is a risk factor for short- and long-term cardiovascular and all-cause mortality [Citation22–26]. Additionally, several other studies reported that higher variabilities of serum phosphorus [Citation27], serum albumin [Citation28], hemoglobin [Citation29], and heart rate [Citation30] could also predict mortality in HD patients. Our findings of higher UV variability, together with the above results, support that higher variability is associated with poor clinical outcomes, although the reasons behind these associations are unclear and need further exploration.
In addition, many studies investigating risk factors for mortality in the HD population have revealed that patients who are male and older, with preexisting CVD and DM had a higher risk of cardiac death [Citation31–34], indicating that these populations were more susceptible to cardiovascular disease. Our results also revealed that higher UV variability corresponds to higher risk in older, male, and comorbid populations (). This may be attributed to the preexistence of or predisposition to cardiovascular diseases of such populations.
There are several limitations of the present study, not merely due to the observational nature of the study design. First, the sample size of our study was relatively small. Second, the follow-up of the study was too short to predict accurate long-term survival. Finally, the outcome was only all-cause mortality without cardiovascular mortality or other outcomes because of missing data.
Conclusions
Our study demonstrates that higher UV variability is associated with increased all-cause mortality in patients receiving HD. This predictive effect is more accurate among older and male patients with comorbidities. The benefit of maintaining stable UV to improve clinical outcomes warrants further studies.
Ethical approval
The study protocol was approved by the ethical committee of Xinqiao Hospital (approval number 2022-yan-465-01), and was in accordance with the principles of the Declaration of Helsinki. The ethical committee exempted informed consent because the medical records was obtained during previous clinical treatment in present study and the exemption would not adversely affect patients’ rights and health.
Author contributions
Q.Z. was responsible for study design, data interpretation, statistical analysis, and manuscript drafting. Q.Z., N.W., L.N., C.L., H.C., WH., M.L., and Y.W. were responsible for data collection. J.Z. and J.X were responsible for the study design, data interpretation, and manuscript revision.
Disclosure statement
No potential conflict of interest was reported by the author(s).
Data availability statement
The data that support the findings of this study are not publicly available due to their containing information that could compromise the privacy of research participants but are available from the corresponding author.
Additional information
Funding
References
- Bello AK, Okpechi IG, Osman MA, et al. Epidemiology of haemodialysis outcomes. Nat Rev Nephrol. 2022;18(6):378–395.
- Okpechi IG, Jha V, Cho Y, et al. The case for increased peritoneal dialysis utilization in low- and lower-middle-income countries. Nephrology. 2022;27(5):391–403.
- Ma L, Zhao S. Risk factors for mortality in patients undergoing hemodialysis: a systematic review and meta-analysis. Int J Cardiol. 2017;238:151–158.
- Loutradis C, Sarafidis PA, Ferro CJ, et al. Volume overload in hemodialysis: diagnosis, cardiovascular consequences, and management. Nephrol Dial Transplant. 2021;36(12):2182–2193.
- Kalantar-Zadeh K, Lockwood MB, Rhee CM, et al. Patient-centred approaches for the management of unpleasant symptoms in kidney disease. Nat Rev Nephrol. 2022;18(3):185–198.
- Zoccali C, Mallamaci F. Mapping progress in reducing cardiovascular risk with kidney disease: managing volume overload. Clin J Am Soc Nephrol. 2018;13(9):1432–1434.
- Ok E, Asci G, Chazot C, et al. Controversies and problems of volume control and hypertension in haemodialysis. Lancet. 2016;388(10041):285–293.
- Canaud B, Chazot C, Koomans J, et al. Fluid and hemodynamic management in hemodialysis patients: challenges and opportunities. J Bras Nefrol. 2019;41(4):550–559.
- Keane DF, Raimann JG, Zhang H, et al. The time of onset of intradialytic hypotension during a hemodialysis session associates with clinical parameters and mortality. Kidney Int. 2021;99(6):1408–1417.
- Ohashi Y, Sakai K, Hase H, et al. Dry weight targeting: the art and science of conventional hemodialysis. Semin Dial. 2018;31:551–556.
- Kramer H, Yee J, Weiner DE, et al. Ultrafiltration rate thresholds in maintenance hemodialysis: an NKF-KDOQI controversies report. Am J Kidney Dis. 2016;68(4):522–532.
- Lee Y, Okuda Y, Sy J, et al. Ultrafiltration rate effects declines in residual kidney function in hemodialysis patients. Am J Nephrol. 2019;50(6):481–488.
- Slinin Y, Babu M, Ishani A. Ultrafiltration rate in conventional hemodialysis: where are the limits and what are the consequences? Semin Dial. 2018;31(6):544–550.
- K/DOQI Workgroup. K/DOQI clinical practice guidelines for cardiovascular disease in dialysis patients. Am J Kidney Dis. 2005;45(4 Suppl. 3):S1–S153.
- Loutradis CN, Tsioufis C, Sarafidis PA. The clinical problems of hypertension treatment in hemodialysis patients. Curr Vasc Pharmacol. 2017;16(1):54–60.
- Loutradis C, Sarafidis PA, Papadopoulos CE, et al. The Ebb and flow of echocardiographic cardiac function parameters in relationship to hemodialysis treatment in patients with ESRD. J Am Soc Nephrol. 2018;29(5):1372–1381.
- Ozdogan O, Kayikcioglu M, Asci G, et al. Left atrial volume predicts mortality in low-risk dialysis population on long-term low-salt diet. Am Heart J. 2010;159(6):1089–1094.
- Sarafidis PA, Kamperidis V, Loutradis C, et al. Haemodialysis acutely deteriorates left and right diastolic function and myocardial performance: an effect related to high ultrafiltration volumes? Nephrol Dial Transplant. 2017;32(8):1402–1409.
- Wizemann V, Wabel P, Chamney P, et al. The mortality risk of overhydration in haemodialysis patients. Nephrol Dial Transplant. 2009;24(5):1574–1579.
- Munoz Mendoza J, Sun S, Chertow GM, et al. Dialysate sodium and sodium gradient in maintenance hemodialysis: a neglected sodium restriction approach? Nephrol Dial Transplant. 2011;26(4):1281–1287.
- Zoccali C, Torino C, Tripepi R, et al. Pulmonary congestion predicts cardiac events and mortality in ESRD. J Am Soc Nephrol. 2013;24(4):639–646.
- Amari Y, Morimoto S, Iida T, et al. Characteristics of visit-to-visit blood pressure variability in hemodialysis patients. Hypertens Res. 2019;42(7):1036–1048.
- Huang JT, Cheng HM, Yu WC, et al. Increased nighttime pulse pressure variability but not ambulatory blood pressure levels predicts 14-year all-cause mortality in patients on hemodialysis. Hypertension. 2019;74(3):660–668.
- Liao R, Li J, Lin L, et al. The association between long- and intra-dialytic blood pressure variability with all-cause mortality in hemodialysis patients. Blood Purif. 2019;48(1):43–50.
- Zhao Y, Yang L, Yu S, et al. Blood pressure variability and prognosis in hemodialysis patients: a systematic review and meta-analysis. Kidney Dis. 2021;7(5):411–424.
- Yang J, Huang J, Yu B, et al. Long-term predialysis blood pressure variability and outcomes in hemodialysis patients. J Clin Hypertens. 2022;24(2):148–155.
- Zhu M, Dou L, Zhu M, et al. Variability of serum phosphorus and its association with mortality among hemodialysis patients. Clin Nephrol. 2018;90(2):79–86.
- Chen C, Zhang J, Zhou Z, et al. Impact of serum albumin level and variability on short-term cardiovascular-related and all-cause mortality in patients on maintenance hemodialysis. Medicine. 2021;100(43):e27666.
- Lin FJ, Zhang X, Huang LS, et al. Impact of hemoglobin variability on cardiovascular mortality in maintenance hemodialysis patients. Int Urol Nephrol. 2018;50(9):1703–1712.
- Chang YM, Huang YT, Chen IL, et al. Heart rate variability as an independent predictor for 8-year mortality among chronic hemodialysis patients. Sci Rep. 2020;10(1):881.
- Habib AN, Baird BC, Leypoldt JK, et al. The association of lipid levels with mortality in patients on chronic peritoneal dialysis. Nephrol Dial Transplant. 2006;21(10):2881–2892.
- João Matias P, Azevedo A, Laranjinha I, et al. Lower serum magnesium is associated with cardiovascular risk factors and mortality in haemodialysis patients. Blood Purif. 2014;38(3–4):244–252.
- Moradi H, Streja E, Kashyap ML, et al. Elevated high-density lipoprotein cholesterol and cardiovascular mortality in maintenance hemodialysis patients. Nephrol Dial Transplant. 2014;29(8):1554–1562.
- Park KS, Ryu GW, Jhee JH, et al. Serum ferritin predicts mortality regardless of inflammatory and nutritional status in patients starting dialysis: a prospective cohort study. Blood Purif. 2015;40(3):209–217.