
Abstract
Diabetic kidney disease (DKD) is a severe complication of type 2 diabetes mellitus (T2DM). However, the pathogenesis of DKD remains unclear, and effective treatment strategies are still lacking. Ginsenoside Rg1 (Rg1) has been reported to improve DKD, but the mechanism is unclear. NADPH oxidase 4 (NOX4) is an essential reactive oxygen species (ROS) source in the kidney. The mitogen-activated protein kinase (MAPK) signaling may exacerbate renal fibrosis. Therefore, we hypothesized that Rg1 might alleviate renal injury and fibrosis by inhibiting NOX4 and MAPK signaling in T2DM-induced DKD. We found that Rg1 significantly improves lipid deposition, fibrosis, and ROS production and reduces NOX4, p22phox, p47phox, p-ERK, p-JNK, and p-P38 MAPK expressions in the T2DM mice kidneys. We also found that the high-fat diet treatment in mice and the palmitate (PA) and PA + HG (high glucose) exposure in human mesangial cells could significantly induce lipid deposition, ROS production, fibrosis, and the activation of NOX4–MAPK signaling. The results suggest that high lipid and glucose may play a significant role in DKD progression, while Rg1 may attenuate renal fibrosis by inhibiting NOX4–MAPK signaling.
1. Introduction
Type 2 diabetes mellitus (T2DM) is caused by genetic and environmental factors and is characterized by glucose and lipids metabolism disorders [Citation1]. The development of T2DM can cause multiple organ injuries and a series of complications [Citation1,Citation2]. The kidney is the most important target of diabetic microvascular damage in diabetic patients, and diabetic kidney disease (DKD) has been a serious complication of T2DM [Citation3]. In the late stage, the disease manifests as renal fibrosis and eventually progresses to end-stage renal disease (ESRD), which seriously affects the health of diabetic patients [Citation4,Citation5]. Growing studies show that renal fibrosis, mainly caused by extracellular matrix (ECM) accumulation in the glomerular and tubular interstitium, plays a critical role in developing ESRD in diabetic patients [Citation6,Citation7]. Meanwhile, the transforming growth factor-β (TGF-β) pathway is over-activated in human mesangial cells (HMCs) in the diabetic environment, resulting in the upregulation of collagen IV (Col4) and fibronectin (FN) to promote the fibrosis process in the kidney [Citation8–10]. Although glycemic control in diabetic patients may appropriately delay but still cannot effectively avoid the progression of renal fibrosis in DKD [Citation11], suggesting that other factors may be involved in progression of DKD. Therefore, the specific mechanism of renal fibrosis in DKD remains to be further explored.
High blood lipids and glucose are essential characteristics of T2DM, and increasing studies have suggested that DKD may result from the interaction of elevated blood lipids and glucose [Citation12,Citation13]. The levels of free fatty acids (FFAs) in serum are reported to be increased significantly in patients with T2DM, and there is growing evidence that high FFAs may play a vital role in developing renal fibrosis in DKD [Citation14,Citation15]. However, the specific mechanism of the high FFA alone and combined with high glucose (HG) in deteriorating renal fibrosis in DKD remains incompletely understood. When patients progress to ESRD, effective treatments other than renal transplantation are still lacking [Citation16]. Therefore, illuminating the specific mechanism by which FFA and HG promote renal fibrosis in DKD and developing effective drugs will be an extraordinary significance for diabetic patients.
It has been shown that, in high lipids and HG environments, the production of reactive oxygen species (ROS) is significantly elevated during biological aerobic metabolic process, ultimately causing tissue damage through a series of pathways [Citation17,Citation18]. Numerous data suggest that oxidative stress injury is a critical mediator in the progression of DKD [Citation19,Citation20]. The nicotinamide adenine dinucleotide phosphate oxidase (NADPH oxidase, NOX) system consists of seven isoforms (NOX1–5 and Duox1–2) and is an essential source of ROS in the body. Among them, NADPH oxidase 4 (NOX4) is highly expressed in the kidney and is the primary source of ROS. It has been shown that the expression of NOX4 is significantly increased in HMCs and podocytes in high lipids and glucose environments, which is closely involved in the progression of DKD [Citation19–21]. Additionally, excessive ROS can induce the activation of mitogen-activated protein kinase (MAPK) signaling-related kinases, which further mediate downstream apoptosis and inflammation and exacerbate the extent of renal fibrosis [Citation10,Citation19,Citation21–23]. It has been reported that NOX4 knockdown can significantly decrease the ROS production and inhibit the MAPK signaling pathway [Citation24,Citation25]. Therefore, more studies are still needed to explore whether high lipids and HG may promote DKD by activating the NOX4–MAPK pathway in T2DM.
Ginsenoside Rg1 (Rg1) is a compound extracted from the traditional Chinese medicine ginseng. It has been reported that Rg1 has excellent anti-oxidative, anti-inflammatory, and anti-aging effects [Citation26]. Our previous findings showed that Rg1 protects against hepatic and renal fibrosis by inhibiting NOX4 in SAMP8 mice [Citation27,Citation28]. Meanwhile, Rg1 treatment is reported to alleviate insulin resistance in HepG2 cells [Citation29], revealing a unique role of Rg1 in regulating glucose metabolism. In addition, studies have also shown that Rg1 attenuates renal injury in DKD rats through regulating the PI3K/AKT/FOXO3 signaling pathway [Citation30]. Although Rg1 has been proven to play a protective role in treating DKD, its specific mechanism has yet to be fully elucidated. In this study, we hypothesized that Rg1 treatment might attenuate renal fibrosis in DKD by inhibiting the NOX4–MAPK signaling, resulting in the downregulation of TGF-β and FN in T2DM mice. Our study may provide a new idea and approach for treating DKD.
2. Materials and methods
2.1. Cell culture and treatment
The HMCs were revived and cultured using DMEM low glucose medium (Gibco, Shanghai, China) containing 10% fetal bovine serum (Tianhang, Hangzhou, China) in an incubator at 37 °C with 5% CO2. When HMCs grew to 80%, they were inoculated into culture plates and divided into the control, palmitate (PA, 160 μM), HG (HG, 25 mM), and PA (160 μM)+HG (25 mM) group. All groups of cells were treated for 24 h. The treatment environment for HG is the DMEM HG medium (Gibco, Shanghai, China). The PA was prepared as follows. BSA solids were first dissolved in distilled water at 55 °C and configured into a 30% BSA solution. The PA was dissolved in distilled water at 70 °C to make a 27 mM PA stock solution. The above configured BSA and PA solutions were mixed 1:1 to be a 13.5 mM PA working solution.
2.2. Animals and treatment
Seventy 8-week-old C57BL/6J male mice (18–22 g) were purchased from the Laboratory Animal Center of Anhui Medical University (Hefei, China). The mice were housed in an environment-controlled animal room (12 h light/dark cycle, temperature 21–24 °C, and ad libitum feeding). The Experimental Animal Ethics Committee of Anhui Medical University approved all experimental animal procedures (LLSC20190729).
All mice were acclimatized for one week, and then 10 mice were randomly selected as the control group and given a regular diet (Synergy Bio, Nanjing, China, AIN-93M Rodent Diet, XTADM001). At the same time, the other mice were fed a high-fat diet (HFD, Synergy Bio, Nanjing, China, rodent diet with 45% calories from fat, XTHF45) for eight weeks. After eight weeks of the HFD, ten mice were randomly selected as the HFD group, and the remaining mice were given an intraperitoneal injection of streptozotocin (STZ, Shanghai Yuanye Biotechnology, Shanghai, China) solution (110 mg/kg, dissolved in 0.1 M sodium citrate buffer, pH 4.2–4.5, Kaitong Chemistry, Tianjin, China), an alkylating agent with β cell toxicity, to induce diabetic animal model [Citation31]. Seventy-two hours later, fasting blood glucose (FBG) was measured with a GA-3 glucose meter (Sinocare, Changsha, China), and mice with FBG ≥16.7 mM met the criteria for T2DM model formation. The mice were randomly divided into the HFD + STZ model group, HFD + STZ + MET (Metformin, Beijing Jingfeng Pharmaceutical, Beijing, China) 200 mg/kg group, and the HFD + STZ + Rg1 (1, 5, and 10 mg/kg) (Rg1 content >98%, Chengdu Desite Biotechnology, Chengdu, China) groups. The selection of drugs dose was based on references and the results of our previous research. The mice were given intragastric administration with drugs or an equal amount of 0.5% CMC-Na+ (Shanghai Yuanye Biotechnology, Shanghai, China) solution for eight weeks. The control group was given the regular diet, and the other groups were continued to be given the HFD for eight weeks.
2.3. FBG and serum biochemical indicators measurement
After intraperitoneal injection of STZ, FBG was measured using a GA-3 glucose meter (Sinocare, Changsha, China) every two weeks. Then, the mice were sacrificed by cervical dislocation after the orbital vein collected a blood sample. Then, the serum was collected after centrifugation at 3500 rpm for 10 min. The levels of serum creatinine (SCR) and blood urea nitrogen (BUN) were measured using the SCR and BUN assay kits (Nanjing Jiancheng Bioengineering Institute, Nanjing, China).
2.4. Detection of ROS production
In the in vivo experiments, the dihydroethidium (DHE, Beyotime Biotechnology, Nantong, China) fluorescent staining was used to study the level of renal ROS production [Citation32]. Briefly, mice (n = 3) were injected with DHE solution (100 μM, 0.1 mL/10 g) through the tail vein. Then, the mice were sacrificed by cervical dislocation 30 min later. The right kidney was taken and embedded using an OCT embedding agent (Sakura, Torrance, CA) and frozen at −20 °C for 1 h until the OCT was completely solidified. The kidney tissue sections (10 μm) were prepared using a frozen sectioning machine (CM3050, Leica, Wetzlar, Germany). Sections were then incubated with Hoechst 33258 (5 mg/L, Sigma, St. Louis, MO) solution for 10 min at room temperature (RT) to indicate cell nuclei. Imaging was performed using the Panoramic MIDI intelligent tissue slice imaging analysis system (3DHISTECH, Budapest, Hungary). Five random fields (×400) in the renal cortex from three mice in each group were analyzed using Image-Pro Plus 6.0 software to quantify the red fluorescence density as an indication of ROS production.
In the in vitro study, H2DCFDA staining was used to evaluate the production of ROS [Citation33]. HMCs were digested and evenly inoculated in 24-well plates. Stimulation was given to each group, and the medium was discarded after 24 h incubation and washed three times with PBS (Biosharp, Hefei, China). H2DCFDA (Beyotime Biotechnology, Nantong, China) storage solution was prepared with DMEM at 1:1000 and 500 μL of H2DCFDA working solution was added to each well incubation for 30 min. After washed three times with PBS, the cells were photographed with ImageXpress High-Content Imaging System (Molecular Devices, Sunnyvale, CA). The fluorescence density from three random fields (×200) per well was analyzed by Image-Pro Plus 6.0 to indicate ROS production (repeated three times).
2.5. Oil Red O staining
Oil Red O staining is commonly used to observe the production of lipids with red or orange color [Citation34]. In vivo study, frozen sections of OCT-embedded kidney tissue were rewarmed and washed with distilled water. After that, the sections were stained with Oil Red O solution (Solarbio, Beijing, China) for 1 h followed by hematoxylin to stain nuclei and sealed after rinsing with tap water. The production of lipids in the renal cortex was observed on the Panoramic MIDI intelligent tissue slice imaging analysis system. The density from five random fields (×400) in the renal cortex of four mice in each group was analyzed using Image-Pro Plus 6.0 software to indicate the lipid deposition.
In vitro study, HMCs were digested and inoculated in 24-well plates. After treatment, the cells were fixed with 4% paraformaldehyde (Biosharp, Hefei, China) for 15 min and washed three times. Then, 0.5 mL of Oil Red O staining solution was added to each well and stained for 20 min. After rinsed under water for 3 min, the hematoxylin staining solution was added to stain the nuclei for 15 s. Finally, 0.5 mL of PBS was added to each well, and the lipid deposition in the cells was photographed under an IX72 microscope (Olympus, Tokyo, Japan). The density from three random fields (×200) per well was analyzed by Image-Pro Plus 6.0 to quantify lipid deposition (repeated three times).
2.6. β-Galactosidase staining in kidney
It has been reported that the senescence of renal cells is an important biological event in the progression of DKD [Citation35]. Therefore, we further detected the activity of β-galactosidase (β-Gal) to detect renal senescence in T2DM mice. Briefly, 10-μm-thick kidney (n = 3) frozen sections were washed three times using PBS solution to remove residual OCT embedding agent. The tissue was then fixed with 50 μL of β-Gal staining fixative for 15 min and washed three times with PBS for 5 min each. After that, the working staining solution was added dropwise and left overnight at 37 °C. The next day, the staining solution was discarded, the tissue was washed three times with PBS, and images were taken using a Panoramic MIDI intelligent tissue slice imaging analysis system. The density from five random fields (×400) in the renal cortex of four mice in each group was analyzed using Image-Pro Plus 6.0 software to quantify the aging of the kidneys.
2.7. Masson staining
The mice (n = 6) were anesthetized with an intraperitoneal injection of 2,2,2-tribromoethanol (1.25%, 0.2 mL/10 g, Aibei Biotechnology, Nanjing, China), and the heart was perfused with PBS until the liver turned grayish white and then switched to 4% paraformaldehyde for continued perfusion. After the mice were stiffened, the bilateral kidneys were removed and fixed by immersion in a fixative solution for 24 h. Afterward, the kidney tissues were dehydrated, paraffin-embedded, and cut into 5 μm thick slices. Then, the sections were stained following the instructions of the Masson staining kit (Biosharp, Hefei, China). The MIDI intelligent tissue slice imaging analysis system was used to obtain the results. The blue density from five random areas (×400) of glomeruli in the renal cortex was quantified using the analysis software Image-Pro Plus 6.0 to assess fibrotic changes in the kidney.
2.8. Periodic acid-Schiff staining
To detect basement membrane thickening as well as glycogen deposition in the glomeruli. We performed Periodic acid-Schiff (PAS, Beyotime Biotechnology, Nantong, China) staining on kidney paraffin sections (n = 4). Briefly, paraffin sections were dewaxed according to the usual procedure, 100 μL of periodic acid solution was added dropwise, reacted for 10 min in a wet box protected from light and washed in distilled water for 5 min. Then, 100 μL of Schiff solution was added dropwise and stained for 30 min at 37 °C protected from light. The staining solution was removed and washed for 5 min by immersion in distilled water. Finally, nuclei were stained with hematoxylin. The results were obtained using the MIDI intelligent tissue slice imaging analysis system. Five random glomerular regions (×400) in the renal cortex were selected for quantitative analysis using ImageJ 1.53 to assess the pathological changes in the glomeruli.
2.9. Immunofluorescence staining
In the in vivo experiment, the paraffin sections (n = 4) were dewaxed and were placed in a citrate buffer solution for antigen repair. After blocking with Immunostaining Blocker Solution (Beyotime Biotechnology, Nantong, China) for 1 h, the sections were placed overnight in a 4 °C refrigerator with primary antibodies of anti-FN (Affinity, Changzhou, China, 1:200). The next day, after incubation with a fluorescent secondary antibody for 1 h, cell nuclei were stained with Hoechst 33258 working solution. In the in vitro experiment, the round coverslips were placed into a 24-well plate before uniform inoculation of cells. After 24 h of stimulation, the cells were washed three times with PBS, and then fixed with 4% paraformaldehyde for 10 min. Afterward, the cells were permeabilized with 0.5% Triton X-100 (Beyotime Biotechnology, Nantong, China) and blocked with 5% BSA at RT for 1 h. Then, the cells were incubated with anti-Col4 (Bioworld, Nanjing, China, 1:50) primary antibody at 4 °C overnight and incubated with fluorescent secondary antibody for 1 h. The nuclei were stained with Hoechst 33258. The sections were finally sealed and photographed using the MIDI intelligent tissue slice imaging analysis system. The green density from five random areas (×400) was quantified using the analysis software of Image-Pro Plus 6.0 to assess the expression of FN and Col4.
2.10. Western blot
Briefly, total protein was isolated from the renal cortex (n = 4) and HMCs (n = 3) using RIPA lysate with protease inhibitor and phosphatase inhibitor (Beyotime Biotechnology, Nantong, China). The total protein concentration in each group was determined using the BCA protein assay kit (Beyotime Biotechnology, Nantong, China). After SDS/PAGE gel electrophoresis, the proteins were transferred to the PVDF membrane (Millipore, Billerica, MA). The membranes were blocked with skimmed milk (5%, Biosharp, Hefei, China) at RT for 1 h. Then, the membranes were treated with anti-NOX4 (1:1000, Bioworld, Nanjing, China, BS60435), anti-p47phox (1:1000, Bioworld, Nanjing, China, BS4852), anti-TGF-β1 (1:1000, Affinity, Changzhou, China, AF1027), anti-Kim-1 (1:1000, Bioss, Beijing, China, bs-2713R), anti-Col4 (1:1000, Bioworld, Nanjing, China, BS1072), anti-β-actin (1:5000, Affinity, Cincinnati, OH, AF7018), anti-GAPDH (1:1000, Affinity, Changzhou, China, AF7021), anti-FN (1:1000, Bioworld, Nanjing, China, BS90514), anti-ERK (1:1000, Bioworld, Nanjing, China, BS5016), anti-p-ERK (1:1000, Affinity, Changzhou, China, AF1014), anti-JNK (1:1000, Santa, Santa Cruz, CA, sc-137019), anti-p-JNK (1:1000, ABclonal, Woburn, MA, AP0631), anti-P38 (1:1000, Affinity, Changzhou, China, BF8015), and anti-p-P38 (1:1000, Affinity, Changzhou, China, AF4001) primary antibodies (dissolved in Primary Antibody Dilution Buffer, Biosharp, Hefei, China) shaking overnight at 4 °C in a refrigerator. The next day, the membranes were incubated with Goat Anti-Rabbit IgG HRP (1:10,000, Affinity, Changzhou, China, S0001) or Goat Anti-Mouse IgG HRP (1:10,000, Affinity, Changzhou, China, S0002) for 1 h at RT. Finally, the membranes were imaged using the Western ECL Substrate (Bio-Rad, Hercules, CA) and photographed using the Mini Bioshine Chemi Imaging System (Q4600, Baoxin Technology, Shanghai, China). The optical density of each strip was quantified using ImageJ 1.53 software and normalized to β-actin or GAPDH levels to quantify the expression of the target proteins.
2.11. Real-time fluorescence quantitative PCR (q-PCR)
Total RNA was extracted from HMCs using the RNAeasy Isolation Kit (Beyotime Biotechnology, Nantong, China). The concentration of RNA was determined using a DS-11 Ultra Micro Nucleic Acid Protein Assay (Denovix, Wilmington, DE), then the total RNA was reverse transcribed into complementary DNA (cDNA) using the PrimeScript™ RT kit (Takara, Otsu, Japan). The primer sequences used are as follows: TGF-β (forward 5′-ACC GCA ACA ACG CCA TCT ATG AG-3′; reverse 5′-GGC ACT GCT TCC CGA ATG TCT G-3′); FN (forward 5′-CGA AGT CAG TGT CTA TGC TCT CAA GG-3′; reverse 5′-TGG TCT CTG TAG CGT CCG TCA C-3′); Col4 (forward 5′-ATG GCA TTG TGG AGT GTC AAC CTG-3′; reverse 5′-CTT CAC CTG TCA AAC CTG GCT GTC-3′); GAPDH (forward 5′-CGC CGC CAG CTC ACC ATG-3′; reverse 5′-CAC GAT GGA GGG GAA GAC-3′). The levels of target mRNAs were normalized with GAPDH. The transcript levels of mRNAs were analyzed by the 2−ΔΔCT method. The experiment was repeated three times.
2.12. Statistical analysis
All data were expressed as mean ± SD, and all results were compared using one-way ANOVA followed by Tukey’s test to compare the difference between groups. All statistical differences were automatically calculated and generated by GraphPad Prism 9.0 software (La Jolla, CA). p< 0.05 was considered to be statistically significant.
3. Results
3.1. Rg1 treatment improves the levels of FBG, BUN, and SCR in T2DM mice
First, we observed the effect of Rg1 treatment on FBG at different times. The results showed that the levels of FBG were significantly increased but less than 10 mM in the HFD group at the 10th, 12th, 14th, and 16th weeks as compared with the control group (p< 0.05 or p< 0.01, ), suggesting that HFD feeding induces insulin resistance in mice. Meanwhile, the results indicated that a more abnormal elevation of FBG (more than 25 mM) was observed in the HFD + STZ model group during these times (p< 0.01, ), which indicated the success of the T2DM model in this experiment. However, Rg1 (5 and 10 mg/kg) and MET (200 mg/kg) administration significantly reduced the levels of FBG in T2DM mice but still at higher levels (p< 0.01, ), suggesting that Rg1 treatment slightly improves the level of FBG in T2DM mice.
Figure 1. Effect of Rg1 treatment on fasting blood glucose and renal function indicators in T2DM mice. (A) The levels of fasting blood glucose (FBG, mM). (B) The level of blood urea nitrogen (BUN, mM). (C) The level of serum creatinine (SCR, μM). The data are expressed as the means ± SD, FBG, n = 8–9, BUN and SCR, n = 6. *p< 0.05, **p< 0.01 compared with the control group; ##p< 0.01 compared with the HFD + STZ group.
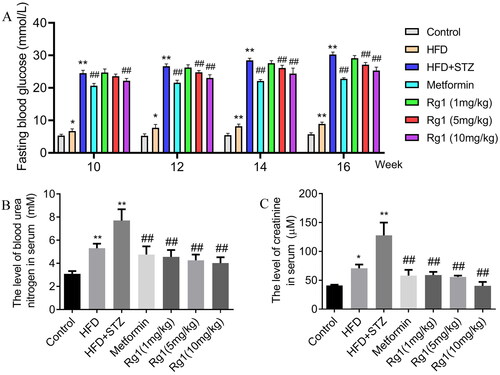
To confirm the protective effect of Rg1 on DKD, we examined the classical markers of renal damage, the BUN and SCR. Our results showed that, compared with the control group, the levels of BUN and SCR were dramatically increased in the T2DM model group (p< 0.01, ), suggesting the success of the DKD mouse model. HFD treatment alone also increased the levels of BUN and SCR in mice. In contrast, the administration of Rg1 (5 and 10 mg/kg) and MET significantly reduced the levels of SCR and BUN in T2DM mice (p< 0.01, ). The results suggest that Rg1 has a better protective effect on DKD, which may not be related to the hypoglycemic effect.
3.2. Rg1 treatment alleviates renal lipid deposition and senescence in T2DM mice
Lipid deposition is an important pathological feature of T2DM and plays an essential role in the development of DKD. Therefore, we performed Oil Red O staining on the kidneys to observe the lipid deposition. As shown in , the kidney in HFD and HFD + STZ model groups showed significant lipid deposition, especially in the model group (p< 0.01, ), while treatment with Rg1 and MET significantly reduced lipid deposition in the kidneys of T2DM mice (p< 0.01, ). These results suggest that lipid deposition may play an important role in the DKD of T2DM mice, and Rg1 may improve DKD by reducing lipid deposition in T2DM mice.
Figure 2. Effect of Rg1 treatment on renal lipid deposition and cellular senescence in T2DM mice. (A) The results of lipid deposition in the renal cortex (Oil Red O staining, ×400). (B) The mean density of Oil Red O staining in the renal cortex. (C) The results of cellular senescence in the renal cortex (β-Gal staining, ×400). (D) The mean density of β-Gal staining in the renal cortex. The data are expressed as the means ± SD, n = 4. **p< 0.01 compared with the control group; ##p< 0.01 compared with the HFD + STZ group.
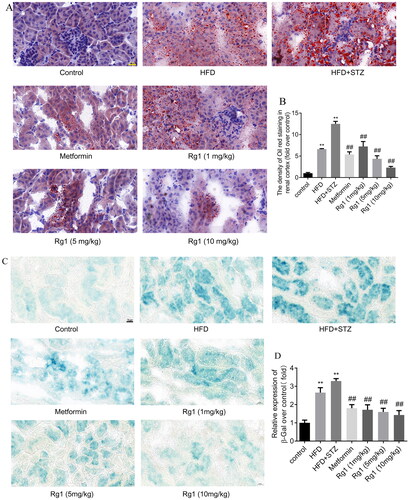
β-Gal is a classical cellular senescence marker to show the senescence of cells. We further performed β-Gal staining to detect the cellular senescence in kidneys. The results showed that the kidneys in the HFD and model groups exhibited significant cellular senescence, especially in the T2DM model group (p< 0.01, ). However, Rg1 and MET administration significantly reduced the β-Gal activation in the kidneys of T2DM mice as compared with the model group (p< 0.01, ). These results suggest that T2DM mice show more severe renal cellular senescence, which can be effectively attenuated by Rg1 treatment.
3.3. PA + HG exposure exacerbates fibrosis in HMCs
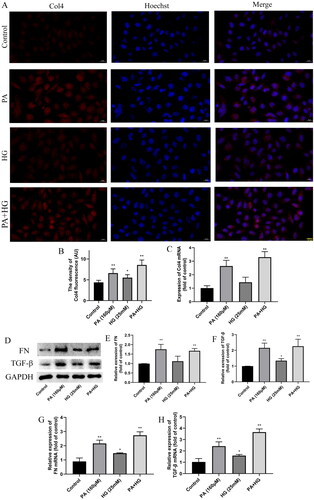
We further investigated the effect of PA and HG exposure on fibrosis in HMCs. We first detected the expression of the Col4 protein and mRNA. The immunofluorescence results showed that the expression of Col4 protein was significantly increased in PA and PA + HG groups as compared with the control group, and the results of q-PCR were consistent with the immunofluorescence (p< 0.01, ). While HG exposure alone only slightly increased the expression of Col4 protein in HMCs (p< 0.05, ). We further examined the expressions of FN, TGF-β protein and mRNA by western blot and q-PCR. The results showed that PA and PA + HG significantly increased the expressions of FN and TGF-β protein and mRNA in HMCs compared to the control group (p< 0.01, ). While HG exposure alone only slightly increased the expression of FN and TGF-β protein and mRNA in HMCs (p< 0.05, ). These results suggest that PA + HG may play a prominent role in promoting renal fibrosis in T2DM.
Figure 3. Effect of PA and PA + HG on the fibrosis of HMCs. (A) The result of Col4 expression in the HMCs (immunofluorescence, ×400). (B) The mean density of Col4 fluorescence in the HMCs. (C) The level of Col4 mRNA. (D) The bands of FN, TGF-β, and GAPDH (Western blotting). (E) The relative expression of FN over control. (F) The relative expression of TGF-β over control. (G) The level of FN mRNA (q-PCR). (H) The level of TGF-β mRNA (q-PCR). The data are expressed as the mean ± SD, n = 3, *p< 0.05, **p< 0.01 compared with the control group.
3.4. Rg1 treatment inhibits renal fibrosis in T2DM mice
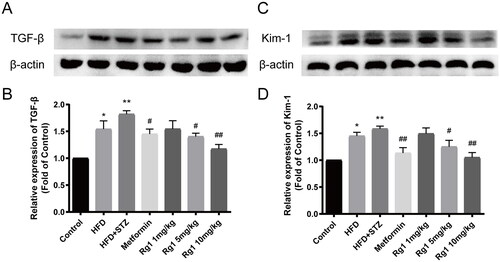
We first performed Masson staining on the kidneys to investigate the protective effect of Rg1 on T2DM mice. The results showed that the HFD and HFD + STZ model groups showed significant glomerular and tubular interstitial fibrosis compared to the control group, especially in the model group (p< 0.01, ). However, Rg1 (5 and 10 mg/kg) and MET administration significantly attenuated renal fibrosis in T2DM mice as compared with the model group, especially in the Rg1 (10 mg/kg) group (p< 0.05 or 0.01, ). FN is a crucial marker of renal fibrosis. We further detected the expression of FN by immunofluorescence. Consistent with the results of Masson staining, the expression of FN significantly increased in the renal cortex in the HFD and model group mice, especially in the model group (p< 0.01, ). Rg1 (1, 5, and 10 mg/kg) and MET administration significantly reduced the expression of FN in the T2DM mice (p< 0.01, ). Moreover, we further measured the expressions of pro-fibrotic factor TGF-β and kidney injury molecule 1 (Kim-1) using the western blot. The results indicated that the expressions of TGF-β and Kim-1 were increased in the HFD and model groups compared to the control group, especially in the model group (p< 0.05 or 0.01, ). However, Rg1 (5 and 10 mg/kg) and MET administration significantly reduced the expressions of TGF-β and Kim-1 in T2DM mice as compared with the model group (p< 0.05 or 0.01, ). In addition, we further observed the changes in glomerular mesangium and acidic glycoprotein deposition in T2DM mice using PAS staining. Our results showed that glomerular mesangium was significantly enlarged and acidic glycoprotein deposition was significantly increased in the HFD and HFD + STZ group mice (p< 0.01, Supplemental Figure 1A and B). However, these changes were reversed considerably by Rg1 and MET (p< 0.05 or 0.01, Supplemental Figure 1A and B). These results indicate that Rg1 treatment can significantly attenuate renal fibrosis and injury in T2DM-induced DKD.
Figure 4. Effect of Rg1 treatment on renal fibrosis in T2DM mice. (A) The results of fibrosis in the renal cortex (Masson staining, ×400). (B) The mean density of Masson staining in the renal cortex. (C) The result of FN expression in the renal cortex (immunofluorescence, ×400). (D) The mean density of FN fluorescence in the renal cortex. The data are expressed as the mean ± SD, Masson, n = 6, FN, n = 4, **p< 0.01 compared with the control group; #p< 0.05, ##p< 0.01 compared with the HFD + STZ group.
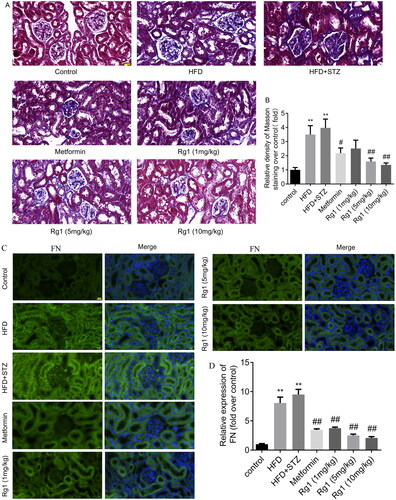
Figure 5. Effect of Rg1 on the expression of TGF-β and Kim-1 in the renal cortex of T2DM mice. (A) The bands of TGF-β (Western blotting). (B) The relative expression of TGF-β over control. (C) The bands of Kim-1 (Western blotting). (B) The relative expression of Kim-1 over control. The data are expressed as the mean ± SD, n = 4, *p< 0.05, **p< 0.01 compared with the control group; #p< 0.05, ##p< 0.01 compared with the HFD + STZ group.
3.5. PA + HG exposure increases lipid deposition and ROS generation in HMCs
Lipid deposition is an essential pathological process in T2DM-induced DKD [Citation36]. Therefore, we observed the effects of PA and HG on lipid deposition in HMCs using Oil Red O staining. The results showed that the cells in PA and PA + HG groups showed significant lipid deposition compared to the control group, especially in the PA + HG group (p< 0.01, ), while HG alone exposure had no significant effect on lipid deposition in HMCs. The results suggest that PA-induced lipid deposition may play a critical role in T2DM-induced DKD.
Figure 6. Effects of PA and PA + HG on lipid deposition and oxidative stress in the HMCs. (A) The results of lipid deposition in the HMCs (Oil Red O staining, ×200). (B) The ROS production of HMCs (H2DCFDA, ×200). (C) The mean density of Oil Red O staining in the HMCs. (D) The mean density of ROS production in the HMCs. (E) The bands of p47phox, p22phox, NOX4, and GAPDH (Western blotting). (F) The relative expression of p47phox over control. (G) The relative expression of p22phox over control. (H) The relative expression of NOX4 over control. The data are expressed as the mean ± SD, n = 3, *p< 0.05, **p< 0.01 compared with the control group.
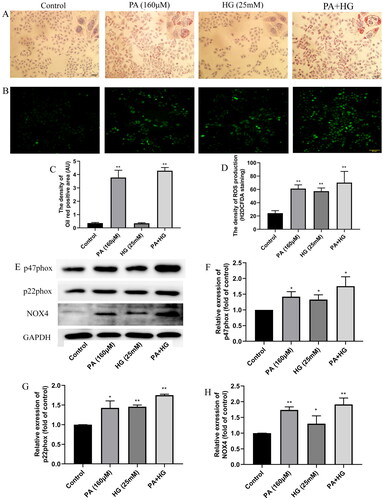
It is well known that oxidative stress plays a vital role in the pathogenesis and progression of DKD [Citation37]. Therefore, we observed the effects of PA and HG on ROS production in HMCs. The results showed that the levels of ROS production were significantly increased in the PA, HG, and PA + HG groups, especially in the PA + HG group (p< 0.01, ), suggesting that both PA and HG can induce oxidative stress in HMCs. NOX4 is the most important source of ROS production in kidney [Citation38]. The results showed that the expressions of NOX4, p22phox, and p47phox were significantly increased in the PA, HG, and PA + HG groups compared with the control group (p< 0.05 or 0.01, ). These results suggest that both PA and HG stimulation can induce significant oxidative stress in HMCs, which may play a critical role in DKD.
3.6. Rg1 treatment decreases ROS production and NOX4 expression in T2DM mice
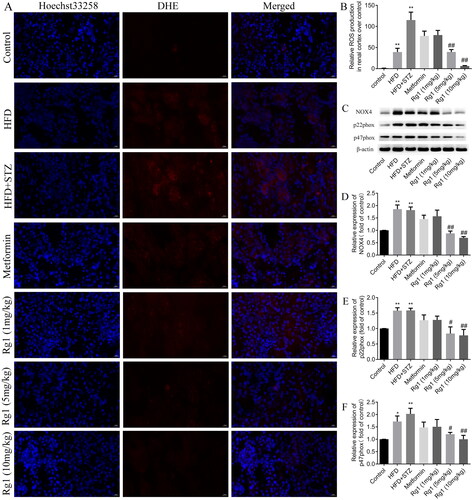
We further observed the effects of Rg1 on ROS production in T2DM mice. The results showed that the ROS production was significantly increased in the renal cortex of HFD and HFD + STZ model groups compared to the control group, especially in the model group (p< 0.01, ). Meanwhile, Rg1 (5 and 10 mg/kg) treatment significantly reduced ROS accumulation in the renal cortex of T2DM mice (p< 0.01, ). However, MET treatment only had a decreased trend in ROS production. We further examined the expressions of NOX4, p47phox, and p22phox in the renal cortex by western blot. The results showed that the expressions of these proteins were significantly increased in the HFD and HFD + STZ model groups as compared with the control group (p< 0.05 or 0.01, ). However, treatment with Rg1 (5 and 10 mg/kg) significantly decreased the expressions of these proteins (p< 0.05 or 0.01, ). Similarly, MET treatment only had a decreasing trend in the expressions of these proteins. These results suggest that NOX4-derived ROS accumulation may play a vital role in the progression of DKD in T2DM, and Rg1 may protect against T2DM-induced DKD by reducing the NOX4-mediated ROS production.
Figure 7. Effect of Rg1 treatment on oxidative stress in the renal cortex of T2DM mice. (A) The results of ROS production in the renal cortex (DHE staining, ×400). (B) The mean density of ROS fluorescence in the renal cortex. (C) The bands of NOX4, p22phox, p47phox, and β-actin (Western blotting). (D) The relative expression of NOX4 over control. (E) The relative expression of p22phox over control. (F) The relative expression of p47phox over control. The data are expressed as the mean ± SD, ROS, n = 3, Western Blot, n = 4, **p< 0.05 compared with the control group; #p< 0.05, ##p< 0.01 compared with the HFD + STZ group.
3.7. PA + HG exposure activates the MAPK pathway in HMCs, and Rg1 treatment inhibits the MAPK pathway in T2DM mice
It has been reported that oxidative stress can activate the MAPK signaling pathway, thus aggravating the DKD process [Citation21,Citation39]. Therefore, we first explored the effects of PA and HG stimulation on the MAPK signaling in HMCs. The results showed that both PA and PA + HG exposure significantly increased the levels of p-ERK/ERK, p-JNK/JNK, and p-P38/P38, especially in the PA + HG group (p< 0.05 or 0.01, ). While HG exposure only increased the level of p-P38/P38 (p< 0.05, ). These results suggest that high lipid combination with HG may deteriorate DKD by activating the MAPK signaling pathway.
Figure 8. Effects of PA and PA + HG on MAPK pathway in the HMCs and the regulatory role of Rg1 in the T2DM mice. (A) The bands of p-JNK, JNK, p-P38, P38, p-ERK, ERK, and GAPDH in the HMCs (Western blotting, n = 3). (B) The relative expression of p-ERK/ERK in the HMCs over control. (C) The relative expression of p-JNK/JNK in the HMCs over control. (D) The relative expression of p-P38/P38 in the HMCs over control. (E) The bands of p-JNK, JNK, p-P38, P38, p-ERK, ERK, and β-actin in the mice (Western blotting, n = 4). (F) The relative expression of p-ERK/ERK over control. (G) The relative expression of p-JNK/JNK over control. (H) The relative expression of p-P38/P38 over control. The data are expressed as the mean ± SD, *p< 0.05, **p< 0.01 compared with the control group; #p< 0.05, ##p< 0.01 compared with the HFD + STZ group.
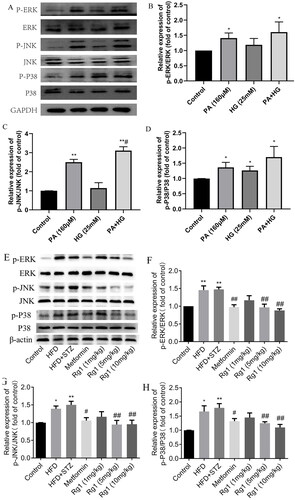
The animal experiments also showed that the levels of p-ERK/ERK, p-JNK/JNK, and p-P38/P38 in the renal cortex were significantly increased in the HFD and HFD + STZ model group as compared with the control group (p< 0.05 or 0.01, ). However, when mice were treated with Rg1 (5 and 10 mg/kg) and MET, the phosphorylation levels of these proteins were significantly reduced as compared with the model group (p< 0.05 or 0.01, ). These results suggest that Rg1 may protect against DKD by inhibiting the MAPK signaling pathway in T2DM.
4. Discussion
T2DM is a common metabolic disease that can lead to various complications and has become a significant health problem worldwide [Citation1,Citation40]. DKD, one of the most dangerous complications of T2DM, is characterized by progressive renal fibrosis and impairment of renal function. The detailed mechanism of T2DM-mediated renal fibrosis is still unknown, and few clinical drugs can effectively prevent DKD progression [Citation6,Citation11,Citation41]. Rg1 is a promising drug extracted from ginseng (Panax ginseng C. A. Meyer). It has been shown that Rg1 has potent antioxidant, anti-inflammatory, and anti-aging effects [Citation26]. Our previous results suggested that Rg1 significantly attenuates aging-induced renal fibrosis in SAMP8 senescent mice by inhibiting inflammation and oxidative stress [Citation28]. Rg1 also significantly improves LPS-induced chronic renal injury and fibrosis in mice [Citation42] and TGF-β-induced fibrosis in HSC-T6 cells [Citation43]. However, the effect and specific mechanism of Rg1 treatment in protecting against renal injury and fibrosis in T2DM are still unknown. The present results showed that Rg1 administration significantly reduced the levels of BUN and SCR in T2DM mice, and decreased the expressions of Kim-1, an important biomarker of kidney injury [Citation44], and β-Gal, a widely used biomarker of senescence. Ultimately, Rg1 significantly improved renal fibrosis in T2DM mice. Further studies suggested that the ameliorative effect of Rg1 on DKD may be related to the inhibition of NOX4 expression, thereby attenuating the overproduction of ROS and further reducing the MAPK signaling. In addition, we found that PA and PA + HG stimulation significantly induced lipid deposition, activated NOX4–MAPK signaling, and increased the expressions of FN and TGF-β in HMCs. Our study suggests that the interaction of HG and lipids may promote the occurrence and development of DKD by activating NOX4–MAPK signaling in T2DM, and Rg1 treatment may protect against T2DM-induced DKD by inhibiting NOX4–MAPK signaling. This study may provide a new idea for the treatment of T2DM-induced DKD.
It is widely known that abnormal glucolipid metabolism is a typical feature of T2DM, and glycolipid toxicity is essential in the initiation and progression of renal fibrosis in DKD [Citation45,Citation46]. It has been reported that the plasma levels of FFAs are significantly higher in T2DM patients [Citation47]. Excessive FFAs in the body can lead to metabolic abnormalities and insulin resistance and are considered as an essential causative factor in developing DKD [Citation48]. Additionally, studies have suggested that PA is the most crucial type of FFAs in human and rodent plasma, accounting for approximately 22–25% overall [Citation49]. Our previous study showed that PA stimulation results in significant lipid deposition in HK-2 cells [Citation50]. In addition, HFD feeding has been reported to significantly increase the levels of FFAs in the kidneys of T2DM rats and lead to significant kidney damage [Citation51]. These studies suggest that lipid toxicity is vital in promoting DKD in T2DM. In the present study, consistent with previous relevant studies [Citation52], we found that after 16 weeks of HFD feeding, mice showed a slight but statistically significant elevation in FBG, indicating the emergence of insulin resistance. Consistent with renal injury and fibrosis, we found that HFD and HFD + STZ treatment could significantly increase lipid deposition in the renal cortex. Rg1 treatment only had a weak hypoglycemic effect but could dramatically reduce lipid deposition in the renal cortex of T2DM mice. In vitro study, we found that both PA and PA + HG significantly increased lipid deposition in HMCs, while HG alone exposure for 24 h had no significant effect on lipid deposition. Our data suggest that lipid deposition combination with HG may play a vital role in promoting DKD progression in T2DM. Rg1 treatment can attenuate T2DM-induced DKD by reducing lipid deposition-induced lipid toxicity.
Renal fibrosis is an important pathological feature of DKD. TGF-β is a crucial pro‑fibrotic factor. It can activate the transducer Smad2/3 signaling, which is associated with the transcription of many pro‑fibrotic genes [Citation53]. In the progression of T2DM, high lipid and glucose stimulation activate TGF-β signaling in the kidney, which can further trigger ECM deposition [Citation11]. Activation of TGF-β signaling increases the transcription of the fibro-genic factors such as Col4 and FN by inducing the proliferation of glomerular mesangial cells, which ultimately leads to renal fibrosis [Citation11,Citation21]. In this study, the Masson staining results showed significant glomerular fibrosis in both the HFD and HFD + STZ groups. Meanwhile, the expressions of FN in renal tubule were significantly increased and the glomerular mesangium was significantly expanded in the HFD and HFD + STZ groups. In addition, our experiments in vitro also showed that PA and PA + HG treatment significantly increased the expressions of FN, Col4, and TGF-β in HMCs. However, HG treatment alone for 24 h had no significant effect on fibrosis in HMCs. These data suggest that high lipid plays a vital role in the renal fibrosis of DKD in T2DM. Consistent with the results of lipid deposition, we found that Rg1 treatment significantly inhibited renal fibrosis by reducing the expressions of FN and TGF-β in T2DM mice. These results suggest that abnormal glycolipid metabolism involves in renal fibrosis in T2DM-induced DKD, and Rg1 treatment can effectively attenuate renal fibrosis by inhibiting lipid deposition in T2DM-induced DKD.
The specific mechanism by which excessive lipid deposition leads to renal fibrosis in DKD is unknown, but increasing evidence suggests that ROS-induced oxidative stress injure may be to blame. Excessive ROS accumulation has been reported to induce inflammation and apoptosis and causes renal damage in many kidney diseases, including DKD [Citation16,Citation54]. The NOX, an enzyme system with ROS production as its main function, is one of main sources of ROS in many tissues. Although some studies have indicated the presence of NOX1 and NOX2 subtypes in the kidney, NOX4 is considered the primary source of ROS in the kidney [Citation54,Citation55]. It has been reported that downregulation of NOX4 and ROS production can significantly alleviate renal injury of DKD, and that NOX4 knockout or the NOX4 inhibitors can maintain ROS levels in the kidney at normal physiological levels and attenuate renal injury in DKD mice [Citation38]. In addition, NOX4 siRNA significantly reduced the level of HG-induced oxidative stress in podocytes [Citation24]. These studies demonstrate the unique role of NOX4 in the DKD process. In this study, our results indicated that PA, HG, and PA + HG stimulation significantly upregulated the expression of NOX4 and increased ROS production in HMCs, suggesting the critical role of NOX4 in DN. Consistent with the cellular experiments, the NOX4, p22phox, and p47phox expression and ROS production were significantly increased in the kidneys of HFD and HFD + STZ-induced T2DM mice, confirming that high lipids play an essential role in DKD progression by leading to oxidative stress in the kidney. Our previous study suggested that Rg1 significantly reduces renal ROS levels by downregulating NOX4 in LPS-induced mice and aging mice [Citation28,Citation42]. The present study indicated that Rg1 treatment significantly downregulates NOX4 expression and ROS accumulation in the kidney of T2DM mice. These results suggest that inhibiting NOX4-mediated ROS oxidative stress may be an essential mechanism for Rg1 to improve DKD in T2DM.
MAPK is a family of serine-threonine protein kinases, including extracellular signal-regulated kinase 1/2 (ERK1/2), c-Jun N-terminal kinase (JNK), and P38 MAPK. It has been reported that MAPK signaling plays a key role in ECM synthesis and cardiac fibroblast proliferation [Citation56]. MAPK mediates the response to external stress signals and is considered as an essential regulator of the innate immune response and inflammatory response [Citation16]. Evidence suggests that ROS is an upstream initiator of MAPK signaling [Citation21]. Overexpression of NOX4 was reported to significantly elevate the level of ROS production and activate the MAPK signaling in podocytes [Citation57]. Meanwhile, NOX4-siRNA treatment significantly inhibited glycated albumin-induced phosphorylation of MAPKs in kidney NRK-52E cells [Citation58]. Moreover, several studies have confirmed the involvement of MAPK in renal fibrosis by mediating inflammation and apoptosis [Citation59,Citation60], and regulating the transcription of fibro-genic factors, ultimately promoting renal fibrosis [Citation61]. Meanwhile, TGF-β can act as both an upstream factor to induce the activation of the P38 MAPK signaling and a downstream product of this signaling to exacerbate inflammatory damage in renal tissue [Citation53,Citation62]. Therefore, we hypothesized that Rg1 may attenuate renal fibrosis by inhibiting the MAPK pathway in T2DM. In the present study, the in vitro results suggested that PA and PA + HG stimulation can significantly activate the MAPK pathway in HMCs. In animal experiments, we also found that MAPK signaling was considerably activated in HFD and HFD + STZ-induced T2DM mice. However, administration of Rg1 significantly reduced the phosphorylation of ERK, JNK, and P38 MAPK and significantly attenuated renal fibrosis in T2DM mice. These results suggest that Rg1 treatment may alleviate renal fibrosis by inhibiting the NOX4–MAPK signaling pathway in T2DM.
In summary, our results suggest that high lipids in combination with HG can significantly aggravate renal lipid deposition, oxidative stress injury, and renal fibrosis by activating the NOX4–MAPK signaling pathway in T2DM mice. In contrast, administration of Rg1 significantly ameliorates renal lipid deposition and renal fibrosis by decreasing NOX4 expression and MAPK phosphorylation. These findings suggest that Rg1 may be a potential drug for treating T2DM-induced DKD. However, other protective effects of Rg1 on renal injury in T2DM and the exact mechanism of how Rg1 regulates NOX4 and MAPK signaling still deserve further investigation. Furthermore, although NOX4 is thought to dominate oxidative stress in the kidney, the effects of Rg1 on other members of the NOX family deserve to be further elucidated.
Supplemental Material
Download PDF (300.7 KB)Acknowledgements
The authors thank Mr. Dake Huang in the Integrative Laboratory of the School of Basic Medical Sciences of Anhui Medical University for the technical assistance.
Disclosure statement
No potential conflict of interest was reported by the author(s).
Data availability statement
The data supporting this study’s findings are available from the corresponding author upon reasonable request.
Additional information
Funding
References
- DeFronzo RA, Ferrannini E, Zimmet P, et al. International textbook of diabetes mellitus. 4th ed. Chichester (UK): John Wiley & Sons, Ltd; 2015.
- Lovic D, Piperidou A, Zografou I, et al. The growing epidemic of diabetes mellitus. Curr Vasc Pharmacol. 2020;18(2):104–109.
- Thomas MC, Brownlee M, Susztak K, et al. Diabetic kidney disease. Nat Rev Dis Primers. 2015;1:15018.
- Anders HJ, Huber TB, Isermann B, et al. CKD in diabetes: diabetic kidney disease versus nondiabetic kidney disease. Nat Rev Nephrol. 2018;14(6):361–377.
- Tervaert TW, Mooyaart AL, Amann K, et al. Pathologic classification of diabetic nephropathy. J Am Soc Nephrol. 2010;21(4):556–563.
- Kolset SO, Reinholt FP, Jenssen T. Diabetic nephropathy and extracellular matrix. J Histochem Cytochem. 2012;60(12):976–986.
- Qiao S, Liu R, Lv C, et al. Bergenin impedes the generation of extracellular matrix in glomerular mesangial cells and ameliorates diabetic nephropathy in mice by inhibiting oxidative stress via the mTOR/beta-TrcP/Nrf2 pathway. Free Radic Biol Med. 2019;145:118–135.
- Ge Y, Wang J, Wu D, et al. lncRNA NR_038323 suppresses renal fibrosis in diabetic nephropathy by targeting the miR-324-3p/DUSP1 axis. Mol Ther Nucleic Acids. 2019;17:741–753.
- Huang H, Ni H, Ma K, et al. ANGPTL2 regulates autophagy through the MEK/ERK/Nrf-1 pathway and affects the progression of renal fibrosis in diabetic nephropathy. Am J Transl Res. 2019;11(9):5472–5486.
- Malik S, Suchal K, Khan SI, et al. Apigenin ameliorates streptozotocin-induced diabetic nephropathy in rats via MAPK-NF-kappaB-TNF-alpha and TGF-beta1-MAPK-fibronectin pathways. Am J Physiol Renal Physiol. 2017;313(2):F414–F422.
- Warren AM, Knudsen ST, Cooper ME. Diabetic nephropathy: an insight into molecular mechanisms and emerging therapies. Expert Opin Ther Targets. 2019;23(7):579–591.
- Kim JY, Bacha F, Tfayli H, et al. Adipose tissue insulin resistance in youth on the spectrum from normal weight to obese and from normal glucose tolerance to impaired glucose tolerance to type 2 diabetes. Diabetes Care. 2019;42(2):265–272.
- Chou YJ, Kan WC, Chang CM, et al. Renal protective effects of low molecular weight of inonotus obliquus polysaccharide (LIOP) on HFD/STZ-Induced nephropathy in mice. Int J Mol Sci. 2016;17(9):1535.
- Himanshu D, Ali W, Wamique M. Type 2 diabetes mellitus: pathogenesis and genetic diagnosis. J Diabetes Metab Disord. 2020;19(2):1959–1966.
- Spiller S, Bluher M, Hoffmann R. Plasma levels of free fatty acids correlate with type 2 diabetes mellitus. Diabetes Obes Metab. 2018;20(11):2661–2669.
- Ricciardi CA, Gnudi L. Kidney disease in diabetes: from mechanisms to clinical presentation and treatment strategies. Metabolism. 2021;124:154890.
- Murphy MP, Bayir H, Belousov V, et al. Guidelines for measuring reactive oxygen species and oxidative damage in cells and in vivo. Nat Metab. 2022;4(6):651–662.
- Paneni F, Beckman JA, Creager MA, et al. Diabetes and vascular disease: pathophysiology, clinical consequences, and medical therapy: part I. Eur Heart J. 2013;34(31):2436–2443.
- Liang Y, Liu H, Fang Y, et al. Salvianolate ameliorates oxidative stress and podocyte injury through modulation of NOX4 activity in db/db mice. J Cell Mol Med. 2021;25(2):1012–1023.
- Yang K, Bai Y, Yu N, et al. Huidouba improved podocyte injury by down-regulating Nox4 expression in rats with diabetic nephropathy. Front Pharmacol. 2020;11:587995.
- Yuan Q, Tang B, Zhang C. Signaling pathways of chronic kidney diseases, implications for therapeutics. Signal Transduct Target Ther. 2022;7(1):182.
- Ren Q, Guo F, Tao S, et al. Flavonoid fisetin alleviates kidney inflammation and apoptosis via inhibiting Src-mediated NF-kappaB p65 and MAPK signaling pathways in septic AKI mice. Biomed Pharmacother. 2020;122:109772.
- Sedeek M, Callera G, Montezano A, et al. Critical role of Nox4-based NADPH oxidase in glucose-induced oxidative stress in the kidney: implications in type 2 diabetic nephropathy. Am J Physiol Renal Physiol. 2010;299(6):F1348–F1358.
- Zhang J, Yang S, Li H, et al. Naringin ameliorates diabetic nephropathy by inhibiting NADPH oxidase 4. Eur J Pharmacol. 2017;804:1–6.
- Zhou T, Li S, Yang L, et al. microRNA-363-3p reduces endothelial cell inflammatory responses in coronary heart disease via inactivation of the NOX4-dependent p38 MAPK axis. Aging. 2021;13(8):11061–11082.
- Alolga RN, Nuer-Allornuvor GF, Kuugbee ED, et al. Ginsenoside Rg1 and the control of inflammation implications for the therapy of type 2 diabetes: a review of scientific findings and call for further research. Pharmacol Res. 2020;152:104630.
- Li Y, Zhang D, Li L, et al. Ginsenoside Rg1 ameliorates aging‑induced liver fibrosis by inhibiting the NOX4/NLRP3 inflammasome in SAMP8 mice. Mol Med Rep. 2021;24(5):801.
- Shen X, Dong X, Han Y, et al. Ginsenoside Rg1 ameliorates glomerular fibrosis during kidney aging by inhibiting NOX4 and NLRP3 inflammasome activation in SAMP8 mice. Int Immunopharmacol. 2020;82:106339.
- Fan X, Tao J, Zhou Y, et al. Investigations on the effects of ginsenoside-Rg1 on glucose uptake and metabolism in insulin resistant HepG2 cells. Eur J Pharmacol. 2019;843:277–284.
- Liu H, Chen W, Lu P, et al. Ginsenoside Rg1 attenuates the inflammation and oxidative stress induced by diabetic nephropathy through regulating the PI3K/AKT/FOXO3 pathway. Ann Transl Med. 2021;9(24):1789.
- Furman BL. Streptozotocin-induced diabetic models in mice and rats. Curr Protoc. 2021;1(4):e78.
- Cheng X, He S, Yuan J, et al. Lipoxin A4 attenuates LPS-induced mouse acute lung injury via Nrf2-mediated E-cadherin expression in airway epithelial cells. Free Radic Biol Med. 2016;93:52–66.
- Oparka M, Walczak J, Malinska D, et al. Quantifying ROS levels using CM-H(2)DCFDA and HyPer. Methods. 2016;109:3–11.
- Mehlem A, Hagberg CE, Muhl L, et al. Imaging of neutral lipids by oil red O for analyzing the metabolic status in health and disease. Nat Protoc. 2013;8(6):1149–1154.
- Chen K, Dai H, Yuan J, et al. Optineurin-mediated mitophagy protects renal tubular epithelial cells against accelerated senescence in diabetic nephropathy. Cell Death Dis. 2018;9(2):105.
- Wolf P, Winhofer Y, Anderwald CH, et al. Intracellular lipid accumulation and shift during diabetes progression. Wien Med Wochenschr. 2014;164(15-16):320–329.
- Li S, Zheng L, Zhang J, et al. Inhibition of ferroptosis by up-regulating Nrf2 delayed the progression of diabetic nephropathy. Free Radic Biol Med. 2021;162:435–449.
- Yang Q, Wu FR, Wang JN, et al. Nox4 in renal diseases: an update. Free Radic Biol Med. 2018;124:466–472.
- Zhang J, Wang X, Vikash V, et al. ROS and ROS-mediated cellular signaling. Oxid Med Cell Longev. 2016;2016:4350965.
- GBD 2019 Diseases and Injuries Collaborators. Global burden of 369 diseases and injuries in 204 countries and territories, 1990–2019: a systematic analysis for the Global Burden of Disease Study 2019. Lancet. 2020;396(10258):1204–1222.
- Sagoo MK, Gnudi L. Diabetic nephropathy: an overview. Methods Mol Biol. 2020;2067:3–7.
- Zhang D, Ji P, Sun R, et al. Ginsenoside Rg1 attenuates LPS-induced chronic renal injury by inhibiting NOX4-NLRP3 signaling in mice. Biomed Pharmacother. 2022;150:112936.
- Wei X, Chen Y, Huang W. Ginsenoside Rg1 ameliorates liver fibrosis via suppressing epithelial to mesenchymal transition and reactive oxygen species production in vitro and in vivo. Biofactors. 2018.
- Waanders F, van Timmeren MM, Stegeman CA, et al. Kidney injury molecule-1 in renal disease. J Pathol. 2010;220(1):7–16.
- Liu L, Xia R, Song X, et al. Association between the triglyceride-glucose index and diabetic nephropathy in patients with type 2 diabetes: a cross-sectional study. J Diabetes Investig. 2021;12(4):557–565.
- Lu J, Liu X, Jiang S, et al. Body mass index and risk of diabetic nephropathy: a Mendelian randomization study. J Clin Endocrinol Metab. 2022;107(6):1599–1608.
- Sobczak AIS, Blindauer CA, Stewart AJ. Changes in plasma free fatty acids associated with type-2 diabetes. Nutrients. 2019;11(9):2022.
- Liu Y, Li Y, Shen H, et al. Association between the metabolic profile of serum fatty acids and diabetic nephropathy: a study conducted in northeastern China. Ther Adv Endocrinol Metab. 2022;13:20420188221118750.
- Song Y, Sondergaard E, Jensen MD. Unique metabolic features of adults discordant for indices of insulin resistance. J Clin Endocrinol Metab. 2020;105(8):e2753–e2763.
- Chen Q, Su Y, Ju Y, et al. Astragalosides IV protected the renal tubular epithelial cells from free fatty acids-induced injury by reducing oxidative stress and apoptosis. Biomed Pharmacother. 2018;108:679–686.
- Lee M, Zhao H, Liu X, et al. Protective effect of hydroxysafflor yellow A on nephropathy by attenuating oxidative stress and inhibiting apoptosis in induced type 2 diabetes in rat. Oxid Med Cell Longev. 2020;2020:7805393.
- Sun Y, Ge X, Li X, et al. High-fat diet promotes renal injury by inducing oxidative stress and mitochondrial dysfunction. Cell Death Dis. 2020;11(10):914.
- Lee JH, Massague J. TGF-beta in developmental and fibrogenic EMTs. Semin Cancer Biol. 2022;86(Pt 2):136–145.
- Holterman CE, Read NC, Kennedy CR. Nox and renal disease. Clin Sci. 2015;128(8):465–481.
- Munoz M, Lopez-Oliva ME, Rodriguez C, et al. Differential contribution of Nox1, Nox2 and Nox4 to kidney vascular oxidative stress and endothelial dysfunction in obesity. Redox Biol. 2020;28:101330.
- Du Y, Xiao H, Wan J, et al. Atorvastatin attenuates TGF‑beta1‑induced fibrogenesis by inhibiting Smad3 and MAPK signaling in human ventricular fibroblasts. Int J Mol Med. 2020;46(2):633–640.
- Xu Y, Zhang J, Fan L, et al. miR-423-5p suppresses high-glucose-induced podocyte injury by targeting Nox4. Biochem Biophys Res Commun. 2018;505(2):339–345.
- Qi W, Niu J, Qin Q, et al. Glycated albumin triggers fibrosis and apoptosis via an NADPH oxidase/NOX4–MAPK pathway-dependent mechanism in renal proximal tubular cells. Mol Cell Endocrinol. 2015;405:74–83.
- Li R, Guo Y, Zhang Y, et al. Salidroside ameliorates renal interstitial fibrosis by inhibiting the TLR4/NF-kappaB and MAPK signaling pathways. Int J Mol Sci. 2019;20(5):E1103.
- Chen X, Wei W, Li Y, et al. Hesperetin relieves cisplatin-induced acute kidney injury by mitigating oxidative stress, inflammation and apoptosis. Chem Biol Interact. 2019;308:269–278.
- Farkhondeh T, Mehrpour O, Buhrmann C, et al. Organophosphorus compounds and MAPK signaling pathways. Int J Mol Sci. 2020;21(12):E4258.
- Wang H, Che J, Cui K, et al. Schisantherin A ameliorates liver fibrosis through TGF-beta1mediated activation of TAK1/MAPK and NF-kappaB pathways in vitro and in vivo. Phytomedicine. 2021;88:153609.