
Abstract
Background
Diet management is an effective way to retard the progression of chronic kidney disease (CKD). However, very few studies investigated the influence of carbohydrate intake on CKD patients. In this prospective cohort study, the associations between carbohydrate intake and all-cause mortality were investigated in US adult CKD patients.
Methods
Multivariable Cox proportional hazard models and iso-caloric replacement analysis were used to investigate the associations between the macronutrients and the all-cause mortality risk. Total 3683 US adult CKD patients 20 years or older from the National Health and Nutrition Examination Survey (NHANES, 2003–2014) were analyzed (mean age ± SD, 62.4 ± 17.1; 56.5% female), of which 1082 participants with CKD died with a median follow-up time of 67 (IQR 36–99) months.
Results
Most macronutrients were non-linearly associated with all-cause mortality risk, including carbohydrates and sugar. Participants with CKD had lower mortality risk when consuming 30–45% energy from carbohydrates (average HR 0.76, 95%CI 0.62–0.93, compared with 60%), 5–20% energy from sugar (average HR 0.75, 95% CI 0.59–0.96 compared with 40%). Replacing the energy intake from carbohydrates with protein (up to 30%) and/or replacing the sugar with non-sugar carbohydrates (up to 55%) reduced the all-cause mortality risk, while the total energy intake remained constant.
Conclusions
Diet advice should be given according to the current diet status, and constituents of carbohydrates should also be taken into consideration.
Background
An optimal diet is related to a lower risk of several chronic diseases and a longer lifespan [Citation1]. However, the standard of optimal diet has been variable across guidelines. It is widely recognized that a healthy diet involves consuming various foods, but the specific proportions and limits for each category are differently recommended [Citation2]. WHO recommends total fat not exceed 30% of total energy intake and limiting free sugars to less than 10% of total energy intake [Citation3] based on the previous studies [Citation4–6]. Conversely, some studies found that total fat intake was not associated with cardiovascular events and even reduced the mortality risk [Citation7,Citation8]. Controversy also existed regarding carbohydrate intake. Recently, a low carbohydrate diet has become popular in research, as well as in society. More than one meta-analysis of randomized controlled trials (RCTs) demonstrated that low carbohydrate diets helped lose more weight than low-fat diets at six months and effectively reduced cardiovascular disease risks [Citation9–11]. However, the conclusion was reached in individuals with a body mass index (BMI) of at least 25 instead of general populations. A few RCTs observed a consistent effect in longer follow-up periods [Citation12]. A large prospective cohort study, the Prospective Urban Rural Epidemiology (PURE) study, involving 135,335 individuals in 18 countries reported the association of high carbohydrate intake with a higher risk of total mortality [Citation7], but lacked further investigation of the constituents of carbohydrates. In contrast, a recent prospective cohort study including 37,233 adults from the National Health and Nutrition Examination Survey (NHANES, 1999–2014) showed that the quality and source of carbohydrates were associated with mortality risk rather than the low carbohydrate intake [Citation13]. More interestingly, another prospective cohort study of US adults from NHANES (1999–2010) on a low carbohydrate diet reached an opposite conclusion that long-term low carbohydrate diet was associated with overall and cause-specific mortality [Citation14].
The advice on the optimal diet for general populations thus varied between guidelines. The diet strategy for the population with chronic kidney disease (CKD) was even more controversial. With an impaired glomerular filtration rate, the residual renal function is vulnerable to dietary patterns. An optimal diet can effectively prevent CKD from progression [Citation15]. Traditionally, a high-protein diet accelerated renal deterioration by glomerular hyperfiltration and increasing proteinuria [Citation16,Citation17]. Other than the most studied protein intake, a diet with lower phosphate intake [Citation18], supplementation of n–3 polyunsaturated fatty acids [Citation19,Citation20], restriction of salt intake [Citation21] and high intake of fruits, vegetables and fiber [Citation15,Citation22] were recommended for CKD patients. However, the role of carbohydrate intake in CKD progression was poorly studied. The low-fat and low-carbohydrate diet recommended by WHO for the general population [Citation3] made protein the primary energy source, while a low-protein diet was still the dominant guideline for patients with CKD. Therefore, the final proportion of carbohydrates, fat and protein in total energy intake remains to be investigated. It is unknown whether a low carbohydrate diet is appropriate in the CKD population. We conducted a prospective cohort study using data from the NHANES to examine the association between a low carbohydrate diet and all-cause mortality in the CKD population.
Methods
Study design and population
Data from NHANES and National Death Index (NDI) were used in this study. The continuous NHANES collected data in 2-year cycles since 1999, representing the non-institutionalized US national population. The underlying NHANES study protocol was approved by National Center for Health Statistics (NCHS) Ethics Review Board, and written informed consent was obtained from all participants. The NHANES study protocol, study design, and survey, examination, or laboratory data collection protocol are fully described on the NHANES website. The mortality status and follow-up time were obtained from NDI and linked to NHANES data.
All participants who were 20 years or older and completed the first-day dietary interview were included in the study from 6 cycles of the continuous NHANES (2003–2014). Participants who self-reported unusual food consumption and with no mortality status linkage were excluded from the analysis. Extreme dietary intake was defined as too low or too high total energy intake (<800 or >4200 kcal for males, <600 or >3500 kcal for females) and carbohydrate intake (<30% or >70% total energy contribution). Participants with extreme dietary intake were considered potentially unreliable and also excluded from the analysis (Supplementary FigureS 1). CKD was defined as either the estimated glomerular filtration rate (eGFR) <60 mL/min·1.73m2 or the urinary albumin creatinine ratio (ACR) > =30 mg/g. Diabetes mellitus (DM) was defined as previously told by a doctor, now taking insulin, now taking diabetic pills, or HbA1c > 6.5% [Citation23]. Hypertension (HTN) was defined as previously told by a doctor, now taking prescribed medicine for HTN, average systolic blood pressure >140 mmHg, or average diastolic blood pressure >90 mmHg. Smoker was defined as smoking over 100 cigarettes lifetime. Hypercholesterolemia (HCL) was defined as previously told by a doctor, now taking prescribed medicine for HCL, or total cholesterol >5.2 mmol/L (>200 mg/dL).
Low carbohydrate diet
The NHANES dietary intake data were collected from the 24-h dietary recall interview conducted by a qualified interviewer using the Automated Multiple Pass Method (AMPM) at NHANES mobile examination center. The AMPM was a specially designed computer system aiming to collect dietary intake accurately and effectively. Details about how NHANES dietary data was collected for each survey cycle were well described in ‘DR1IFF Doc Files’ under ‘protocol and procedure’ section of the official website. The energy provided by each macronutrient was estimated by multiplying the weight with a converting factor (4 kcal/g for carbohydrate and protein and 9 kcal/g for fat). The total energy intake was the sum of the energy from carbohydrates, protein and fat. The percentage of energy intake from each macronutrient was calculated by dividing the absolute energy intake from each macronutrient by the total energy intake and used to account for the total energy intake bias and represent the diet structure. Participants with a lower percentage of energy from carbohydrates were considered more likely to be on a low-carbohydrate diet. The non-sugar carbohydrate intake was estimated by subtracting sugar intake from the total carbohydrate intake. From here and after, ‘sugar’ means ‘sugar carbohydrate’, ‘carbohydrate’ means ‘the total carbohydrate’. The animal or plant source and amount of protein and fat were determined and calculated using the corresponding version of Food and Nutrient Database for Dietary Studies (FNDDS) and National Nutrient Database for Standard Reference from the U.S Department of Agriculture.
Outcome
All causes of mortality status were retrieved from NDI through 31 December 2015 and linked to the NHANES data as the primary outcome. Follow-up time was defined as the time interval from the time of the 24-h dietary recall interview to the time of death or to 31 December 2015.
Statistical analysis
All analysis was performed following the NHANES analytic guideline. Proper sample weights were constructed while combining six cycles of NHANES data, and incorporated into the analysis to account for the complex survey design and nonresponse. Serum creatinine (mg/dL) values in NHANES 2005–2006 were calibrated using the formula recommended (standard creatinine = −0.016 + 0.978 × uncalibrated creatinine) before the analysis [Citation24]. No further calibration was needed in other cycles. eGFR was calculated using CKD-EPI formula with serum creatinine. Continuous variables were categorized to make them more biologically and/or clinically relevant. Age was divided into 4 categories (20–55yr, 56–69yr, 70–79yr, > =80yr); Poverty income ratio (PIR) was divided into 3 categories (0–1.29, 1.30–3.49, > =3.5); BMI (kg/m2) was divided into 5 categories (<21, 21 to <25, 25 to <30, 30 to <35, > =35); ACR (mg/g) was divided into 3 categories (0 to <30, 30 to <300, > =300); Alcohol consumption (g) was divided into 5 categories (0, >0 to 14, >14 to 28, >28 to 42, >42). Physical activity was assessed by calculating the total metabolic equivalent of task (MET) of leisure time activity in a week (MET·h/week) and divided into four categories (0, >0 to <10.5, 10.5 to <21, > =21) [Citation25]. Angiotensin-converting enzyme inhibitor (ACEI)/angiotensin II receptor blocker (ARB) usage was defined as using at least one type of ACEI/ARB drug. Missing values for PIR and BMI were imputed with median values. All participants from the population with or without CKD was divided into quantiles based on the percentage of energy from carbohydrate and sugar, respectively.
Multivariable Cox proportional hazard models were used to estimate the hazard ratio (HR). To easier determine the mortality risk of an individual in the clinical practice, all participants were divided into quantiles from low to high based on the carbohydrate intake to investigate the mortality risk difference between each group. The significance of HR trend across the carbohydrate intake quantiles was tested using ordered linear regression. In addition, P-splines were incorporated to estimate the non-linear relation between the mortality risk and the macronutrient of interest. The P-spline simplified the knots selection and controlled the fit with the penalty when describing a non-linear relation [Citation26,Citation27]. The continuous variable ‘percentage of energy intake from each macronutrient’ was used as an exposure variable in this analysis and a set of covariates (age, sex, race/ethnicity, PIR, BMI, smoking status, alcohol consumption, physical activity, eGFR, ACR, diabetes, hypertension, ACEI/ARB usage, fiber intake, total energy intake) was adjusted in the fully adjusted model, and a smaller set of covariates (age, sex, race/ethnicity, eGFR, ACR, diabetes, ACEI/ARB usage, fiber intake, total energy intake) was adjusted in the minimum adjusted model. A multivariable nutrient density model with P-splines was used to estimate the non-linear relation between the mortality risk and the isocaloric replacement of carbohydrates and sugar by other macronutrients [Citation28]. When estimating the isocaloric replacement of carbohydrates, all macronutrients were included in the model except carbohydrates, with the same set of covariates adjusted. The ‘isocaloric replacement’ means that the total energy intake remains the same while the source of energy is replaced from carbohydrates with other macronutrients. The rationale of this model is to investigate how mortality risk varies when the diet structure changes. The same procedure was used when sugar was replaced.
A low protein diet is recommended for CKD stage 3–5 patients according to the current guideline. Thus, CKD population was further divided into sub-populations by eGFR (0-59 mL/min·1.73m2) and ACR (> =30 mg/g). The same estimation of the non-linear relation between the HR and the macronutrients of interest was performed in these CKD sub-populations. Unless indicated, the same set of covariates was adjusted in the model. The eGFR and ACR were excluded from the model in subgroup analysis, respectively. Sensitivity analysis was performed in two different ways using the same multivariable Cox proportional hazard models. One by excluding participants who died within 12 months’ follow-up period, the other by including participants who self-reported the 24h-recall dietary data was different from the usual diet. All statistical analysis was performed using R (version 4.0.5), with the package survey (version 4.0).
Results
Characteristics of study subjects
After removing participants with missing mortality status and extreme or unusual diet (Supplementary Figure S1), a total of 19,269 participants were included in the present analysis, including 3683 participants with CKD (mean age ± SD, 62.4 ± 17.1; 56.5% female), of which 1929 participants had reduced eGFR (eGFR < 60 mL/min·1.73m2) and 2359 had albuminuria (ACR > = 30 mg/g). The median follow-up time of participants with CKD was 67 (IQR 36-99) months, and 1082 participants died during this period.
The characteristics of participants with/without CKD are shown by quantiles of carbohydrate intake ( & Supplementary Table S1). Compared with the participants without CKD, the overall participants with CKD were older (mean age ± SD 65.5 ± 17.1 vs 47.2 ± 17.2, p < 0.001) and had more comorbidities (diabetes 32.4% vs 9.7%, p < 0.001; hypertension 72.1% vs 35.3%, p < 0.001; hypercholesterolemia 69.3% vs 57.4%, p < 0.001; congestive heart failure 10.2% vs 1.7%, p < 0.001; myocardial infarction 11.5% vs 2.9%, p < 0.001; stroke 9.5% vs 2.4%, p < 0.001; cancer 17.4% vs 8.5%, p < 0.001). The follow-up time of participants with CKD was shorter (median follow-up time 67 IQR 36-99 months vs 77 IQR 46-110 months, p < 0.001), and more death events were observed in participants with CKD (1082/3683 death vs 946/15586 death, p < 0.001). The dietary structure was similar, except the total energy intake (average ± SD, 1794.0 ± 668.0 kcal/d vs 2065.6 ± 738.4 kcal/d, p < 0.001) and the amount of protein intake (0.9 ± 0.4 g/kg vs 1.1 ± 0.5 g/kg, p < 0.001) of participants with CKD was lower.
In general, compared with the lowest quantile of carbohydrate intake, participants with CKD who were in the highest quantile of carbohydrate intake were more likely to be female, consumed less alcohol, smoked less and had less total energy intake. However, with baseline diabetes, higher poverty income ratio, higher BMI, and ACEI/ARB usage, these CKD participants tend to have less carbohydrate intake (). Moreover, these CKD participants who had lower eGFR or ACR were more likely to consume more carbohydrate. As the carbohydrate intake increased in the participants with CKD, the proportion of sugar intake in carbohydrate intake increased, and the protein and fat intake decreased with the significant contribution from animal source protein or fat. Similar results were observed in participants without CKD (supplementary Table S1).
Table 1. Characteristics of participants with CKD by carbohydrate intake quantiles.
Low carbohydrate diet and mortality
The associations of macronutrients and all-cause mortality in participants with CKD were shown in with the fully adjusted model. Carbohydrate, sugar, and all other macronutrients intake had non-linear associations with all-cause mortality, except that fiber intake was not significantly associated with all-cause mortality. The mortality risk was lower in participants who had 30%-45% energy from carbohydrate (average HR 0.76, 95%CI 0.62-0.93, compared with 60%), 5%-20% energy from sugar (average HR 0.75, 95%CI 0.59-0.96 compared with 40%), 40-50% energy from non-sugar carbohydrate (average HR 0.62, 95%CI 0.45-0.85, compared with 30%), 20%-30% energy from protein (average HR 0.58, 95%CI 0.37-0.91, compared with 5%), 40-45% energy from fat (average HR 0.79, 95%CI 0.66-0.93, compared with 25%). The average HR was calculated by using the spline curves shown in .
Figure 1. Association between percentage energy intake of macronutrients and all-cause mortality in participants with CKD.
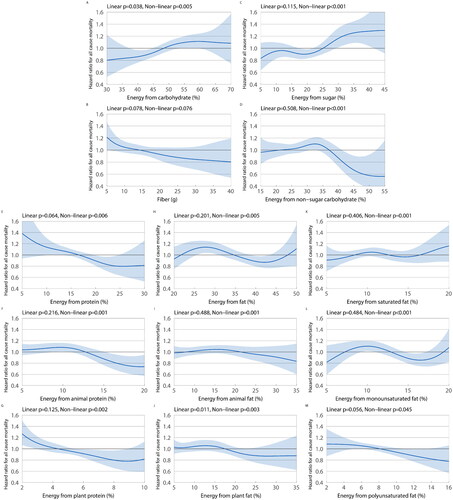
A fully adjusted model (age, sex, race/ethnicity, poverty income ratio, BMI, smoking status, alcohol consumption, physical activity, estimated glomerular filtration rate (eGFR), urinary albumin creatinine ratio (ACR), diabetes, hypertension, ACEI/ARB usage, fiber intake, total energy intake) was used in this analysis. 95% confidence intervals were represented as the shaded area. A-H panels showed the association between the percentage energy intake of different macronutrients and all-cause mortality risk (hazard ratio). P-values for linearity and non-linearity were shown in each panel.
Sensitivity analysis was performed by including participants with CKD who reported that the 24h-recall dietary data was different from the usual diet or excluding participants with CKD who died within 12 months’ follow-up period. Similar non-linear associations between the macronutrients and all-cause mortality were observed in both conditions. However, the carbohydrate was not significantly associated with all-cause mortality when including those who reported unusual diet, and fiber was not significantly associated with all-cause mortality in both conditions (Supplementary Figure S2, S3). The minimum adjusted model was used to perform the same analysis, and the majority of macronutrients had non-linear associations (Supplementary Figure S4).
Participants with CKD were divided into quantiles based on the energy intake from carbohydrate or sugar. A significant trend of increasing all-cause mortality risk was observed from the lowest quantile to the highest quantile of carbohydrate intake in the fully adjusted model. Compared with the lowest quantile (HR 1 as reference), the HRs for each quantile (from low to high) of carbohydrate intake was 1.14 (95%CI 0.89-1.45), 1.23 (95%CI 0.98-1.54), 1.35 (95%CI 1.05-1.72) with a p-value 0.014 for trend; of sugar intake was 0.91 (95%CI 0.70-1.17), 1.00 (95%CI 0.81-1.24), 1.27 (95%CI 1.00-1.62) with a p-value 0.030 for trend (). A 25% increase in energy intake from carbohydrate or sugar was associated with a 24% (HR 1.24; 95%CI 1.04-1.48) or 20% (HR 1.20; 95%CI 1.02-1.42) increase in all-cause mortality risk, respectively.
Table 2. Association between low carbohydrate/sugar diet and all-cause mortality by quantiles in participants with CKD.
Participants with CKD were divided into different subgroups based on the estimated glomerular filtration rate (eGFR) and the urinary albumin creatinine ratio (ACR), and the associations of carbohydrates, sugar, and non-sugar carbohydrates with all-cause mortality in eGFR 0-59 mL/min·1.73m2 group and ACR > =30 mg/g group were shown in with fully adjusted model. Similar to all CKD participants, carbohydrate, sugar, and non-sugar carbohydrate had non-linear associations with all-cause mortality in both subgroups. In eGFR 0-59 mL/min·1.73m2 group, the mortality risk was lower in participants who had 30-45% energy from carbohydrate (average HR 0.68, 95%CI 0.51-0.90, compared with 60%), 5%-20% energy from sugar (average HR 0.64, 95%CI 0.48-0.87, compared with 40%), 40-50% energy from non-sugar carbohydrate (average HR 0.58, 95%CI 0.39-0.85, compared with 30%). In ACR > =30 mg/g group, the mortality risk was lower in participants who had 30-45% energy from carbohydrate (average HR 0.75, 95%CI 0.58-0.96, compared with 55%), 5-10% energy from sugar (average HR 0.74, 95%CI 0.56-0.97, compared with 35%), 40-50% energy from non-sugar carbohydrate (average HR 0.65, 95%CI 0.45-0.93, compared with 30%).
Figure 2. Association between percentage energy intake of macronutrients and all-cause mortality in participants with CKD subgroups (eGFR <60 mL/min·1.73m2; ACR ≥30 mg/g).
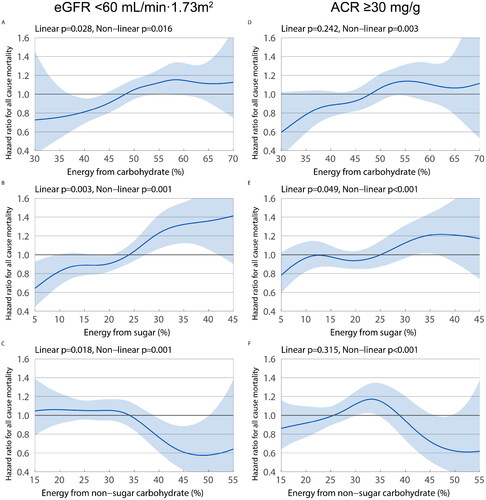
A fully adjusted model (age, sex, race/ethnicity, poverty income ratio, BMI, smoking status, alcohol consumption, physical activity, estimated glomerular filtration rate (eGFR), urinary albumin creatinine ratio (ACR), diabetes, hypertension, ACEI/ARB usage, fiber intake, total energy intake) was used in this analysis. 95% confidence intervals were represented as the shaded area. A-H panels showed the association between the percentage energy intake of different macronutrients and all-cause mortality risk (hazard ratio). P-values for linearity and non-linearity were shown in each panel. Panel A-C subgroup of eGFR <60 mL/min·1.73m2; panel D-F subgroup of ACR ≥30 mg/g.
Iso-caloric replacement of carbohydrate and sugar
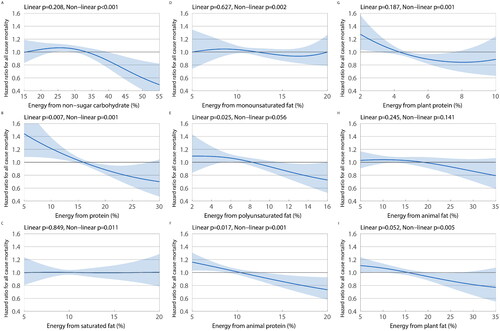
Higher energy intake from carbohydrates, especially sugar, was associated with higher all-cause mortality risk. Thus, an isocaloric replacement was performed to investigate these two macronutrients. Non-linear associations were observed in most replacements. However, the linear association was observed when replacing either carbohydrate or sugar with polyunsaturated fat and no significant association was observed when replacing sugar with animal fat ( and ). The total energy intake remained constant while replacing the energy intake from carbohydrates with protein (up to 30%), animal protein (up to 20%), plant protein (up to 10%), polyunsaturated fat (up to 16%), and plant fat (up to 35%) reduced the all-cause mortality risk (). Similarly, replacing the energy intake from sugar with non-sugar carbohydrates (up to 55%), protein (up to 30%), polyunsaturated fat (up to 16%), animal protein (up to 20%), plant protein (up to 8%), and plant fat (up to 35%) reduced the all-cause mortality risk (). In addition, replacing carbohydrates or sugar with saturated fat did not reduce the all-cause mortality risk ( and ).
Figure 3. Iso-caloric replacement analysis on replacing carbohydrates with other macronutrients in participants with CKD.
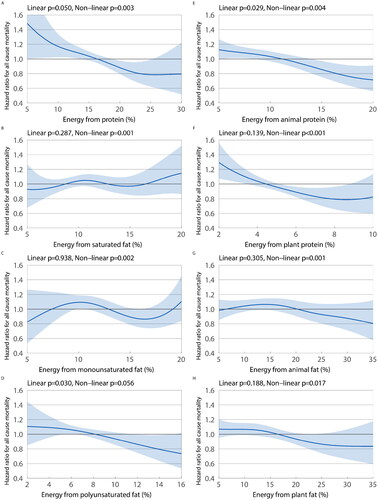
Figure 4. Iso-caloric replacement analysis on replacing sugar with other macronutrients in participants with CKD.
A fully adjusted model (age, sex, race/ethnicity, poverty income ratio, BMI, smoking status, alcohol consumption, physical activity, estimated glomerular filtration rate (eGFR), urinary albumin creatinine ratio (ACR), diabetes, hypertension, ACEI/ARB usage, fiber intake, total energy intake) was used in this analysis. 95% confidence intervals were represented as the shaded area. A-H panels showed the association of all-cause mortality risk (hazard ratio) when replacing the percentage energy intake of carbohydrates with other macronutrients. For example, in panel A replacing 20% of energy intake from carbohydrate with protein lead to lower all-cause mortality risk. P-values for linearity and non-linearity were shown in each panel.
A fully adjusted model (age, sex, race/ethnicity, poverty income ratio, BMI, smoking status, alcohol consumption, physical activity, estimated glomerular filtration rate (eGFR), urinary albumin creatinine ratio (ACR), diabetes, hypertension, ACEI/ARB usage, fiber intake, total energy intake) was used in this analysis. 95% confidence intervals were represented as the shaded area. A-I panels showed the association of all-cause mortality risk (hazard ratio) when replacing the percentage energy intake of sugar with other macronutrients. For example, in panel B, replacing 20% of energy intake from sugar with protein lead to lower all-cause mortality risk. P-values for linearity and non-linearity were shown in each panel.
Discussion
In this study, non-linear associations were observed between carbohydrates (including sugar, non-sugar carbohydrate) and all-cause mortality in participants with CKD. Similar results were found in protein, fat, saturated fat, monounsaturated fat, polyunsaturated fat, animal protein, plant protein, animal fat, and protein fat with all-cause mortality in participants with CKD. These findings were primarily consistent in sensitivity and subgroup analysis. Moreover, we found that the mortality risk was higher as the carbohydrate intake increased and further investigation showed higher sugar intake was associated with a higher mortality risk. We found that replacing carbohydrate intake with protein (including animal and plant protein), polyunsaturated fat, and plant fat reduced the mortality risk.
Similarly, replacing sugar intake with non-sugar carbohydrates, protein (including animal and plant protein), polyunsaturated fat, and plant fat reduced the mortality risk. Here, we demonstrated the variety of associations between macronutrients and all-cause mortality in CKD patients. Unlike many previous studies that only focusing on single macronutrients and linear associations with outcomes, we investigated the non-linear associations of macronutrients and their constituents. We performed the iso-caloric replacement analysis to explore how mortality risk changed according to different dietary patterns in CKD patients.
Linear association of carbohydrate and mortality studies observed conflict results [Citation13,Citation14,Citation29]. Several studies in the general population brought up non-linear associations. A U-shaped association between carbohydrate intake and mortality was found in a large cohort study and meta-analysis [Citation30]. They proposed that both high and low percentages of carbohydrate diets conferred increased mortality risk. A similar non-linear association was reported by a study using the UK Biobank cohort. However, the risk associated with low carbohydrate intake failed to reach significance, and resulting in a J-shaped curve [Citation29]. We found a nearly S-shaped association between carbohydrate intake and all-cause mortality in CKD patients and the mortality risk was higher as the carbohydrate intake increased.
Most previous diet studies in CKD patients focused on protein, and a low-protein diet was generally recommended for CKD patients in clinical practice [Citation31]. Several RCTs and meta-analyses in populations with preexisting kidney disorders supported that a low protein diet played an important role in retarding the progression of CKD and effectively delaying the initiation of dialysis therapy [Citation32–37]. In contrast, the concern of malnutrition, protein-energy waste, and conflict findings on the effectiveness of a low-protein diet leads to debates on the necessity and strategy of adherence to a low-protein diet [Citation38–40]. The effect of a low-protein diet was also influenced by complications such as diabetes [Citation35] and by the source of protein [Citation41]. To meet the daily total energy demand, a low carbohydrate diet, in some aspects, is a high protein or high-fat diet, for example, Atkins and Zone diet [Citation42]. An RCT in 24 pre-diabetes patients showed a high protein diet’s protective effect compared with the high carbohydrate diet [Citation43]. In this study, the amount of protein intake in participants with CKD (0.9 g/kg) was not in the normal low protein diet range (0.6–0.8 g/kg), and replacing carbohydrates with protein up to 30% led to a high protein diet (1.7 g/kg). We observed lower mortality risk with lower carbohydrate intake and reduction in mortality risk when replacing the carbohydrate with protein (including plant and animal protein). Meanwhile, we also found that higher protein intake was associated with lower mortality risk in CKD patients. Several studies also showed that a high-protein diet might be beneficial [Citation44,Citation45]. One possible explanation is that sufficient nutrition is provided with high protein intake which helps to maintain muscle mass. Patients are capable of more physical activity and less likely to be involved in falls and bone fractures with enough muscle strength, which might reduce the mortality risk. Another possible explanation is that high protein intake provides more bioactive peptides. These bioactive peptides were reported to have anti-inflammatory, anti-hypertensive, anti-oxidative, and anti-microbial activities [Citation46–48]. These protective activities might lead to a lower mortality risk. However, the effect of a high protein diet in CKD patients remained controversial, and more long-term and extensive sample-size studies are required [Citation49,Citation50].
The major strength of this study is that we first investigated the association between a low carbohydrate diet and all-cause mortality in CKD patients using the nationally representative NHANES data of US adults, and we did not pre-assume linear association. We also explored specific components and different sources of macronutrients (e.g., sugar, fiber, saturated fat, animal protein) and how the changes in diet pattern would affect the risk of mortality by replacing the carbohydrate or sugar with other macronutrients using the iso-caloric replacement method. However, this study has several limitations. First, non-sugar carbohydrate was calculated by subtracting sugar from carbohydrates to represent the starch because no available information was provided in NHANES dietary data. Second, the iso-caloric replacement is based on the inter-participants comparison and might not represent the diet changes of the individual in actual daily life. Third, the selection bias is possible since the dietary data were all from NHANES and might not represent the population other than US adults. Fourth, as an observational study, causality could not be determined.
Conclusions
Non-linear associations were found between the macronutrients and all-cause mortality risk in CKD patients. Low carbohydrate intake reduces the all-cause mortality risk. Moreover, the different effects of the carbohydrate constituents on all-cause mortality risk were observed in this study. Non-sugar carbohydrates reduced the mortality risk while sugar increased the mortality risk. Thus, dietary advice should be given according to the current diet structure (especially the percentage of carbohydrate intake) and sugar/non-sugar carbohydrates should be considered when adjusting the carbohydrate intake in CKD patients.
Ethics approval and consent to participate
The ethics approval was made by NCHS Research Ethics Review Board (ERB). Details are available at [https://www.cdc.gov/nchs/nhanes/irba98.htm].
Authors’ contributions
QR & YZ & XL designed research; QR & YZ & HL & GC conducted research and analyzed data; YH & KZ & YQ helped with data cleaning and statistical analysis; QR & YZ & HL & GC wrote the manuscript. All authors read and approved the final manuscript.
Supplemental Material
Download PDF (612.9 KB)Disclosure statement
No potential conflict of interest was reported by the author(s).
Availability of data and materials
The datasets analyzed during the current study are available at [https://wwwn.cdc.gov/nchs/nhanes/Default.aspx].
Additional information
Funding
References
- Sotos-Prieto M, Bhupathiraju SN, Mattei J, et al. Association of changes in diet quality with total and Cause-Specific mortality. N Engl J Med. 2017;377(2):1–12.
- Herforth A, Arimond M, Alvarez-Sanchez C, et al. A global review of food-based dietary guidelines. Adv Nutr. 2019;10(4):590–605.
- Organization WH. Healthy diet. 2018. [cited 2021 July 27] https://www.who.int/publications/m/item/healthy-diet-factsheet394.
- Fats and fatty acids in human nutrition. Report of an expert consultation. FAO Food Nutr Pap. 2010;91:1–166.
- Diet, nutrition and the prevention of chronic diseases. World Health Organ Tech Rep Ser. 2003;916i-viii:1–149.
- Jequier E, Bray GA. Low-fat diets are preferred. Am J Med. 2002;113(Suppl 9B):41S–46S.
- Dehghan M, Mente A, Zhang X, et al. Associations of fats and carbohydrate intake with cardiovascular disease and mortality in 18 countries from five continents (PURE): a prospective cohort study. Lancet. 2017;390(10107):2050–2062.
- Howard BV, Van Horn L, Hsia J, et al. Low-fat dietary pattern and risk of cardiovascular disease: the women’s health initiative randomized controlled dietary modification trial. JAMA. 2006;295(6):655–666.
- Nordmann AJ, Nordmann A, Briel M, et al. Effects of low-carbohydrate vs low-fat diets on weight loss and cardiovascular risk factors: a meta-analysis of randomized controlled trials. Arch Intern Med. 2006;166(3):285–293.
- Hession M, Rolland C, Kulkarni U, et al. Systematic review of randomized controlled trials of low-carbohydrate vs. low-fat/low-calorie diets in the management of obesity and its comorbidities. Obes Rev. 2009;10(1):36–50.
- Santos FL, Esteves SS, da Costa Pereira A, et al. Systematic review and meta-analysis of clinical trials of the effects of low carbohydrate diets on cardiovascular risk factors. Obes Rev. 2012;13(11):1048–1066.
- Shai I, Schwarzfuchs D, Henkin Y, et al. Weight loss with a low-carbohydrate, mediterranean, or low-fat diet. N Engl J Med. 2008;359(3):229–241.
- Shan Z, Guo Y, Hu FB, et al. Association of low-carbohydrate and low-fat diets with mortality among US adults. JAMA Intern Med. 2020;180(4):513.
- Mazidi M, Katsiki N, Mikhailidis DP, et al. Lower carbohydrate diets and all-cause and cause-specific mortality: a population-based cohort study and pooling of prospective studies. Eur Heart J. 2019;40(34):2870–2879.
- Kramer H. Diet and chronic kidney disease. Adv Nutr. 2019;10(Suppl_4):S367–S379.
- Friedman AN, Yu Z, Juliar BE, et al. Independent influence of dietary protein on markers of kidney function and disease in obesity. Kidney Int. 2010;78(7):693–697.
- Bernstein AM, Treyzon L, Li Z. Are high-protein, vegetable-based diets safe for kidney function? A review of the literature. J Am Diet Assoc. 2007;107(4):644–650.
- Di Iorio BR, Bellizzi V, Bellasi A, et al. Phosphate attenuates the anti-proteinuric effect of very low-protein diet in CKD patients. Nephrol Dial Transplant. 2013;28(3):632–640.
- Huang X, Lindholm B, Stenvinkel P, et al. Dietary fat modification in patients with chronic kidney disease: n-3 fatty acids and beyond. J Nephrol. 2013;26(6):960–974.
- Miller ER, Juraschek SP, Appel LJ, et al. The effect of n-3 long-chain polyunsaturated fatty acid supplementation on urine protein excretion and kidney function: meta-analysis of clinical trials. Am J Clin Nutr. 2009;89(6):1937–1945.
- D'Elia L, Rossi G, Schiano di Cola M, et al. Meta-analysis of the effect of dietary sodium restriction with or without concomitant renin-angiotensin-aldosterone system-inhibiting treatment on albuminuria. Clin J Am Soc Nephrol. 2015;10(9):1542–1552.
- Krishnamurthy VM, Wei G, Baird BC, et al. High dietary fiber intake is associated with decreased inflammation and all-cause mortality in patients with chronic kidney disease. Kidney Int. 2012;81(3):300–306.
- Mosslemi M, Park HL, McLaren CE, et al. A treatment-based algorithm for identification of diabetes type in the national health and nutrition examination survey. Cardiovasc Endocrinol Metab. 2020;9(1):9–16.
- Selvin E, Manzi J, Stevens LA, et al. Calibration of serum creatinine in the national health and nutrition examination surveys (NHANES) 1988-1994, 1999-2004. Am J Kidney Dis. 2007;50(6):918–926.
- Mendes MA, da Silva I, Ramires V, et al. Metabolic equivalent of task (METs) thresholds as an indicator of physical activity intensity. PLoS One. 2018;13(7):e0200701.
- Eilers PHC, Marx BD. Flexible smoothing with B -splines and penalties. Statist Sci. 1996;11(2):89–121.
- Perperoglou A, Sauerbrei W, Abrahamowicz M, et al. A review of spline function procedures in R. BMC Med Res Methodol. 2019;19(1):46.
- Hu FB, Stampfer MJ, Rimm E, et al. Dietary fat and coronary heart disease: a comparison of approaches for adjusting for total energy intake and modeling repeated dietary measurements. Am J Epidemiol. 1999;149(6):531–540.
- Ho FK, Gray SR, Welsh P, et al. Associations of fat and carbohydrate intake with cardiovascular disease and mortality: prospective cohort study of UK biobank participants. BMJ. 2020;368:m688.
- Seidelmann SB, Claggett B, Cheng S, et al. Dietary carbohydrate intake and mortality: a prospective cohort study and meta-analysis. Lancet Public Health. 2018;3(9):e419–e428.
- Ikizler TA, Burrowes JD, Byham-Gray LD, et al. KDOQI clinical practice guideline for nutrition in CKD: 2020 update. Am J Kidney Dis. 2020;76(3 Suppl 1):S1–S107.
- Levey AS, Adler S, Caggiula AW, et al. Effects of dietary protein restriction on the progression of advanced renal disease in the modification of diet in renal disease study. Am J Kidney Dis. 1996;27(5):652–663.
- Bellizzi V. Low-protein diet or nutritional therapy in chronic kidney disease? Blood Purif. 2013;36(1):41–46.
- Fouque D, Laville M. Low protein diets for chronic kidney disease in non diabetic adults. Cochrane Database Syst Rev. 2009;(3):CD001892.
- Rughooputh MS, Zeng R, Yao Y. Protein diet restriction slows chronic kidney disease progression in non-diabetic and in type 1 diabetic patients, but not in type 2 diabetic patients: a meta-analysis of randomized controlled trials using glomerular filtration rate as a surrogate. PLoS One. 2015;10(12):e0145505.
- Hahn D, Hodson EM, Fouque D. Low protein diets for non-diabetic adults with chronic kidney disease. Cochrane Database Syst Rev. 2018;10:CD001892.
- Rhee CM, Ahmadi S-F, Kovesdy CP, et al. Low-protein diet for conservative management of chronic kidney disease: a systematic review and meta-analysis of controlled trials. J Cachexia Sarcopenia Muscle. 2018;9(2):235–245.
- Ko GJ, Obi Y, Tortorici AR, et al. Dietary protein intake and chronic kidney disease. Curr Opin Clin Nutr Metab Care. 2017;20(1):77–85.
- Klahr S, Levey AS, Beck GJ, et al. The effects of dietary protein restriction and blood-pressure control on the progression of chronic renal disease. Modification of diet in renal disease study group. N Engl J Med. 1994;330(13):877–884.
- Lee SW, Kim Y-S, Kim YH, et al. Dietary protein intake, protein energy wasting, and the progression of chronic kidney disease: analysis from the KNOW-CKD study. Nutrients. 2019;11(1):121.
- Lew Q-LJ, Jafar TH, Koh HWL, et al. Red meat intake and risk of ESRD. J Am Soc Nephrol. 2017;28(1):304–312.
- de Souza RJ, Swain JF, Appel LJ, et al. Alternatives for macronutrient intake and chronic disease: a comparison of the OmniHeart diets with popular diets and with dietary recommendations. Am J Clin Nutr. 2008;88(1):1–11.
- Stentz FB, Brewer A, Wan J, et al. Remission of pre-diabetes to normal glucose tolerance in obese adults with high protein versus high carbohydrate diet: randomized control trial. BMJ Open Diabetes Res Care. 2016;4(1):e000258.
- Naghshi S, Sadeghi O, Willett WC, et al. Dietary intake of total, animal, and plant proteins and risk of all cause, cardiovascular, and cancer mortality: systematic review and dose-response meta-analysis of prospective cohort studies. BMJ. 2020;:m2412.
- Chan R, Leung J, Woo J. High protein intake is associated with lower risk of all-cause mortality in community-dwelling Chinese older men and women. J Nutr Health Aging. 2019;23(10):987–996.
- Nourmohammadi E, Mahoonak AS. Health implications of bioactive peptides: a review. Int J Vitam Nutr Res. 2018;88(5-6):319–343.
- Korhonen H, Pihlanto A. Bioactive peptides: production and functionality. Int Dairy J. 2006;16(9):945–960.
- Chatterjee C, Gleddie S, Xiao C-W. Soybean bioactive peptides and their functional properties. Nutrients. 2018;10(9):1211.
- Kamper AL, Strandgaard S. Long-term effects of high-protein diets on renal function. Annu Rev Nutr. 2017;37:347–369.
- Ko G-J, Rhee CM, Kalantar-Zadeh K, et al. The effects of high-protein diets on kidney health and longevity. J Am Soc Nephrol. 2020;31(8):1667–1679.