
Abstract
Objectives
Membranous nephropathy (MN) and minimal change disease (MCD) are two common types of nephrotic syndrome that have similar clinical presentations but require different treatment strategies. Currently, the definitive diagnosis for these conditions relies on invasive renal biopsy, which can be limited in clinical practice.
Methods
In this study, we aimed to differentiate idiopathic MN (IMN) from MCD using clinical data and gut microbiota. We collected clinical data and stool samples from 115 healthy individuals, 115 IMN, and 45 MCD at the onset of disease and performed 16S rRNA sequencing. Through machine learning methods including random forest, logistic regression, and support vector machine, a classifier to differentiate IMN from MCD was constructed.
Results
Baseline clinical data comparing the IMN and MCD groups showed that the MCD had higher levels of hemoglobin, uric acid, cystatin C, β2-microglobulin, α1-microglobulin, total cholesterol, and low-density lipoprotein and lower levels of albumin and CD4+ T-cell counts. The gut microbiota of the two groups differed at all levels of the phylum and genus. Differential gut microbiota may disturb the integrity of the intestinal wall and lead to the passage of inflammatory mediators through the intestinal barrier, causing kidney injury. We constructed a noninvasive classifier with a discrimination efficacy of 0.939 that combined the clinical data and gut microbiota information to identify IMN and MCD.
Conclusions
The classifier of the gut microbiota combined with clinical indicators has achieved good performance in identifying IMN and MCD, which provides a new approach for the noninvasive discrimination of different pathological types of kidney disease.
Introduction
Nephrotic syndrome is a common clinical manifestation of glomerular disease with various treatment options based on the underlying pathological type [Citation1]. Membranous nephropathy (MN) and minimal change disease (MCD) are the two most common pathological types of nephrotic syndrome, with an incidence of 60% in China [Citation2]. Idiopathic MN (IMN) is a subtype of MN that can be challenging to differentiate from MCD due to their similar clinical presentation. However, early identification of IMN and MCD is crucial as treatment options differ, and the rate of disease progression also varies. In IMN, glucocorticoids alone are not effective, and they need to be used in combination with immunosuppressors. However, most patients with MCD are sensitive to glucocorticoid therapy [Citation3]. At present, the diagnosis of glomerular injury mainly relies on renal biopsy, and differentiation of IMN and MCD is difficult in the absence of renal biopsy. However, because of its invasiveness and limitations, renal biopsy cannot be used to confirm the pathological diagnosis in patients with contraindications. Additionally, in some underserved regions, access to renal biopsy may be limited, making it challenging to diagnose certain kidney conditions. Since Beck et al. discovered the podocyte antigen M-type phospholipase A2 receptor (PLA2R) in 2009, the antibody can be detected in serum and tissue of >70% of IMN patients [Citation4], which is a milestone in the diagnosis of IMN. The detection of serum PLA2R antibodies has played a considerable role in the noninvasive diagnosis and disease monitoring of IMN. The 2021 KDIGO guidelines have pointed out that for PLA2R antibody-positive stable patients, kidney biopsy is not necessary to confirm the diagnosis of MN [Citation5]. Although PLA2R is regarded as an important biological indicator for differentiating IMN from other glomerular diseases, approximately 30% of IMN patients are negative for tissue PLA2R or serum antibodies [Citation6]. However, recent studies have indicated that patients with secondary membranous nephropathy related to hepatitis C, lupus, and tumors may also have elevated PLA2R [Citation7]. Therefore, identifying markers for the noninvasive discrimination between IMN and MCD provides more possibilities for the definitive diagnosis of patients who cannot undergo renal biopsy.
The gut microbiota has been shown to help disease detection, classification, and prediction of clinical prognosis and treatment effects. Notably, studies have shown that IMN patients exhibit higher levels of Fusobacterium and Proteobacteria, but lower levels of Firmicutes than healthy control individuals [Citation8]. Moreover, the gut microbiota of MCD patients has fewer butyrate-producing bacteria [Citation9]. Therefore, we utilized logistic regression, support vector machine, and random forest machine learning models to analyze gut microbiota sequencing data from patients with IMN and MCD and constructed a classifier to differentiate between the two conditions. Additionally, we incorporated clinical data into the classifier to improve the efficiency of the model.
Materials and methods
Patient enrollment and sample collection
We included patients diagnosed with IMN or MCD in the First Affiliated Hospital of Zhengzhou University from January 2019 to December 2019. The inclusion criteria were as follows: adults with IMN/MCD diagnosed for the first time, and IMN/MCD diagnosed by renal biopsy, and no family history of such diseases. The exclusion criteria were as follows: secondary membranous nephropathy, such as MN associated with autoimmune disease, cancer, infection, or drug toxicity; receiving immunosuppressive therapy; on an antibiotic course within the last three months; and digestive system diseases such as diarrhea and constipation. In all, 115 patients with IMN and 45 patients with MCD met the criteria and were included in this study. Stool samples, clinical data, and demographic information were collected. Fecal samples were collected and transported to the biobank within 2 h for storage at −80 °C until analysis.
DNA extraction and gene sequencing
Microbial genomic DNA of stool samples was extracted as described previously [Citation10]. Samples were chemically lysed using buffer [0.1 M phosphate buffer, 4 M guanidine thiocyanate, 5% N-lauroyl sarcosine and 10% N-lauroyl sarcosine (pH 8.0)]. Physical lysis was then performed by incubation at 70° C for 1 h, followed by mechanical lysis by bead beating. DNA was extracted using the EZNA Stool DNA Kit (Omega Biotek, Inc., GA, USA) and stored at −20 °C until further analysis. After DNA quality inspection, the DNA fragments encoding the 16S ribosomal RNA (rRNA) V3–V4 region were amplified by polymerase chain reaction (PCR). PCRs were run in an EasyCycler 96 PCR system (Analytik Jena Corp., AG) based on the following procedure: 3 min at 95 °C followed by 21 cycles of 0.5 min at 94 °C (denaturation), 0.5 min at 58 °C for annealing, and 0.5 min at 72 °C (elongation), with a final extension at 72 °C for 5 min. Sequencing was performed by Shanghai Mobio Company using the MiSeq platform (Illumina Inc., CA, USA).
OTU clustering and taxonomy annotation
UPARSE analysis (version 11 http://drive5.com/uparse/) was used to cluster quality-filtered sequences into unique sequences and quantify representative sequences in the descending order. Sequences were grouped into operational taxonomic units (OTUs) according to their similarity to each other, and the cutoff value for the similarity level was 97%. To obtain the species classification information corresponding to each OTU, the RDP Classifier (version 2.2 http://sourceforge.net/projects/rdp-classifier/) was used to carry out taxonomic analysis on the representative sequences of OTUs with a similarity level of 97%, and at each classification level, namely domain, kingdom, phylum, class, order, family, genus, and species, to count the community composition of each sample.
Bioinformatic analysis
Species accumulation curve was drawn to assess the adequacy of the sample size and evaluate bacterial richness. The α-diversity reflects the richness and diversity of microbial communities by the Ace/Chao index and Shannon/Simpson index. Bacterial taxonomic comparisons at each level between two groups were compared using the Wilcoxon rank sum test. Heatmaps and Venn diagrams were used to show differences in species composition. A random forest plot was used to identify the key distinguishing OTU between IMN and MCD. Principal component analysis (PCA) and principal coordinates analysis (PCoA) displayed differences between different groups. Linear discriminant analysis (LDA) effect size (LEfSe; version 1.0.8) [Citation11] was used to identify microbiota with significantly different effects on sample partitioning. The taxa were considered differential with an LDA cutoff of 2.0 and p < .05. Phylogenetic Investigation of Communities by Reconstruction of Unobserved States (PICRUSt, version 1.1.4) was applied to compare existing 16S rRNA gene sequencing data with microbial reference genome databases of known metabolic functions, thereby enabling the prediction of bacterial metabolic functions.
Statistical analysis
For clinical baseline data, unpaired Student’s t or Mann–Whitney U tests were used for quantitative data and chi-square test analysis was used for qualitative data comparisons. A general linear model (GLM) was employed to assess the differences in the gut microbiota identified by LEfSe. We constructed receiver operating characteristic (ROC) curves to assess the discrimination performance of the classifiers. We performed resampling internal validation by using the bootstrap method. Both IMN and MCD patients were randomized in a 2:1 ratio into a training group and a test group. The training group was used to build the model, and the test group was used to validate the model. The variables related to clinical indicators in constructing the ROC model were selected by the enter method. Gut microbiota-related information using abundance data for differential bacteria in IMN and MCD. ROC curves were plotted and the area under the curve (AUC) was calculated to assess the validation efficiency of the model. In addition to using traditional logistic regression models, we used new machine learning methods including logistic regression, support vector machine, and random forest for classifier development. The R language code is available as supplementary material.
Results
Baseline clinical information of IMN and MCD
We included patients with IMN (n = 115) and MCD (n = 45) diagnosed by renal biopsy in the First Affiliated Hospital of Zhengzhou University from January 2019 to December 2019 and collected their demographic information, clinical data, and stool samples. Detailed baseline information is shown in . There were no significant differences in age, gender, serum creatinine, triglycerides (TG), high-density lipoprotein, estimated glomerular filtration rate, CD8+ T-cell count, or 24-h uric total protein between the two groups (all p > .05). The MCD group had higher levels of hemoglobin (Hb) (p < .001), uric acid (p = .032), cystatin C (p = .048), β2-microglobulin (p = .03), α1-microglobulin (p = .004), total cholesterol (TCHO) (p < .001), and low-density lipoprotein (p < .001) and lower levels of albumin (LDL) (p < .001) and CD4+ T-cell count (p = .001).
Table 1. Baseline characteristics for all patients with IMN and MCD.
Alteration of the gut microbiota and metabolic pathways
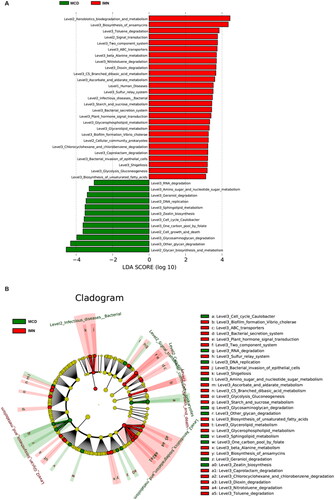
To characterize the gut microbiota of IMN and MCD patients, we sequenced stool samples using 16S rRNA. To compare the overall microbial community structure of the two populations, we first calculated alpha diversity using four different methods, including the algorithms Ace and Chao1 for estimating the number of OTUs contained in a sample and the Shannon and Simpson indices. As shown in , although the four diversity indices showed that IMN had higher alpha diversity, there was no significant difference between the two (all p > .05). To show whether the composition of gut microbiota was affected by pathological types, we performed distance calculations between different stool samples using the abundance information table of OTUs, and then performed PCoA on this basis. The results showed that in the direction of the PC1 and PC2 axes, there was no obvious cluster of gut microbe information in the IMN and MCD groups (). The Venn diagram shows that the total number of identified OTUs is 746, of which 644 are common in both groups and 78 OTUs are unique to IMN (). To identify the differential gut microbes between the two groups, we annotated each OTU obtained by the RDP Classifier and counted the relative abundance of species in each sample at different taxonomic levels. At the phylum level, Proteobacteria was significantly enriched in IMN patients, whereas Bacteroidota was enriched in MCD patients (). At the class level, the IMN group had high Gammaproteobacteria levels and the MCD group had high Bacterodia levels (Figure S1A). The differential bacteria at the order and family levels are shown in and S1B. At the genus level, we found that 27 genera differed between the IMN and MCD groups, of which 15 were significantly enriched in IMN patients () (including Escherichia − Shigella, Enterobacteriaceae_unclassified, Blautia, Romboutsia, Clostridiaceae_Clostridium_sensu_stricto, Anaerostipes, Intestinibacter, Clostridia_UCG − 014, Butyricicoccus, [Eubacterium]_ventriosum_group, Tyzzerella, Kosakonia, Terrisporobacter, [Clostridium]_innocuum_group, and Morganella). Another 12 were significantly enriched in MCD patients (including Bacteroides, [Ruminococcus]_gnavus_group, Parabacteroides, Alistipes, Phascolarctobacterium, Aerococcus, Psychrobacter, Stenotrophomonas, Eisenbergiella, Saccharimonadaceae, Olsenella, and Halomonas). LEfSe was used to estimate the effect magnitude of each OTU abundance on the differential effect (LDA > 3.0, ). Using PICRUST to predict the function of microbiota, we found 32 differential KEGG pathways (LDA > 3.0, ). Twenty-two of these pathways, which included lipid metabolism, carbohydrate metabolism, and xenobiotic metabolism were significantly more abundant in IMN. The remaining 10 pathways were significantly enriched in MCD patients, and these pathways included the metabolism of cofactors and vitamins pathway as well as the nucleic acid synthesis and degradation pathway.
Figure 1. Diversity of gut microbiota for IMN and MCD participants. (A) Ace, (B) Chao, (C) Shannon, and (D) Simpson showed alpha diversity of gut microbiota in two groups. There was no significant difference between the IMN and MCD groups. (E) PCoA plot based on Bray–Curtis dissimilarities did not show obvious cluster of gut microbial information between the IMN and MCD groups. (F) Venn diagram illustrating the overlap of OTUs between the IMN and MCD groups with 644 OTUs shared in both groups, and 78 OTUs unique to the IMN group. IMN: idiopathic membranous nephropathy; MCD: minimal change disease; PCoA: principal coordinates analysis.
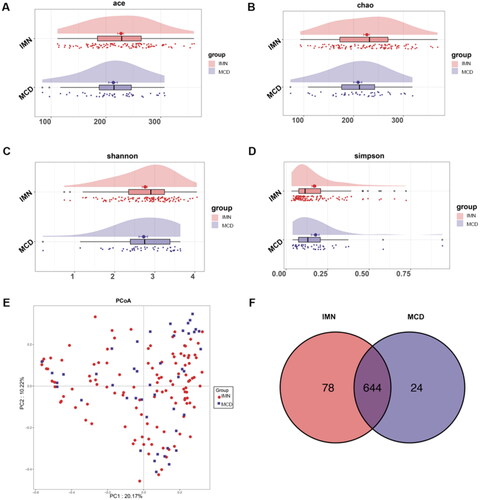
Figure 2. Composition of gut microbes for IMN and MCD participants. (A–C) Differential bacterial display of IMN and MCD at the phylum, order, and genus levels. (D) LEfSe analysis of microbial profiles. IMN: idiopathic membranous nephropathy; MCD: minimal change disease; LDA score: linear discriminant analysis score.
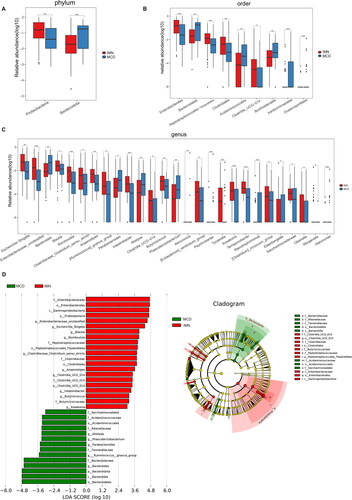
Figure 3. LEfSe analysis of metabolic pathways. Comparison (A) and distribution (B) of KEGG metabolic pathways between IMN and MCD were shown at the taxonomic level by LEfSe analysis. IMN: idiopathic membranous nephropathy; MCD: minimal change disease; LEfSe: linear discriminant analysis effect size; KEGG: Kyoto Encyclopedia of Genes and Genomes.
Construction of IMN and MCD discrimination classifier
To achieve the purpose of noninvasive discrimination of IMN and MCD, we used clinical data and the gut microbiota to construct identification classifiers. By analyzing the clinical data based on the GLMs, five clinical indicators were finally screened, including gender (1.117,15.449), Hb (1.02,1.111), TCHO (3.305,142.501), TG (0.087,0.626), and LDL (0.014,0.442) (). The GLMs were used to assess the differences in these gut microbiota identified by LEfSe, and the screening yielded taxa1 (combined phylum Proteobacteria, class Gammaproteobacteria, order Enterobacterales, family Enterobacteriaceae, genus Enterobacteriaceae_unclassified), taxa2 (combined phylum Bacteroidota, class Bacteroidia, order Bacteroidales, family Bacteroidaceae, genus Bacteroides), and taxa3 (combined phylum Firmicutes, class Clostridia, class Negativicutes, genus Romboutsia, genus Butyricicoccus, genus Phascolarctobacterium). We calculated the classification power of each taxon as well as the combined gut microbiota taxa to discriminate IMN from MCD. The combined taxa model (Model) showed the best discriminative power (). In addition, we also used the screened clinical indicators and gut microbiota to construct three classifiers. The respective AUCs were 0.821 and 0.881. Finally, we considered the baseline clinical data and gut microbiota as input variables, and a classifier for discriminating IMN and MCD was constructed by logistic regression. Participants were randomly divided into training (n = 112, nIMN=78, nMCD=34) and test (n = 48, nIMN=37, nMCD=11) cohorts in a 2:1 ratio. The combined model showed the best discriminative performance (), with an AUC greater than 0.85 in both the training set and test set. The AUC in the training set was 0.939 (cutoff value: 0.371, sensitivity of 0.925, specificity of 0.839). In the test set, the AUC was 0.857 (cutoff: 0.500, sensitivity of 1.000, specificity of 0.714). Given the significant difference in sample size between the MCD and IMN groups, we also calculated AUPRC and found it to be 0.889 and 0.848 in the training and test sets, respectively. shows the importance of each indicator in the model, and the results showed that the most important indicator was the variable LDL, followed by the family Bacteroidaceae.
Figure 4. ROCs for IMN participants in the training group. (A) The discriminative power of each classifier for identifying IMN and MCD in training group. Model 1: clinical index, Model 2: gut microbiota, Model 3: the model combining with clinical index and gut microbiota. (B) The importance of each indicator in the model. ROC: receiver operating characteristic curve; IMN: idiopathic membranous nephropathy; TCHO: total cholesterol; LDL: low density lipoprotein; Hb: hemoglobin; TG: triglycerides.
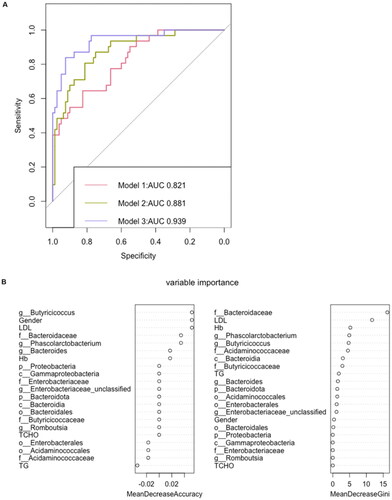
Table 2. Identification of potential risk factors in IMN and MCD by univariate and multivariate regression analyses.
Table 3. The AUC and sensitivity and specificity at Youden’s cutoff to identify IMN participants.
IMN and MCD prediction with other machine-learning classifiers
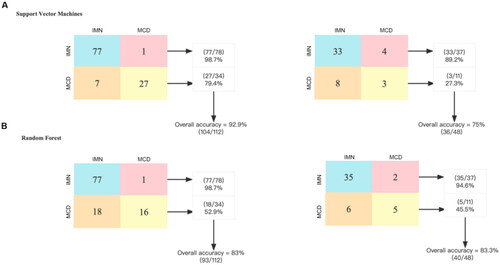
To verify the discrimination performance of the combined model, we used different methods of constructing classifiers to discriminate between IMN and MCD. Through support vector machines, we found that the combined identification ability of the clinical indicators and gut microbiota was 92.9% in the training group and 75% in the test group (). Through random forest analysis, it was 83% in the training group and 83.3% in the test group ().
Figure 5. Performance evaluation of different classifiers to discriminate IMN from MCD. A total of 16 bacteria and 5 clinical data at baseline were included in the construction of the classifier. The confusion matrix of the classifier constructed by support vector machine shows that its accuracy is 92.9% in the training group and 75% in the test group. The confusion matrix of the classifier constructed by random forest shows that its accuracy is 83% in the training group and 83.3% in the test group. IMN: idiopathic membranous nephropathy, MCD: minimal change disease.
Validation of the IMN and MCD discrimination model
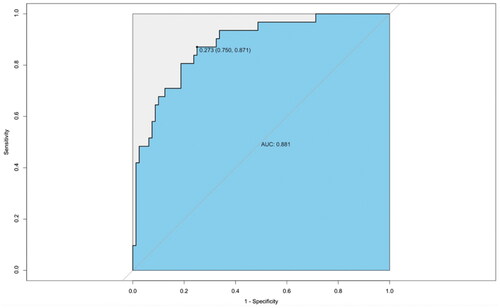
We first verified the effectiveness of our model in distinguishing MCD from PLA2R-positive and PLA2R-negative IMNs using gut microbiota and clinical data (). The model achieved good discriminatory performance for both types of identification, with AUCs of 0.932 (cutoff value: 0.373, sensitivity of 0.842, and specificity of 0.889) and 0.932 (cutoff value: 0.698, sensitivity of 0.974, and specificity of 0.778), respectively. Second, we analyzed the gut microbiota of 115 sex and age-matched healthy control (HC) individuals and found significant differences in the gut microbiota among the HC, MCD, and IMN patients, and the gut microbiota status of MCD patients was between that of HC and IMN patients (). Notably, the abundance of Bacteroides, Faecalibacterium, and Blautia were decreased in patients with nephrotic syndrome, while those of Escherichia-Shigella and Enterobacteriaceae_unclassified were found to be increased. Finally, we analyzed the gut microbiota of another center (Jinan, Shandong, China), which included 10 IMN patients and 10 MCD patients, and the gut microbiota model achieved an AUC of 0.881 for discrimination between the two groups ().
Figure 6. Validation of model discriminative efficacy in IMN (PLA2R-positive and PLA2R-negative, respectively) and MCD. (A) Verification of the effectiveness of the gut microbiota and clinical data (Model 3) in discriminating between PLA2R-positive IMN and MCD showed an AUC of 0.932. (B) Verification of the effectiveness of the gut microbiota and clinical data (Model 3) in discriminating between PLA2R-negative IMN and MCD showed an AUC of 0.932. IMN: idiopathic membranous nephropathy; MCD: minimal change disease.
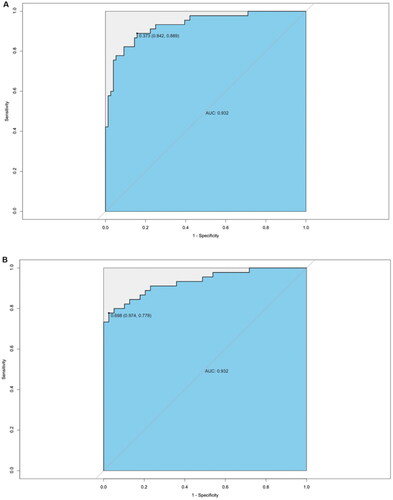
Figure 7. Distinctive gut microbiota in healthy controls, IMN, and MCD patients. (A) Differential bacteria at phylum level in HC, IMN, and MCD. (B) Differential bacteria at class level in HC, IMN, and MCD. (C) Differential bacteria at genus level in HC, IMN, and MCD. HC: healthy control; IMN: idiopathic membranous nephropathy; MCD: minimal change disease.
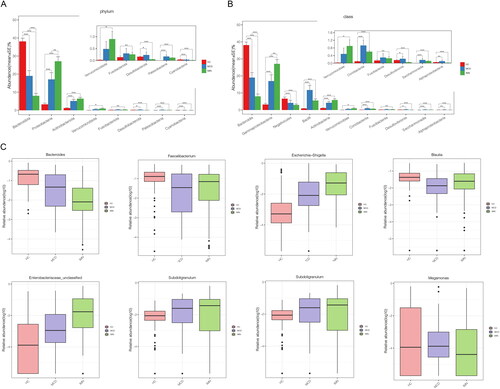
Figure 8. Validation of the gut microbiota discrimination models using external samples. The effectiveness of the identification model was verified using the gut microbiota of 10 IMNs and 10 MCDs from another center (Jinan, Shandong, China), achieving an AUC of 0.881.
Correlation between the gut microbiota and T cells in IMN and MCD
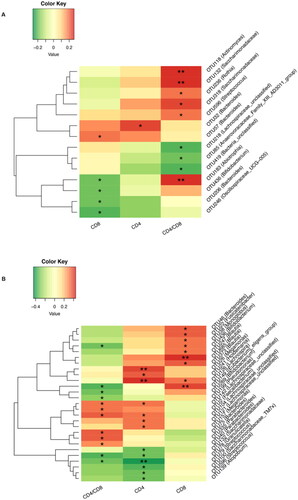
Studies have suggested that the pathogenesis of IMN and MCD is closely related to immunity. To further explore whether the gut microbiota plays a mediating role, we analyzed the correlation between the gut microbiota and CD4+ and CD8+ T-cell counts (). Our results showed that in IMN patients, Bacteroides and CD4+ were positively correlated (Spearman r = 0.222), and Oscillospiraceae_UCG − 005 was negatively correlated with CD8+ (Spearman r= −0.206). In MCD patients, Blautia (Spearman r = 0.412) and [Eubacterium]_eligens_group (Spearman r = 0.401) were positively correlated with CD8+, Lachnospira was positively correlated with CD4+ (Spearman r = 0.445), and Streptococcus was negatively correlated with CD4+ (Spearman r= −0.419).
Figure 9. Correlation between gut microbiota and T-cell count. (A) Correlation analysis was performed to investigate the relationship between gut microbiota and CD4 and CD8 T-cell counts in patients with IMN. (B) Correlation analysis was performed to investigate the relationship between gut microbiota and CD4 and CD8 T-cell counts in patients with MCD. *p < .05, **p <.01.
Discussion
In this study, we characterized the gut microbiota in patients with IMN and MCD, and further constructed a noninvasive classifier to distinguish IMN and MCD by using the gut microbiota and clinical data. 16S rRNA analysis showed that Escherichia-Shigella, Enterobacteriaceae_unclassified, and Kosakonia, three genera belonging to the phylum Proteobacteria, were significantly enriched in IMN patients, and Bacteroides were significantly enriched in MCD patients. By leveraging microbiome data and clinical information, we successfully developed a classifier to differentiate IMN from MCD and investigated the potential underlying mechanisms.
Noninvasive differential classifiers have previously been studied in a variety of diseases. In renal disease, discriminative models have been constructed for DKD and DM and for malignancy-associated MN and IMN [Citation12–14]. These studies only used clinical indicators to construct the model and just used logistic regression to evaluate the performance of the model, with a discrimination efficacy of mostly <0.9. Previous studies have also constructed discrimination models of chronic kidney disease and healthy controls (HCs), and diabetes and HCs only based on differential gut microbiota, with an efficiency of approximately 0.95 [Citation15,Citation16]. Studies have shown that models combining multiple indicators including the gut microbiota, host immune markers, and clinical and demographic data have higher discrimination performance than single indicators in rheumatoid arthritis, Alzheimer’s disease, and Clostridium difficile infection [Citation17–19]. We have previously constructed a discriminative model for PLA2R-negative IMN and MCD by logistic regression, with a discrimination efficacy of 0.904, with only clinical indicators but no gut microbiota [Citation20]. In this study, we found significant differences between the IMN and MCD groups in both the clinical parameters and gut microbiota. Combined with the above studies, we expect that IMN and MCD can be classified based on the gut microbiota and clinical data. For a more comprehensive validation of our model, we verified the performance through different machine-learning methods including logistic regression, support vector machines, and random forest plots.
Changes in the gut microbiota can be used to differentiate diseases. Studies have shown that the balance of the gut microbiota in IMN patients is not only different from that of healthy people but also different from that of patients with other types of kidney diseases, such as IgA nephropathy [Citation21–23]. Our study shows that Proteobacteria is significantly enriched in IMN patients, and this finding is consistent with that of previous studies [Citation8,Citation24]. At the genus level, Escherichia-Shigella, Enterobacteriaceae_unclassified, and Kosakonia, three genera belonging to Proteobacteria, were significantly enriched in IMN patients. Our previous study showed that at the genus level, Escherichia-Shigella and Enterobacteriaceae_unclassified were significantly increased, while Bacteroides, Faecalibacterim, and Prevotella were markedly lower in IMN patients than in HC individuals [Citation25]. The study by Dong et al. is in agreement with ours, as this study showed a significant enrichment of the pathogenic bacteria Escherichia-Shigella in IMN patients [Citation23]. When compared with HC or MCD patients, IMN patients showed an increase in Escherichia-Shigella and Enterobacteriaceae_unclassified, thereby suggesting that an increase in these two genera may be characteristic of IMN. However, it has been documented that there is also a characteristic increase in Escherichia-Shigella in IgA patients, and the genus can be apparently restored to normal levels after disease remission [Citation26]. Escherichia-Shigella was markedly increased in IgA patients compared to HC individuals, but it was not significantly different when IgA patients were compared to IMN patients, suggesting that Escherichia-Shigella may be associated with some common mechanism leading to IgA and IMN [Citation23]. Escherichia-Shigella is a gram-negative bacterium that is known for its proinflammatory properties. It has been shown to release various inflammatory mediators, which are significantly elevated in autoimmune-related kidney diseases such as IMN and IgA nephropathy. Moreover, studies have demonstrated that Escherichia-Shigella can compromise the integrity of the intestinal barrier, resulting in the leakage of inflammatory mediators across the intestinal barrier. Therefore, the relationship between Escherichia-Shigella and immunity needs to be further investigated. Previously, when we performed comparisons between IMN and HC, Kosakonia did not differ significantly between the two populations. Differences between IMN and MCD may be caused by a decrease in Kosakonia in MCD rather than an increase in IMN. Kosakonia was initially considered a plant pathogen and was only subsequently identified as a pathogen in patients with acute cholecystitis receiving immunosuppressive therapy. Significant increases in Kosakonia were also found in the saliva of patients with small bowel inflammation [Citation27–29]. Therefore, the relationship between MCD and Kosakonia is worthy of further study. The abundance of Bacteroides, a proven beneficial bacterium, was found to be significantly reduced in IMN compared to MCD. The microbiota profile of MCD appeared to be intermediate between that of IMN and healthy controls, which may be attributed to the rapid onset and shorter course of MCD. As a result, the gut microbiota of MCD patients may be closer to that of HC. In contrast, IMN has a slow onset and a prolonged course, leading to significant changes in gut microbiota composition.
Lipid levels differed between the IMN and MCD groups, not only in terms of clinical indicators but also in terms of KEGG metabolic pathway enrichment analysis. Of the five clinical indicators used to construct the classifier, three were related to blood lipids, namely TCHO, TG, and LDL. A comparison of baseline levels showed that TCHO, TG, and LDL were higher in MCD than in IMN. Analysis of the KEGG metabolic pathway showed that IMN samples were was richer in lipid pathways such as glycerolipid metabolism, glycerophospholipid metabolism, unsaturated fatty acid biosynthesis, and glycolysis pathways, than those of MCD. On the one hand, it may be related to the difference in blood lipid levels in baseline data of our two groups, i.e., TCHO and LDL were lower in the IMN group than in the MCD group (p < .001). On the other hand, it is possible that the difference in metabolism of gut microbiota between the two groups caused changes in blood lipid levels. Some previous studies have also suggested that gut microbiota and blood lipid levels are indeed related. Fecal microbiota transplantation has shown that gut microbiota is causally related to individual lipid metabolic levels [Citation30].
Our study examined the association between the gut microbiota and T cells in patients with IMN and MCD. These results are consistent with previous research showing that the gut microbiota can modulate the immune system. The gut microbiota-T cell combination may play a role in the pathogenesis of MCD or IMN, as immune system dysregulation is thought to contribute to the development and progression of these diseases. Further mechanistic studies are needed to explore the potential mechanisms underlying these findings.
Interestingly, the gut microbiota of IMN patients significantly enhanced the degradation of various xenobiotics such as toluene, chlorocyclohexane, and chlorobenzene. Previous studies have shown that the incidence of IMN may be related to PM2.5 and environmental pollution [Citation31]. At present, some IMN-specific antigens have been discovered, but it is still unclear why the immune tolerance of these self-antigens is disturbed. Therefore, we believe that the metabolism of foreign environmental substances by the gut microbiota as well as the relationship between gut microbiota-derived antigens and the pathogenesis of IMN will be an interesting topic for future research.
IMN and MCD are the two main causes of nephrotic syndrome. Because of their similar clinical features, the current gold standard for identification and distinction is still renal biopsy. However, renal biopsy is invasive and has some contraindications. Finding new distinguishing indicators is hence of great significance for guiding clinical treatment.
In conclusion, we constructed a classifier for IMN and MCD discrimination by combining the gut microbiota and clinical data with a discrimination efficacy of 0.939, providing a new idea for further noninvasive discrimination of different pathological types of kidney disease.
Limitations of the study
Our study has some limitations. First, due to the limitation of the sample number, a larger cohort is required to verify the performance of the classifier. Second, the metabolic pathway-related information used in this study was obtained by KEGG enrichment analysis of gut microbiota sequencing. It may be more meaningful to use targeted metabolomics. Third, in addition to the factors we considered in our study, such as age and gender, it is important to note that diet is a significant confounding factor in the development and progression of IMN and MCD. Unfortunately, we did not collect data on the dietary patterns of the patients included in our study. However, as all patient samples were collected from Central China, where the diet structure is relatively similar, it may be reasonable to assume that the impact of diet on our study findings is likely minimized to some extent. Nonetheless, individual differences in dietary patterns cannot be fully ruled out. Therefore, future studies should consider incorporating data on dietary patterns to better understand the role of diet in the pathogenesis of IMN and MCD.
Ethics statement
This study was approved by the Ethics Committee of the First Affiliated Hospital of Zhengzhou University (2021-KY-818 and 2021-KY-838).
Author contributions
ZZ and YJ designed the study. YJ and TW drafted the paper. TW, HL and GY collected the data. LW, RG and YZ collected the stool samples. TW, WY, FW analyzed the data and made the figures. ZZ, TW and YJ revised the paper. All authors approved the final version of the manuscript.
Supplemental Material
Download PDF (183.9 KB)Acknowledgments
All of the human samples were obtained from the Biobank of the First Affiliated Hospital of Zhengzhou University and National Human Genetic Resources Sharing Service Platform (Grant No. 2005DKA21300).
Disclosure statement
No potential conflict of interest was reported by the author(s).
Data availability statement
The datasets presented in this study can be found in online repositories. The names of the repositories and accession numbers are as follows: https://www.ncbi.nlm.nih.gov/, PRJNA752445 and PRJNA832071.
Additional information
Funding
References
- Orth SR, Ritz E. The nephrotic syndrome. N Engl J Med. 1998;338(17):1–14.
- Ng JK-C, Ma TK-W, Lai FM-M, et al. Causes of nephrotic syndrome and nephrotic-range proteinuria are different in adult Chinese patients: a single centre study over 33 years. Nephrology. 2018;23(6):565–572.
- Floege J, Amann K. Primary glomerulonephritides. Lancet. 2016;387(10032):2036–2048.
- Beck LH, Bonegio RGB, Lambeau G, et al. M-type phospholipase A2 receptor as target antigen in idiopathic membranous nephropathy. N Engl J Med. 2009;361(1):11–21.
- Rovin BH, Adler SG, Barratt J, et al. Executive summary of the KDIGO 2021 guideline for the management of glomerular diseases. Kidney Int. 2021;100(4):753–779.
- Dai P, Campbell D, Culican S, et al. Validation of phospholipase a receptor direct immunofluorescence staining in the diagnosis of primary membranous glomerulonephritis. Pathology. 2020;52(5):546–551.
- Larsen CP, Messias NC, Silva FG, et al. Determination of primary versus secondary membranous glomerulopathy utilizing phospholipase A2 receptor staining in renal biopsies. Mod Pathol. 2013;26(5):709–715.
- Zhang J, Luo D, Lin Z, et al. Dysbiosis of gut microbiota in adult idiopathic membranous nephropathy with nephrotic syndrome. Microb Pathog. 2020;147:104359.
- Tsuji S, Kaneko K. The long and winding road to the etiology of idiopathic nephrotic syndrome in children: focusing on abnormalities in the gut microbiota. Pediatr Int. 2021;63(9):1011–1019.
- Godon JJ, Zumstein E, Dabert P, et al. Molecular microbial diversity of an anaerobic digestor as determined by small-subunit rDNA sequence analysis. Appl Environ Microbiol. 1997;63(7):2802–2813.
- Segata N, Izard J, Waldron L, et al. Metagenomic biomarker discovery and explanation. Genome Biol. 2011;12(6):R60.
- Jiang S, Fang J, Yu T, et al. Novel model predicts diabetic nephropathy in type 2 diabetes. Am J Nephrol. 2020;51(2):130–138.
- Cheng Y, Shang J, Liu D, et al. Development and validation of a predictive model for the progression of diabetic kidney disease to kidney failure. Ren Fail. 2020;42(1):550–559.
- Wang T, Yu W, Wu F, et al. Construction of a nomogram discriminating malignancy-associated membranous nephropathy from idiopathic membranous nephropathy: a retrospective study. Front Oncol. 2022;12:914092.
- Ren Z, Fan Y, Li A, et al. Alterations of the human gut microbiome in chronic kidney disease. Adv Sci. 2020;7(20):2001936.
- Zhao X, Zhang Y, Guo R, et al. The alteration in composition and function of gut microbiome in patients with type 2 diabetes. J Diabetes Res. 2020;2020:8842651.
- Sheng C, Yang K, He B, et al. Combination of gut microbiota and plasma amyloid-β as a potential index for identifying preclinical Alzheimer’s disease: a cross-sectional analysis from the SILCODE study. Alzheimers Res Ther. 2022;14(1):35.
- Ke S, Pollock NR, Wang X-W, et al. Integrating gut microbiome and host immune markers to understand the pathogenesis of infection. Gut Microbes. 2021;13(1):1–18.
- Gupta VK, Cunningham KY, Hur B, et al. Gut microbial determinants of clinically important improvement in patients with rheumatoid arthritis. Genome Med. 2021;13(1):149.
- Wu F, Zhang Y, Cui W, et al. Development and validation of a discrimination model between primary PLA2R-negative membranous nephropathy and minimal change disease confirmed by renal biopsy. Sci Rep. 2021;11(1):18064.
- Lu Q, Stappenbeck TS. Local barriers configure systemic communications between the host and microbiota. Science. 2022;376(6596):950–955.
- Miyauchi E, Shimokawa C, Steimle A, et al. The impact of the gut microbiome on extra-intestinal autoimmune diseases. Nat Rev Immunol. 2023;23(1):9–23.
- Dong R, Bai M, Zhao J, et al. A comparative study of the gut microbiota associated with immunoglobulin a nephropathy and membranous nephropathy. Front Cell Infect Microbiol. 2020;10:557368.
- Li M, Wei L, Sun J, et al. Association of gut microbiota with idiopathic membranous nephropathy. BMC Nephrol. 2022;23(1):164.
- Shang J, Zhang Y, Guo R, et al. Gut microbiome analysis can be used as a noninvasive diagnostic tool and plays an essential role in the onset of membranous nephropathy. Adv Sci. 2022;9(28):e2201581.
- Zhao J, Bai M, Ning X, et al. Expansion of in gut is associated with the onset and response to immunosuppressive therapy of IgA nephropathy. J Am Soc Nephrol. 2022;33(12):2276–2292.
- Petrzik K, Brázdová S, Krawczyk K. Novel viruses that lyse plant and human strains of Kosakonia cowanii. Viruses. 2021;13(8):1418.
- Berinson B, Bellon E, Christner M, et al. Identification of Kosakonia cowanii as a rare cause of acute cholecystitis: case report and review of the literature. BMC Infect Dis. 2020;20(1):366.
- Chen M, Fan H-N, Chen X-Y, et al. Alterations in the saliva microbiome in patients with gastritis and small bowel inflammation. Microb Pathog. 2022;165:105491.
- Wang Z, Koonen D, Hofker M, et al. Gut microbiome and lipid metabolism: from associations to mechanisms. Curr Opin Lipidol. 2016;27(3):216–224.
- Xu X, Wang G, Chen N, et al. Long-Term exposure to air pollution and increased risk of membranous nephropathy in China. J Am Soc Nephrol. 2016;27(12):3739–3746.