
Abstract
The incidence of acute myocardial infarction (AMI) in hemodialysis (HD) patients is high and the prognosis is extremely poor. However, the potential connection between HD and AMI, and its regulatory mechanisms remain unclear. In this study, the gene expression profiles of HD (GSE15072) and AMI (GSE66360) were downloaded from the Gene Expression Omnibus database, common differentially expressed genes (DEGs) were obtained using the limma R package, the biological functions were analyzed according to Gene Ontology (GO) and Kyoto Encyclopedia of Genes and Genomes (KEGG) analyses, machine learning was conducted to identify hub genes. Receiver operating characteristic curves and gene set enrichment analyses were used to explore the characters and biological function of hub genes, networks were used for candidate identification of transcription factor (TF), microRNA (miRNA), and drug. After a total of 255 common DEGs were selected, GO and KEGG analyses indicated that neutrophil extracellular trap (NET) may be a potential connection between HD and AMI, LILRB2, S100A12, CYBB, ITGAM, and PPIF were finally identified as hub genes. The area under curve of LILRB2, S100A12, and PPIF was higher than 0.8 in both datasets. Networks show the relationship between hub genes, TF, and miRNA, also the relationship between potential drugs and protein. In conclusion, NETs may be the potential connection between AMI and HD. The potential hub gene, signaling pathways, and drugs provided by this study may contribute to future AMI prevention and intervention in HD patients.
Introduction
Chronic kidney disease has become a global public health problem, with the number of kidney failure patients receiving kidney replacement therapy exceeding 2.5 million and expected to double to 5.4 million by 2030 [Citation1,Citation2]. Cardiovascular disease is the leading cause of death in patients with dialysis-dependent kidney failure, approximately 30% of hospitalizations and nearly 50% of deaths in hemodialysis (HD) patients are attributable to cardiovascular causes [Citation3,Citation4]. Although patients with comorbid HD and AMI are now receiving more invasive treatments and medications than in the past, their 1-year survival has not improved significantly as a result of these measures [Citation5]. In recent years, AMI has been identified as a core outcome measure of CVD in HD patients by some international academic organizations [Citation6,Citation7]. However, the potential connection between HD and AMI is remaining unclear.
Neutrophil extracellular traps (NETs) were first discovered as a novel immune defense mechanism of neutrophils [Citation8], but they can also mediate tissue injury and sterile inflammation [Citation9]. The process by which NETs are secreted by neutrophils is called NETosis, which is a form of inflammatory cell death of neutrophils that differs from common apoptosis and necrosis. When NETosis occurs, DNA strands extruded by activated or dead neutrophils are enhanced by various protein mediators to form a reticular structure with DNA as the main component [Citation10]. Evidence accumulated in the past 20 years has shown that immune disorders played decisive roles in the initiation and development of the coronary artery disease (CAD) pathology process [Citation11]. As one of the most important mechanisms, our view of thrombosis and atherosclerosis has changed significantly along with the emergence of NETs [Citation9,Citation12].
Although NETs have been shown to be strongly associated with AMI in several cardiovascular studies, the relationship between NETs and HD is still unclear. Our study attempts to analyze the potential association between HD and AMI through bioinformatics methods and confirm the important role NETs play in.
Materials and methods
Data source
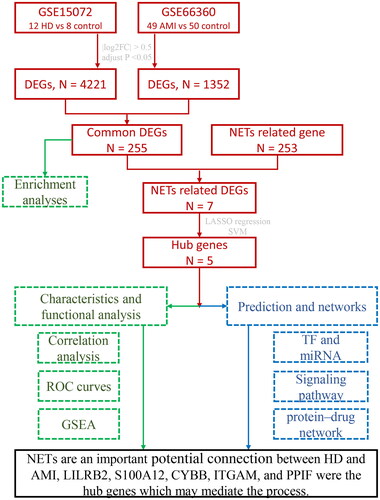
We searched the GEO for related gene expression datasets, using HD and AMI as keywords, in human whole or partial blood samples. If there are multiple datasets that satisfy the above conditions, the dataset with a larger sample size and a larger number of differentially expressed genes (DEGs) is selected. Ultimately, GSE15072 and GSE66360 were selected. summarizes the work flow of data collection and analysis.
Figure 1. Research design flow chart.
Data processing and DEG screening
Quantile normalization of the two datasets was completed using the preprocessCore R package, and DEGs were identified using the limma R package. Only genes with a log2-fold change (FC) > 0.5 and adjusted p < 0.05 were selected. The up- and downregulated DEGs of the two datasets were intersected to obtain the common up- and down-regulated DEGs.
Enrichment analyses and identification of NET-related DEG
Gene Ontology (GO) and Kyoto Encyclopedia of Genes and Genomes (KEGG) are databases of gene-related functions stored based on different taxonomic idea. GO database divides the functions of genes into three parts: cellular component (CC), molecular function (MF), and biological process (BP). KEGG is a database that integrates genomic, chemical, and phylogenetic functional information, for understanding high-level functions and utilities of the biological system, such as the cell, the organism, and the ecosystem, from genomic and molecular-level information.
We performed enrichment analyses. For this, the clusterProfiler R package was used for GO and KEGG analyses, and an adjusted p < 0.05 was used as the cutoff criterion.
The pathway of human NET formation in the KEGG database, including 190 genes (https://www.kegg.jp/pathway/hsa04613) and 69 NET-related genes, was recently identified [Citation13]. After merging the two gene sets and de-duplicating them, 235 NET-related genes were obtained. The intersection of NET-related genes and DEGs was taken as NET-related DEGs.
Machine learning and identification of hub gene
Least absolute shrinkage and selection operator (LASSO) and support vector machine (SVM) are two different algorithms that are often used in machine learning. LASSO is a linear regression model that enables variable selection and regularization when having high-dimensional datasets. The advantages of LASSO include better handling of multivariate problems, overfitting problems, and sparsity problems. SVM is a widely used classification and regression algorithm that classifies or predicts training samples by dividing them into different hyperplanes. The advantages of SVM include better classification ability for nonlinear problems and better generalization ability compared to other algorithms.
We used LASSO regression and SVM to further narrow down the number of NET-related DEGs. The glmnet R package was used for LASSO regression and the kernlab R package was used for SVM. After LASSO regression and SVM processing, four gene sets were obtained; genes that appeared in at least three gene sets were defined as hub genes. The randomForest R package was used to perform random forest analysis on hub genes in the two datasets, to obtain gene importance rankings and for visualization.
Characteristics and functional analysis of hub genes
Correlation analyses between the hub genes were performed using circlize R package, and receiver operating characteristic (ROC) curves of the hub genes were plotted using the pROC R package.
Next, since GSE66360 is cell sequencing data, we evaluated immune cell infiltration in GSE48060 using the ssGSEA function of the GSVA R package. The ggplot2 R package was used to visualize the correlations between immune cells, the expression differences in immune cells between groups, and the correlations between hub genes and immune cells.
Based on the top 50 genes which were positively correlated with hub genes, gene set enrichment analysis (GSEA) using Reactome database was performed, and the ridge plot was used to show the top 20 pathways.
Prediction and network
The Regnetwork database (https://regnetworkweb.org) was used to predict upstream transcription factors (TFs) and micro-RNAs (miRNAs) for hub genes, and the network was plotted by cytoscape software.
SPEED2 is a signaling pathway enrichment analysis tool, it was used to enrich the pathways that may regulate the hub genes. A bar graph shows the effect size and the chi-square test was used to show an increase/decrease in variance of the rank distribution.
NetworkAnalyst online tool (https://www.networkanalyst.ca/) was used to predict potential drugs that target protein of hub genes, and construct a protein–drug network.
Results
Quantile normalization and DEG identification
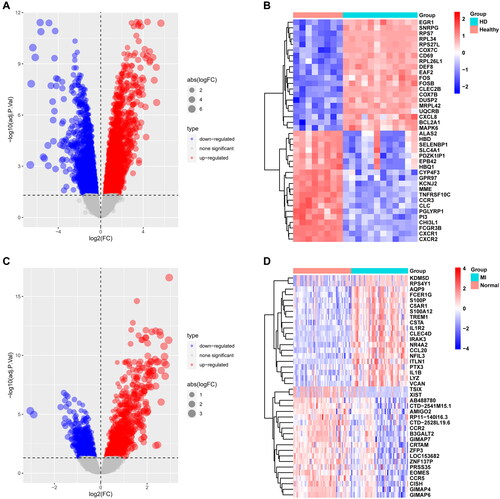
The GSE15072 dataset contains 17 HD patients and 8 healthy subjects. The GSE66360 dataset contains 49 AMI patients and 50 healthy subjects. After quantile normalization of the gene expression matrix in the two datasets (Supplement Figure 1), 4221 DEGs were identified from GSE15072, including 2190 upregulated and 2031 downregulated genes, and 1352 DEGs were identified from GSE66360, including 777 upregulated and 575 downregulated genes ().
Figure 2. Differentially expressed gene identification. A, B from GSE15072, C, D from GSE66360. The volcano plots (A, C) show that 4221 and 1352 DEGs were identified from the two datasets, and the heatmaps (B, D) show the top 20 up and downregulated genes, respectively. Upregulated genes are in light red; downregulated genes are in light blue.
Enrichment analyses of DEG intersections
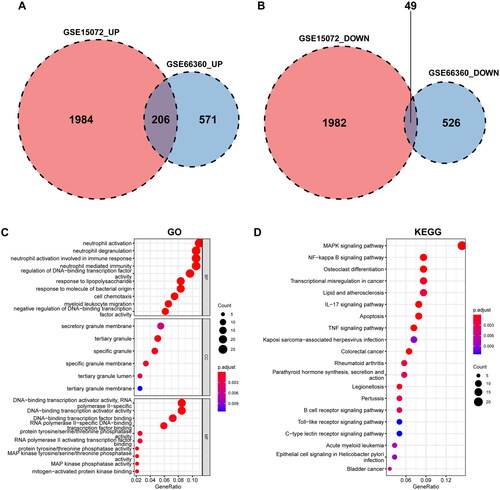
Intersections of the up and downregulated DEGs of the two datasets were performed separately to obtain 206 upregulated and 49 downregulated genes (). To analyze the biological functions and pathways involved in the 255 common DEGs, GO and KEGG pathway enrichment analyses were performed. In the GO enrichment analysis, in BP terms, genes were significantly enriched in neutrophil activation (p = 2.11E-9), neutrophil degranulation (p = 5.55E-9), and neutrophil activation involved in the immune response (p = 6.25E-9) (), suggests that the potential connection may be neutrophil-related. In the KEGG enrichment analysis, genes were significantly enriched in the MAPK signaling pathway (p = 1.54E-8), NF-kappa B signaling pathway (p = 4.74E-8), and osteoclast differentiation (p = 4.78E-7) ().
Figure 3. Identification of DEGs and enrichment analyses with common DEGs. The Venn diagrams of up- and downregulated DEGs of GSE15072 and GSE66360 show an overlap of 206 and 49 genes, respectively (A, B). Results of GO and KEGG pathway enrichment analysis (C, D). An adjusted p value < 0.05 was considered significant.
NET-related DEGs
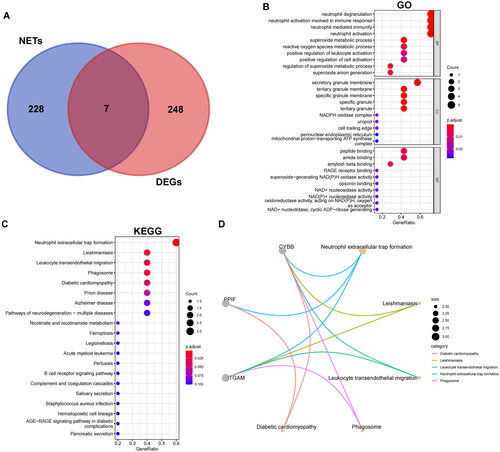
Intersections of the 235 NET-related genes and 255 DEGs were performed to obtain 7 NET-related DEGs (). In the GO enrichment analysis, in BP terms, genes were significantly enriched in neutrophil degranulation (p = 2.22E-7), neutrophil activation involved in the immune response (p = 2.29E-7), and neutrophil mediated immunity (p = 2.55E-7) (). In the KEGG enrichment analysis, genes were significantly enriched in NET formation (p = 8.46E-5), leishmaniasis (p = 6.83E-4), and leukocyte transendothelial migration (p = 1.49E-3), the top 5 pathways involved three genes: CYBB, PPIF, and ITGAM ().
Figure 4. Identification and enrichment analyses of NET-related DEGs. The Venn diagrams show an overlap of 7 genes (A). Results of GO and KEGG pathway enrichment analysis (B, C). An adjusted p value < 0.05 was considered significant. Top 5 pathways of KEGG and the genes they contained (D).
The expression of NET-related genes in GSE15072 and GSE66360 are also shown in the volcano plot and heat map (Supplement Figure 2(A–D)). All seven NET-related DEGs showed the same trend in both datasets: compared to healthy controls, gene expression was higher in the disease group (Supplement Figure 2(E,F)).
Identification of hub gene
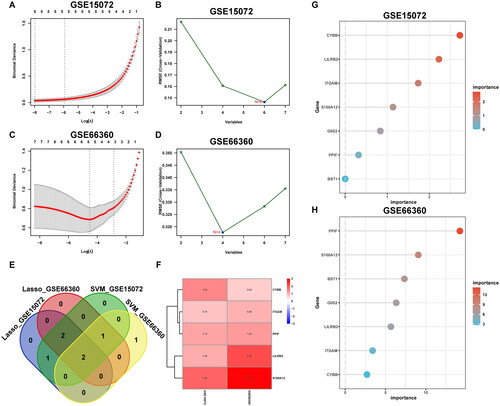
We used LASSO regression and SVM methods in GSE15072 and GSE66360, respectively, to obtain four gene sets, and we defined genes that appeared in at least three gene sets as hub genes: LILRB2, S100A12, CYBB, ITGAM, and PPIF (). They were all upregulated in the disease groups in the two datasets (). CYBB, LILRB2, and ITGAM were the most important NETs-related DEGs in GSE15072, the importance was 2.72, 2.23, and 1.73, respectively (), while PPIF, S100A12, and BST1 were the top three in GSE66360, the importance was 14.23, 9.07, and 7.35, respectively ().
Figure 5. Selection of hub genes. LASSO regression (A, C) and SVM (B, D) of GSE15072 and GSE66360. In the Venn diagrams, five genes appear at least three times in the four gene sets (E), which are all upregulated in the two datasets. LogFC of hub genes between groups are displayed (F). The importance of seven NET-related DEGs (G, H). SVM: support vector machine.
Characteristics and functional analysis of hub genes
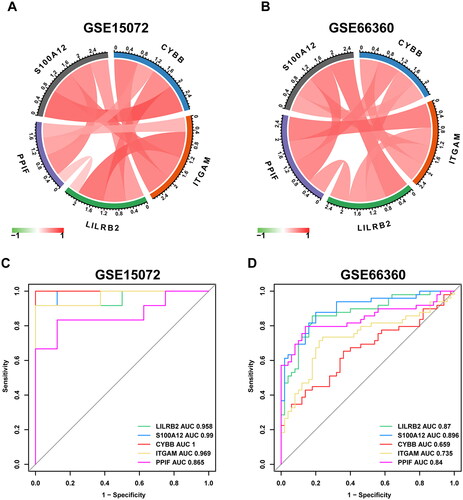
In both datasets, each hub gene was significantly and positively correlated with the others (), indicating that the hub genes had a significant functional similarity. To further validate the diagnostic value of hub genes, we used ROC analysis in HD and AMI database, respectively. LILRB2 (AUC: 0.958 and 0.87), S100A12 (AUC: 0.99 and 0.896), CYBB (AUC: 1 and 0.659), ITGAM (AUC: 0.969 and 0.735), and PPIF (AUC: 0.865 and 0.84), suggesting that the above hub genes had good classification ability for HD and AMI ().
Figure 6. Correlation analysis between hub genes and ROC curves of hub genes. Correlation analysis between hub genes (A, B); red symbolizes positive and green symbolizes negative correlation, and darker color means stronger correlation. ROC curve and AUC of each hub gene (C, D).
The immune infiltration association between AMI patients and healthy controls was investigated further using ssGSEA. The correlation between immune cells in peripheral blood were complex and extensive (Supplement Figure 3(A)), compared to healthy controls, AMI patients had significantly higher neutrophils, in addition to significantly higher monocytes, immature dendritic cell, myeloid-derived suppressor cells, macrophage, type 17 T helper cell, and significantly lower type 2 T helper cell (Supplement Figure 3(B)). Among the 5 hub genes, PPIF, LILRB2, ITGAM, and S100A12 were significantly and positively correlated with neutrophil (Supplement Figure 3(C)), confirm that these hub genes are closely associated with the level of neutrophil infiltration.
To better understand the role of hub genes in AMI, after the top 50 genes in dataset which positively associated with hub genes were obtained (Supplement Figure 4), GSEA was performed for each hub gene, neutrophil degranulation ranked first in LILRB2, S100A12, CYBB, and PPIF (Supplement Figure 5).
Prediction and network establish
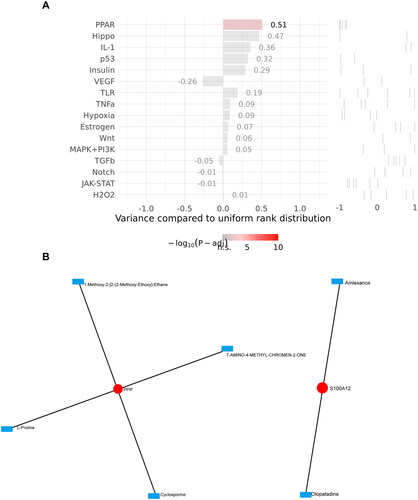
Using the Regnetwork database, we finally identified 14 TFs and 22 miRNAs upstream of 4 hub genes (). Analysis based on SPEED2 database suggested that PPAR signaling pathway was the most important pathway that may affect the hub genes (; Supplement Table 1). To search for potential drugs, we established a protein–drug network of hub genes using the NetworkAnalyst. There are four drugs to which PPIF can bind, two for S100A12, and no available data for the remaining hub genes ().
Figure 7. Network between transcription factors, miRNAs, and hub genes. Red indicates hub genes, and blue indicates transcription factors and miRNAs.
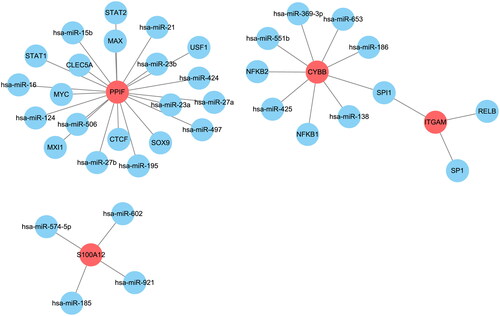
Figure 8. Prediction of signaling pathways and protein-drug network. Enrichment analysis of upstream signal pathway, shown in order of significance (A). The protein–drug network (B).
Discussion
A growing number of studies have demonstrated possible connections between various diseases in recent years [Citation14–16]. Interactions between different diseases are therefore a highly promising field that needs to be investigated in the future. In this study, we found that NETs are an important connection between HD and AMI, LILRB2, S100A12, CYBB, ITGAM, and PPIF were identified as hub genes. Subsequently, we explored the characteristics and function of hub genes, and their relationship with immune infiltration; upstream TFs, miRNAs, and signaling pathways were also predicted, protein–drug network of hub genes was used to provided references for possible therapeutic drugs.
It is well known that kidney failure is one of the risk factors for CVD, the risk for cardiovascular death is 30 times higher in kidney failure patients than in the general population [Citation17,Citation18]. Some investigators have attributed the high incidence of AMI in HD patients mainly to the pathological changes in the coronary artery structure (characterized by arterial wall stiffening and calcification in the media layer) [Citation19]; however, this does not fully explain the unusually high incidence of AMI in HD patients. In addition to the traditional common risk factors for CAD, such as diabetes and hypertension, patients with kidney failure are also exposed to other nontraditional, uremia-related cardiovascular disease risk factors, including inflammation, oxidative stress, endothelial function disturbances, dyslipidemia, and abnormal calcium-phosphorus metabolism [Citation20–23]. Many of these are important causative agents for NETs, particularly oxidative stress. Reactive oxygen species (ROS) have been thought to play a central role in NETosis [Citation9]. Our study also confirms that NETs are more active in peripheral blood of HD patients.
Several studies have confirmed that AMI triggers a strong inflammatory response, mainly manifested by inflammatory cell infiltration, especially monocyte/macrophage infiltration [Citation24,Citation25]. ITGAM, also known as CD11B, is a member of the CD11 antigen-like family, responsible for encoding the α M subunit of Mac-1. ITGAM regulates neutrophil migration activation and apoptosis, and has been used as a marker of neutrophil to confirming the important role of them in AMI [Citation25,Citation26]. Notably, the long-term intradialytic contact of blood with large-surface artificial materials during the HD procedure leads to leukocyte activation, oxidative stress activation, and elevated ITGAM expression [Citation26–28], which is related to the dialysis membrane material and its biocompatibility.
In addition to ITGAM, the RAGE ligand S100A12 on macrophages, lymphocytes, and endothelial cells has also been shown to be closely associated with AMI [Citation29] and HD [Citation30]. Plasma S100A12 levels in STEMI patients increase within 30 min of onset and peak 1–2 h after symptom onset, its peak level is a strong predictor of AMI prognosis [Citation31,Citation32]. In the HD population, S100A12 has also been shown to be significantly associated with atherosclerosis and cardiovascular outcomes [Citation30]. Circulating S100A12 is elevated in CKD 5 patients and HD patients, and increased concentrations are associated with cardiovascular event incidence [Citation33], aortic calcification [Citation34], and risk of death [Citation35,Citation36] and is even considered an independent predictor of increased risk of death in dialysis patients [Citation37].
Among the other three hub genes, LILRB2 is a protein-coding gene located in a gene cluster in chromosomal region 19q13.4 and is a member of the leukocyte immunoglobulin-like receptor family. The mRNA levels of ILRB2 are significantly upregulated in AMI patients compared to stable angina patients [Citation38], and its high expression is associated with poor outcome [Citation39] and is considered a potential biomarker for AMI [Citation39,Citation40]. CYBB is expressed in cardiomyocytes, fibroblasts and endothelial cells and is able to promote cardiac superoxide production. In animal models of AMI and patients with end-stage heart failure, CYBB expression was significantly increased in infarcted myocardium [Citation41,Citation42], and CYBB knockout mice exhibited reduced myocardial apoptosis and poor remodeling after myocardial infarction [Citation43,Citation44]. PPIF, the gene encoding the peptidyl prolyl-cis-trans isomerase CypD in the mitochondrial matrix, is closely related to heart failure, especially post-infarction heart failure. Animal experiments have shown that after infarction, mice lacking CypD have lower mortality, smaller infarct size, better preserved left ventricular systolic function, and experience less adverse left ventricular remodeling [Citation45].
This study also has some limits. First, we have not yet validated the results due to the difficulty of obtaining samples. It is well known that the prognosis of HD patients with a cardiovascular event is extremely poor, At the beginning of this century, AMI patients with HD usually receive less invasive than non-HD patients [Citation46,Citation47], and data from recent years suggest even with the addition of invasive tests, the prognosis for these patients remains poor [Citation5]. For various reasons, many HD patients with AMI abandoned invasive tests such as percutaneous coronary intervention (PCI). In the other hand, elevated markers of myocardial infarction (cardiac troponin I, cardiac troponin T, etc.) are common in HD patients and cannot be used as definitive evidence for the diagnosis of AMI. To ensure the rigor of the validation, we plan to collect blood samples from HD patients with PCI-confirmed AMI, within 24 h of infarction. We are working to collect additional samples for future clinical validation. Second, there are many known risk factors for AMI, including diabetes, smoking, hyperlipidemia, etc., which may be potential confounding factors, but current sequencing data do not control for these factors, also the dataset analyzed in this study lacks for information [Citation48]; therefore, our results need more datasets with sound clinical information for validation in the future.
In conclusion, NETs are an important potential connection between HD and AMI; it may explain the high incidence of AMI in HD patients from a new perspective (Supplement Figure 6). In this study, we provide potential hub genes (LILRB2, S100A12, CYBB, ITGAM, and PPIF), signaling pathways, and drugs, which might contribute to the prevention and treatment of AMI in HD patients in the future.
Supplemental Material
Download PDF (25.7 KB)Supplemental Material
Download PDF (1.1 MB)Disclosure statement
No potential conflict of interest was reported by the author(s).
Data availability statement
The data that support the findings of this study are openly available in Gene Expression Omnibus at https://www.ncbi.nlm.nih.gov/geo/, reference number: GSE15072, GSE66360, and GSE48060.
Additional information
Funding
References
- Collaboration GCKD. Global, regional, and national burden of chronic kidney disease, 1990–2017: a systematic analysis for the Global Burden of Disease Study 2017. Lancet. 2020;395:1–11.
- Liyanage T, Ninomiya T, Jha V, et al. Worldwide access to treatment for end-stage kidney disease: a systematic review. Lancet. 2015;385(9981):1975–1982.
- Saran R, Robinson B, Abbott KC, et al. US renal data system 2019 annual data report: epidemiology of kidney disease in the United States. Am J Kidney Dis. 2020;75(1):A6–A7.
- Siga MM, Ducher M, Florens N, et al. Prediction of all-cause mortality in haemodialysis patients using a Bayesian network. Nephrol Dial Transplant. 2020;35(8):1420–1425.
- Szummer K, Lindhagen L, Evans M, et al. Treatments and mortality trends in cases with and without dialysis who have an acute myocardial infarction: an 18-Year nationwide experience. Circ Cardiovasc Qual Outcomes. 2019;12(9):e005879.
- O’Lone E, Viecelli AK, Craig JC, et al. Establishing core cardiovascular outcome measures for trials in hemodialysis: report of an international consensus workshop. Am J Kidney Dis. 2020;76(1):109–120.
- O’Lone E, Howell M, Viecelli AK, et al. Identifying critically important cardiovascular outcomes for trials in hemodialysis: an international survey with patients, caregivers and health professionals. Nephrol Dial Transplant. 2020;35(10):1761–1769.
- Brinkmann V, Reichard U, Goosmann C, et al. Neutrophil extracellular traps kill bacteria. Science. 2004;303(5663):1532–1535.
- Hidalgo A, Libby P, Soehnlein O, et al. Neutrophil extracellular traps: from physiology to pathology. Cardiovasc Res. 2022;118(13):2737–2753.
- Doring Y, Libby P, Soehnlein O. Neutrophil extracellular traps participate in cardiovascular diseases: recent experimental and clinical insights. Circ Res. 2020;126(9):1228–1241.
- Libby P. The changing landscape of atherosclerosis. Nature. 2021;592(7855):524–533.
- Laridan E, Martinod K, De Meyer SF. Neutrophil extracellular traps in arterial and venous thrombosis. Semin Thromb Hemost. 2019;45(1):86–93.
- Zhang Y, Guo L, Dai Q, et al. A signature for pan-cancer prognosis based on neutrophil extracellular traps. J Immunother Cancer. 2022;10(6):e004210.
- Yan C, Niu Y, Wang X. Blood transcriptome analysis revealed the crosstalk between COVID-19 and HIV. Front Immunol. 2022;13:1008653.
- Zhang D, Wang M, Zhang Y, et al. Novel insight on marker genes and pathogenic peripheral neutrophil subtypes in acute pancreatitis. Front Immunol. 2022;13:964622.
- Su W, Zhao Y, Wei Y, et al. Exploring the pathogenesis of psoriasis complicated with atherosclerosis via microarray data analysis. Front Immunol. 2021;12:667690.
- Jadoul M, Thumma J, Fuller DS, et al. Modifiable practices associated with sudden death among hemodialysis patients in the dialysis outcomes and practice patterns study. Clin J Am Soc Nephrol. 2012;7(5):765–774.
- Pun PH, Smarz TR, Honeycutt EF, et al. Chronic kidney disease is associated with increased risk of sudden cardiac death among patients with coronary artery disease. Kidney Int. 2009;76(6):652–658.
- Makar MS, Pun PH. Sudden cardiac death among hemodialysis patients. Am J Kidney Dis. 2017;69(5):684–695.
- Sarnak MJ, Amann K, Bangalore S, et al. Chronic kidney disease and coronary artery disease: JACC state-of-the-Art review. J Am Coll Cardiol. 2019;74(14):1823–1838.
- do Sameiro-Faria M, Ribeiro S, Costa E, et al. Risk factors for mortality in hemodialysis patients: two-year follow-up study. Dis Markers. 2013;35(6):791–798. 8.[24347
- Pereira R, Costa E, Goncalves M, et al. Neutrophil and monocyte activation in chronic kidney disease patients under hemodialysis and its relationship with resistance to recombinant human erythropoietin and to the hemodialysis procedure. Hemodial Int. 2010;14(3):295–301.
- Costa E, Rocha S, Rocha-Pereira P, et al. Neutrophil activation and resistance to recombinant human erythropoietin therapy in hemodialysis patients. Am J Nephrol. 2008;28(6):935–940.
- Seropian IM, Toldo S, Van Tassell BW, et al. Anti-inflammatory strategies for ventricular remodeling following ST-segment elevation acute myocardial infarction. J Am Coll Cardiol. 2014;63(16):1593–1603.
- Naruko T, Ueda M, Haze K, et al. Neutrophil infiltration of culprit lesions in acute coronary syndromes. Circulation. 2002;106(23):2894–2900.
- Huang S, Sandholm K, Jonsson N, et al. Low concentrations of citrate reduce complement and granulocyte activation in vitro in human blood. Clin Kidney J. 2015;8(1):31–37. 7.
- Liakopoulos V, Jeron A, Shah A, et al. Hemodialysis-related changes in phenotypical features of monocytes. Sci Rep. 2018;8(1):13964.
- Stavroulopoulos A, Petras D, Kakavas I, et al. Monocyte expression of adhesion molecules during low- and high-flux polysulfone hemodialysis and the effect of atorvastatin administration. Blood Purif. 2010;29(3):274–279.
- Xie J, Luo C, Mo B, et al. Inflammation and oxidative stress role of S100A12 as a potential diagnostic and therapeutic biomarker in acute myocardial infarction. Oxid Med Cell Longev. 2022;2022:2633123.
- Korucu B, Yeter H, Gonen S, et al. Impact of medium cut-off membranes on S100A12 and soluble receptor for advanced glycation end products. Semin Dial. 2023;36(3):193–200.
- Zhang X, Cheng M, Gao N, et al. Corrigendum: utility of S100A12 as an early biomarker in patients with ST-Segment elevation myocardial infarction. Front Cardiovasc Med. 2022;9:840102.
- Grauen Larsen H, Yndigegn T, Marinkovic G, et al. The soluble receptor for advanced glycation end-products (sRAGE) has a dual phase-dependent association with residual cardiovascular risk after an acute coronary event. Atherosclerosis. 2019;287:16–23.
- Shiotsu Y, Mori Y, Nishimura M, et al. Plasma S100A12 level is associated with cardiovascular disease in hemodialysis patients. Clin J Am Soc Nephrol. 2011;6(4):718–723.
- Choi BH, Ro H, Jung ES, et al. Circulating S100A12 levels are associated with progression of abdominal aortic calcification in hemodialysis patients. PLoS One. 2016;11(2):e0150145.
- Shiotsu Y, Mori Y, Nishimura M, et al. Prognostic utility of plasma S100A12 levels to establish a novel scoring system for predicting mortality in maintenance hemodialysis patients: a two-year prospective observational study in Japan. BMC Nephrol. 2013;14:16.
- Nakashima A, Carrero JJ, Qureshi AR, et al. Effect of circulating soluble receptor for advanced glycation end products (sRAGE) and the proinflammatory RAGE ligand (EN-RAGE, S100A12) on mortality in hemodialysis patients. Clin J Am Soc Nephrol. 2010;5(12):2213–2219.
- Isoyama N, Leurs P, Qureshi AR, et al. Plasma S100A12 and soluble receptor of advanced glycation end product levels and mortality in chronic kidney disease stage 5 patients. Nephrol Dial Transplant. 2015;30(1):84–91.
- Yan W, Song H, Jiang J, et al. Characteristics of B cell associated gene expression in patients with coronary artery disease. Mol Med Rep. 2016;13(5):4113–4121.
- Wang Y, Zhang X, Duan M, et al. Identification of potential biomarkers associated with acute myocardial infarction by weighted gene coexpression network analysis. Oxid Med Cell Longev. 2021;2021:5553811.
- Wu Y, Jiang T, Hua J, et al. Integrated Bioinformatics-Based analysis of hub genes and the mechanism of immune infiltration associated with acute myocardial infarction. Front Cardiovasc Med. 2022;9:831605.
- Heymes C, Bendall JK, Ratajczak P, et al. Increased myocardial NADPH oxidase activity in human heart failure. J Am Coll Cardiol. 2003;41(12):2164–2171.
- Krijnen PA, Meischl C, Hack CE, et al. Increased Nox2 expression in human cardiomyocytes after acute myocardial infarction. J Clin Pathol. 2003;56(3):194–199.
- Grieve DJ, Byrne JA, Siva A, et al. Involvement of the nicotinamide adenosine dinucleotide phosphate oxidase isoform Nox2 in cardiac contractile dysfunction occurring in response to pressure overload. J Am Coll Cardiol. 2006;47(4):817–826.
- Looi YH, Grieve DJ, Siva A, et al. Involvement of Nox2 NADPH oxidase in adverse cardiac remodeling after myocardial infarction. Hypertension. 2008;51(2):319–325.
- Lim SY, Hausenloy DJ, Arjun S, et al. Mitochondrial cyclophilin-D as a potential therapeutic target for post-myocardial infarction heart failure. J Cell Mol Med. 2011;15(11):2443–2451.
- Sarnak MJ, Levey AS, Schoolwerth AC, et al. Kidney disease as a risk factor for development of cardiovascular disease: a statement from the American heart association councils on kidney in cardiovascular disease, high blood pressure research, clinical cardiology, and epidemiology and prevention. Circulation. 2003;108(17):2154–2169.
- Workgroup KD. K/DOQI clinical practice guidelines for cardiovascular disease in dialysis patients. Am J Kidney Dis. 2005;45(3):S1–S153.
- Granata S, Zaza G, Simone S, et al. Mitochondrial dysregulation and oxidative stress in patients with chronic kidney disease. BMC Genomics. 2009;10:388.