
 ?Mathematical formulae have been encoded as MathML and are displayed in this HTML version using MathJax in order to improve their display. Uncheck the box to turn MathJax off. This feature requires Javascript. Click on a formula to zoom.
Abstract
Objective
The brain neuromechanism in maintenance hemodialysis patients (MHD) with cognitive impairment (CI) remains unclear. The study aimed to probe the relationship between spontaneous brain activity and CI by using resting-state functional magnetic resonance imaging (rs-fMRI) data.
Methods
Here, 55 MHD patients with CI and 28 healthy controls were recruited. For baseline data, qualitative data were compared between groups using the χ2 test; quantitative data were compared between groups using the independent samples t-test, ANOVA test, Mann–Whitney U-test, or Kruskal–Wallis test. Comparisons of ALFF/fALFF/ReHo values among the three groups were calculated by using the DPABI toolbox, and then analyzing the correlation with clinical variables. p < .05 was considered a statistically significant difference. Furthermore, back propagation neural network (BPNN) was utilized to predict cognitive function.
Results
Compared with the MHD-NCI group, the patients with MHD-CI had more severe anemia and higher urea nitrogen levels, lower mALFF values in the left postcentral gyrus, lower mfALFF values in the left inferior temporal gyrus, and greater mALFF values in the right caudate nucleus (p < .05). The above-altered indicators were correlated with MOCA scores. BPNN prediction models indicated that the diagnostic efficacy of the model which inputs were hemoglobin, urea nitrogen, and mALFF value in the left central posterior gyrus was optimal (R2 = 0.8054), validation cohort (R2 = 0.7328).
Conclusion
The rs-fMRI can reveal the neurophysiological mechanism of cognitive impairment in MHD patients. In addition, it can serve as a neuroimaging marker for diagnosing and evaluating cognitive impairment in MHD patients.
Background
Patients with end-stage renal disease (ESRD) are prone to various complications during maintenance hemodialysis treatment, among which cognitive impairment (CI) is one of the most common complications in maintenance hemodialysis (MHD) patients, with an incidence of 6.6%–51% [Citation1]. It primarily manifests as impaired executive ability, impaired attention, memory impairment, and slow motor performance. These deficits reduce compliance and quality of life and negatively affect outcomes [Citation2,Citation3]. The primary means of assessing cognitive function is the neuropsychological scale which is subjective and poorly completed by the patient, and therefore easily overlooked and hinders the early identification of cognitive impairment.
Resting-state functional magnetic resonance imaging (rs-fMRI) evaluates neural networks by measuring blood-oxygen-level-dependent signals at rest. It has been used to investigate the pattern of neuropathological alterations in MHD patients [Citation4–7]. Low-frequency amplitude (ALFF), ratio low-frequency amplitude (fALFF), and regional homogeneity (ReHo) are three commonly used rs-fMRI methods to quantify neural activity. ALFF and fALFF reflect the functional intensity of local brain regions, reflecting the signal of each voxel in the 0.01–0.08 Hz frequency band [Citation8]. ReHo measures the regional coherence of neural activity between adjacent voxels [Citation9]. Several studies applied rs-fMRI methods to explore changes in spontaneous brain activity in MHD patients and found that reduced ALFF/fALFF/ReHo values in the default mode network (DMN) region were associated with cognitive decline [Citation4,Citation5,Citation10,Citation11]. However, these studies did not focus on brain activity changes in MHD patients with CI. It is known that the mechanisms of cognitive dysfunction in maintenance hemodialysis patients are directly or indirectly related to various risk factors such as neurological damage due to uremic toxin accumulation, hypoalbuminemia due to anemia and malnutrition, hemodynamic fluctuations, electrolyte imbalance due to long-term hemodialysis, the decreased cerebral blood flow during dialysis session and cerebral small vessel disease [Citation12–14]. Therefore, to avoid interference from over-confounding factors, we divided hemodialysis patients into two groups based on MOCA scores, to analyze clinical factors related to cognitive function in a cohort of maintenance hemodialysis patients with the same risk factor. This study aims to explore comprehensively the critical brain regions related to cognitive function in combination with resting-state functional MRI, illustrate the neurophysiological mechanisms underlying the occurrence of cognitive impairment in MHD-CI patients, and analyzed the correlation between them for early prevention.
At present, the early identification of CI is mostly based on the judgment of clinical experience, without quantitative evaluation criteria, and the risk of CI cannot be accurately predicted. Advanced machine learning algorithms develop and apply machine learning models that can accurately predict continuous variables such as cognitive ability, disease severity, and treatment effect level at the individual level [Citation15]. Back propagation neural network (BPNN) to predict cognitive function by using nonlinear functions is one of the most widely known neural networks with a high learning accuracy [Citation16]. A large number of experimental tests and theoretical studies have shown that the BPNN algorithm is a kind of efficient learning algorithm, which has been shown to have better diagnostic efficacy than the logistic regression model in several fields, it has good self-learning and adaptive ability [Citation17–19].
In this study, the mean ALFF/fALFF/ReHo values of the brain regions with significant between-group differences were used as neuroimaging markers, and clinical indicators related to cognitive function were incorporated into the BPNN to comprehensively assess the cognitive function of maintenance hemodialysis patients and facilitate early diagnosis. Moreover, this is the first study to use BPNN to predict cognitive function in combination with rs-fMRI and clinical indicators, providing clinical guidance for early diagnosis of cognitive function.
Objectives and methods
Research subjects
This study included 55 patients undergoing regular maintenance hemodialysis at Changzhou Second People’s Hospital (Yanghu Campus) of Nanjing Medical University from September 2020 to December 2021. Inclusion criteria were (1) dialysis age of 6 months or more, (2) age between 18 and 60 years, and (3) right-handedness. We selected healthy people from medical examination centers that matched age, gender, and education level, and recruited people who were willing to complete cognitive scales and head MRI scans as healthy control groups. Exclusion criteria were (1) presence of psychiatric or neurological disorders, including brain tumor, traumatic brain injury, stroke, schizophrenia, and epilepsy, (2) inability to complete neuropsychological scales, (3) chronic advanced liver failure or heart failure, (4) history of drug and alcohol dependence, (5) type 2 diabetes, depression, and sleep disorders; (6) contraindications to MRI scanning, and (7) head movement artifacts interfering with experimental data acquisition or measurement. According to the exclusion criteria, five MHD patients were excluded (three with motion artifacts in data measurement and two with lacunar cerebral infarction lesions), and two controls were excluded due to incomplete data processing. The study group comprised 30 MHD-CI patients ([18 males, 12 females], age 49.53 ± 8.23 years), 20 MHD-NCI ([15 males, 5 females], age 47.00 ± 10.87 years), and 28 controls ([14 males, 14 females], age 47.57 ± 10.22] years). The study was approved by the Ethics Committee of the Second People’s Hospital of Nanjing Medical University (KY032-01).
Methods
Laboratory tests
Blood tests were performed on all subjects within 1h before imaging, including erythrocytes, leukocytes, hemoglobin, erythrocyte pressure product, albumin, triglycerides, serum creatinine, blood urea nitrogen, blood uric acid, serum potassium, serum sodium, serum calcium, serum phosphorus, parathyroid hormone, serum bicarbonate, and urea clearance index (Kt/V).
Neuropsychological scales
All subjects completed the neuropsychological scales 1h after MRI. The Montreal Cognitive Assessment (MOCA) was used to assess overall cognitive function, with dimensions including visuospatial, executive ability, memory, naming, attention, language, abstract thinking, and orientation. The total score is 30 points; when the subject has less than 12 years of education plus one point, less than 26 years is cognitive impairment [Citation20]. The test was administered by professionally trained personnel. Test administrators were professionally trained, and the testing environment was quiet.
MRI acquisition
The rs-fMRI was performed 1h after dialysis treatment. T2-FLAIR images, 3D-T1-weighted imaging (T1WI), and rs-fMRI images were acquired in all subjects using a GE Discovery MR 750 W 3.0 T scanner. Patients were asked to close their eyes, relax, and avoid thinking during the scan. The T2-FLAIR was used to exclude organic lesions; rs-fMRI sequential scanning was performed with machine scan parameters: repetition time (TR) = 2000 ms, echo time (TE) = 40 ms, flip angle (FA) = 90°, matrix = 64 × 64, the field of view (FOV) 240 mm × 240 mm, and slice thickness = 6 mm. High-resolution whole-brain T1WI structural images were obtained using a three-dimensional (3D) brain volumetric imaging (3D BRAVO) sequence. Scanning parameters were TR = 8.2 ms, TE= 3.2 ms, layer thickness = 1.2 mm, layer interval = 0 mm, flip angle = 12°, matrix = 256 × 256, FOV = 240 mm × 240 mm, and number of layers scanned = 152 slices.
MRI data analysis
Data preprocessing was performed using the DPARSF (http://rfmri.org/DPARSF) toolkit based on the MATLAB 2018a (https://www.mathworks.com/) platform with the following steps: (1) conversion of DICOM format to NFITI format; (2) removal of the first ten time points; (3) time layer and head motion correction; (4) spatial normalization using T1 joint segmentation, Montreal Neurological Institute (MNI) template and resampling voxel size of 3 mm × 3 mm × 3 mm; (5) regression of head motion, brain white matter signal, cerebrospinal fluid signal, and global signal as covariates. Then, ALFF and fALFF values were analyzed following the steps below, and a Gaussian smoothing kernel with a full-width half-height value of 4 mm was used to perform spatial smoothing and remove low-frequency linear drift. The average amplitude value of the low-frequency amplitude of the brain (0.01–0.08 Hz) was extracted, and the fALFF value was obtained by dividing the sum of ALFF values in this frequency band by the sum of amplitudes in the full frequency band. Normalization was performed to obtain the average ALFF/fALFF (mALFF/mfALFF) as a parameter for further statistical analysis; ReHo maps were generated before spatial smoothing, and the normalized images were filtered (0.01–0.08 Hz) and normalized before spatial smoothing. The ReHo maps were obtained as ReHo parameters for statistical analysis.
Model construction
Back Propagation neural network is a multi-layer feed-forward network trained by the error inverse propagation algorithm, and its topology includes: The input, hidden, and output layers continuously adjusting the weights and thresholds of the network through backpropagation to minimize the sum of squared errors of the network. After data processing, Matlab’s BP neural network toolbox was used to program the MOCA score of MHD patients to train and predict. (1) The MOCA-related influencing factors are imported into the network as input data, and the MOCA score is imported into MATLAB as an output to establish the corresponding data set. (2) Shuffle the order of the sample data, and screen out 40 sets of data as the training set and 10 sets of data as the test set. (3) To accelerate the convergence speed of the neural network, the sample data is normalized. (4) Build BP neural network, set neural network training parameters, learning rate 0.001, the maximum number of iterations is 10,000 times, and then Sample data for training. (5) After the neural network is stable, import the test set data into the neural network, and the network output results can be denormalized to obtain the prediction results.
Validation cohort
We collected 15 patients with maintenance hemodialysis who met inclusion and exclusion criteria from Changzhou Second People’s Hospital (Chengzhong Campus) of Nanjing Medical University. The MOCA scale and MRI scanning were performed 1h after dialysis treatment (as described above), and input layer indicators included in the BPNN model with optimal diagnostic efficacy were collected for verifying again.
Statistical analysis
For baseline data, SPSS 24.0 (https://www.ibm.com/cn-zh/products/spss-statistics) was used for statistical analysis. Qualitative data (gender) were expressed as frequency and compared between groups using the χ2 test; quantitative data conforming to a normal distribution were compared between groups using the independent samples t-test or analysis of variance, expressed as . Quantitative data with skewed distribution were analyzed using the Mann–Whitney U-test or Kruskal–Wallis test, expressed as M (Q1, Q3). If significant differences were found in the comparisons between the three groups, the least significant difference method was used to assess the differences between functional data. p < .05 was considered a statistically significant difference. Data is z-scored standardized using MATLAB software before correlation analysis.
Comparisons of ALFF/fALFF/ReHo values among the three groups were performed as follows: differences between groups were calculated using the DPABI (http://www.rfmri.org/dpabi) toolbox; analysis of variance was performed with post hoc tests using the least significant difference method; corrected p-values were calculated for comparing any pair; p-mapping was converted to Z-mapping; a Gaussian random field correction was performed using Z-mapping to correct for multiple comparisons, with statistical thresholds set at the voxel level at p < .001 and the cluster level (two-tailed) set to p < .05. All coordinates were reported in the Montreal Neurological Institute space.
Correlation analysis was performed as follows: Pearson correlation analysis was performed between significantly different mALFF/mfALFF/mReHo values and clinical variables extracted from MHD-CI patients and the MHD-NCI group. p < .05 was considered a statistically significant difference. Back propagation neural network (BPNN) was used to predict cognitive function.
Results
Demographic and clinical characteristics
There were no significant differences in age, gender, or education of the subjects across groups (p > .05). MOCA scores were significantly lower in the MHD-CI group than in the MHD-NCI and control groups (p < .001); the difference in MOCA scores between the HC and MHD-NCI groups was not statistically significant (p = .148). Compared to the control group, MHD-CI patients had significantly lower erythrocytes, hemoglobin, albumin, and higher urea nitrogen, creatinine, phosphorus, and parathyroid hormone (p < .05). Compared to the MHD-NCI group, MHD-CI patients had significantly lower hemoglobin (p < .001) and significantly higher urea nitrogen levels (p < .001), with no significant differences between the remaining clinical indicators. The details are presented in and .
Table 1. General information and laboratory tests for the three groups of subjects.
Table 2. Multiple comparison results of post-hoc tests of three groups of clinical variables.
Results of mALFF in brain regions among the three groups
In the MHD-CI group, mALFF values were significantly higher in the left fusiform gyrus, left parahippocampal gyrus, right hippocampus, left caudate nucleus, and right caudate nucleus and lower values in the left postcentral gyrus than in the control group. Compared with the MHD-NCI, the MHD-CI group had significantly higher mALFF values in the right caudate nucleus and significantly lower mALFF values in the left posterior central gyrus. The details are presented in , and .
Figure 1. Clusters with significantly altered mALFF values among groups. The blue-yellow areas denote lower mALFF values in the MHD-CI group than in the (A) MHD-NCI group or (B) HC group. mALFF: mean low-frequency amplitude; MHD-CI: maintenance hemodialysis patients with cognitive impairment; MHD-NCI: maintenance hemodialysis patients without cognitive impairment; HC: healthy controls.
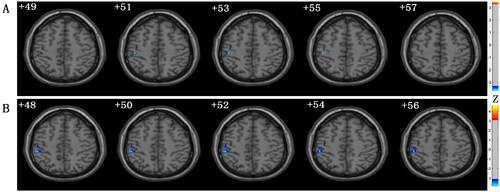
Figure 2. Clusters with significantly altered mALFF values among groups. The red-yellow areas denote higher mALFF values in the MHD-CI group than in the (A) MHD-NCI group or (B) HC group; (C) MHD-NCI group compared to the HC group. mALFF: mean low-frequency amplitude; MHD-CI: maintenance hemodialysis patients with cognitive impairment; MHD-NCI: maintenance hemodialysis patients without cognitive impairment; HC: healthy controls.
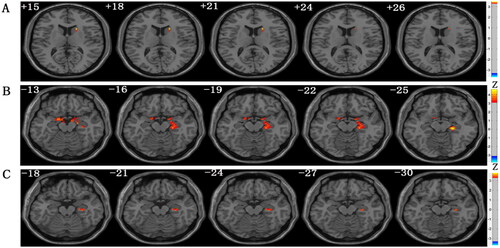
Table 3. Significant differences in mALFF values among groups.
Results of mfALFF in brain regions among the three groups
The left medial superior frontal gyrus mfALFF was significantly lower in the MHD-CI and MHD-NCI groups than in the control group, and the left inferior temporal gyrus mfALFF values were significantly lower in the MHD-CI group than in the MHD-NCI group, and No significant differences were seen in the other paired groups. The details are presented in and .
Figure 3. Clusters with significantly altered mfALFF values among groups. The blue-yellow areas denote lower mfALFF values in the MHD-CI group than in the (A) MHD-NCI group or (B) HC group; (C) MHD-NCI group compared to the HC group. mfALFF: mean ratio low-frequency amplitude; MHD-CI: maintenance hemodialysis patients with cognitive impairment; MHD-NCI: maintenance hemodialysis patients without cognitive impairment; HC: healthy controls.
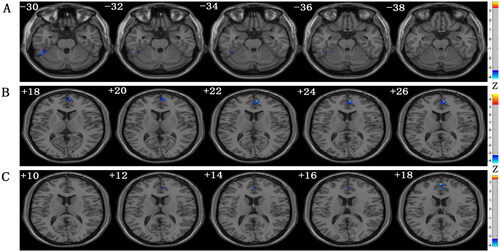
Table 4. Significant differences in mfALFF values among groups.
Results of mReHo in brain regions among the three groups
Compared with the control group, the MHD-CI group had significantly lower left superior occipital gyrus values and significantly higher left rolandic operculum mReHo values, while no significant differences were seen in the other paired groups. The details are presented in and .
Figure 4. Clusters with significantly altered mReHo values among groups. (A) The blue-yellow areas denote lower mReHo values in the MHD-CI group than in the HC group. (B) The red-yellow areas denote higher mfALFF values in the MHD-CI group than in the HC group. mReHo: mean regional concordance; MHD-CI: maintenance hemodialysis patients with cognitive impairment; MHD-NCI: maintenance hemodialysis patients without cognitive impairment; HC: healthy controls.
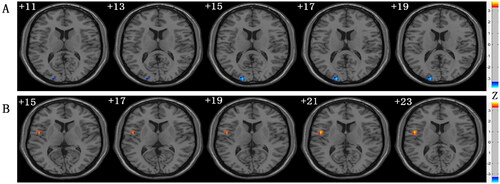
Table 5. Significant differences in mReHo values among groups.
Correlation analysis
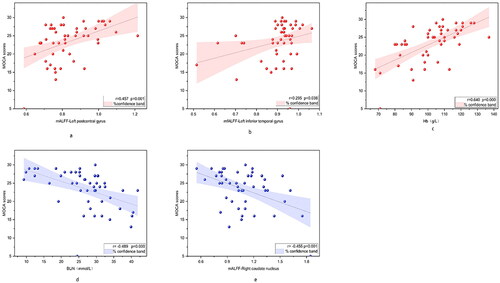
In MHD patients, Pearson correlation analysis revealed that altered mALFF/mfALFF values correlated with statistically significant clinical indicators. The mALFF values in the left postcentral gyrus of MHD patients were significantly positively correlated with MOCA scores (r = 0.457, p = .001), the mfALFF values in the left temporal inferior gyrus were significantly negatively correlated with positively correlated with MOCA scores (r = 0.295, p = .038), hemoglobin was positively correlated with MOCA score (r = 0.640, p < .001). The mALFF values in the right caudate nucleus were negatively correlated with MOCA scores (r = −0.455, p = .001). Urea nitrogen level was negatively correlated with MOCA scores (r = −0.489, p < .001). Details are shown in .
Figure 5. (A) Correlation analysis of the mALFF values in left postcentral gyrus and MOCA score; (B) Correlation analysis of the mfALFF values in left inferior temporal gyrus and MOCA score; (C) Correlation analysis of hemoglobin level and MOCA scores; (D) Correlation analysis of urea nitrogen level and MOCA scores; (E) Correlation analysis of the mALFF values in right caudate and MOCA score.
Back propagation neural network model
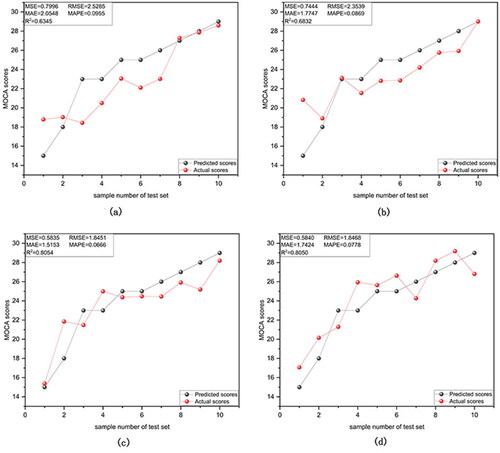
Cognition function predictors were designed using the BPNN model in four schemes based on altered spontaneous brain activity and clinical indicators in MHD patients. Scheme I () was designed based on the hemoglobin levels and blood urea nitrogen levels which related to MOCA scores, the mean square error (MSE), root mean square error (RMSE), mean absolute error (MAE), mean absolute percentage error (MAPE), and R-squared (R2) values between the actual scores and predicted scores were 0.7995, 2.5285, 2.0548, 9.55%, and 0.6345, respectively. In scheme II (), Hb, BUN, and mALFF values in the right caudate nucleus were set as the model inputs, the MSE, RMSE, MAE, MAPE, and R2 values between the actual scores, and predicted scores were 0.7444, 2.3539, 1.7747,8.69%, and 0.6832, respectively. In scheme III (), Hb, BUN, and mALFF values in the left postcentral gyrus were set as the model inputs, the MSE, RMSE, MAE, MAPE, and R2 values between the actual scores and predicted scores were 0.5835, 1.8451, 1.5153, 6.66%, and 0.8054, respectively. In scheme IV (), Hb, BUN, and mALFF values in the left postcentral gyrus and right caudate nucleus were set as the model inputs, the MSE, RMSE, MAE, MAPE, and R2 values between the actual scores and predicted scores were 0.5840, 1.8468, 1.7424, 7.78%, and 0.8050, respectively. Details are shown in .
Figure 6. Back propagation neural network model. (A) Actual scores and predicted scores of BPNN based on Hb and BUN values. (B) actual scores and predicted scores of BPNN based on Hb, BUN, and mALFF values in the right caudate nucleus. (C) actual scores and predicted scores of BPNN based on Hb, BUN, and mALFF values in the left postcentral gyrus. (D) actual scores and predicted scores of BPNN based on Hb, BUN, and mALFF values in the left postcentral gyrus and right caudate nucleus. The dots in the figures indicate the subjects included in the test set of prediction models.
Validation cohort
BPNN model prompts that scheme III is the optimal model, Hb, BUN, and mALFF values in the left postcentral gyrus were set as the model inputs. The mean square error (MSE), root mean square error (RMSE), mean absolute error (MAE), mean absolute percentage error (MAPE), and R-squared (R2) values between the actual scores and predicted scores were 0.5007, 2.7407, 2.4246, 15.54%, and 0.7328, respectively. Details are shown in and .
Figure 7. Validation cohort of BPNN model.
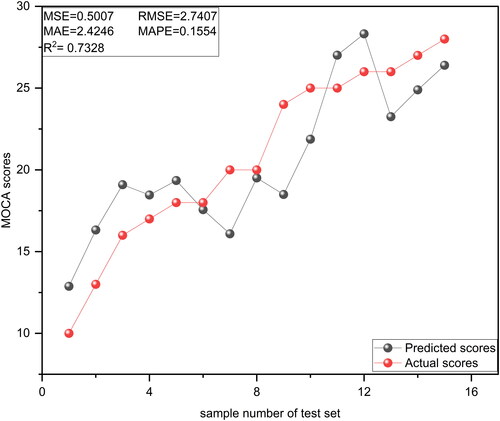
Table 6. The input layer data for the validation cohort.
Discussion
The number of patients on maintenance hemodialysis is increasing, and the incidence of cognitive dysfunction in patients with MHD is increasing, which not only affects the quality of life and treatment of patients but also brings a heavy burden to families and society. Comparing ALFF/fALFF/ReHo values across groups helps to demonstrate comprehensive functional changes in MHD-CI patients and identify brain regions and influencing factors associated with cognitive function in MHD-CI patients. Through the analysis of patients’ cognitive function risk factors, it is possible to screen high-risk groups and implement early intervention and establish BPNN prediction models to guide clinical practice.
Compared with HC, we found that MHD-CI patients had abnormal spontaneous brain activity in several brain regions. The frontal lobe and occipital lobe are part of the default mode network (DMN) and had connections with the medial temporal lobe system such as the hippocampus and parahippocampal gyrus [Citation21,Citation22], several rs-fMRI studies reported reduced spontaneous brain activity in the DMN in ESRD patients [Citation5,Citation10]. The enhanced spontaneous brain activity in the hippocampus and parahippocampal gyrus and caudate nucleus is thought to be a compensatory mechanism for impaired cognitive function in the brain. Continuous hyperfunction accelerates neurodegeneration and impaired cognitive function. The postcentral gyrus which is located in the parietal lobe of the cerebral cortex is part of the somatosensory-motor network; reduced spontaneous brain activity suggests abnormal somatosensory regulation. Notably, compared with the HC group, only mfALFF in the left medial superior frontal gyrus was decreased, and mALFF in the right hippocampus was elevated in the MHD-NCI group, while no significant abnormal spontaneous brain activity was seen in the remaining regions. These findings suggest that MHD-CI patients tend to have more severe neurophysiological alterations and compensatory effects. Therefore, we compared various brain areas and clinical indicators between the MHD-CI and MHD-NCI groups to identify the brain areas and risk factors associated with cognitive function.
Compared to the MHD-NCI group, only the left inferior temporal gyrus mfALFF values were decreased, the left postcentral gyrus mALFF values were decreased, and the right caudate nucleus mALFF values were increased in the MHD-CI group. The various brain areas were similar but slightly smaller compared to the comparison between the MHD-CI and control groups, further exploration of abnormally active brain areas associated with cognitive function in patients with MHD-CI. Previous studies found reduced mReHo values in the temporal lobe bilaterally in MHD patients and a positive correlation with cognitive function [Citation4,Citation21]. The temporal lobe is associated with the frontal lobes, occipital lobes, and parietal lobes through U-shaped fiber structures and is associated with visual and language comprehension and emotion regulation [Citation23]. Anderson et al. suggested that the neurobiological features of CI are hypoperfusion and hypometabolism of the temporoparietal cortex and atrophy of the medial temporal lobe [Citation24]. In the present study, we found reduced mfALFF in the left inferior temporal gyrus of MHD-CI patients, suggesting that abnormal spontaneous brain activity in this brain region might be involved in the underlying neurophysiological mechanisms of CI in MHD-CI patients. While the postcentral gyrus is located in the parietal lobe of the cerebral cortex and is part of the somatosensory center which is involved in daily activities and controls early movement [Citation12]. Ma et al. found that patients with ESRD have altered topological properties of sensorimotor network nodes [Citation25]. Papoiu et al. found that abnormal activation of the postcentral gyrus correlated with the degree of chronic limb pruritus in ESRD patients [Citation26]. In the present study, we found that ALFF was reduced in the left postcentral gyrus, suggesting that MHD-CI patients may also have impaired somatosensory modulation. The present study also found high mALFF values in the right caudate nucleus, a region involved in controlling voluntary movement, learning, and memory [Citation27]. The involvement of the right caudate nucleus in cortico-striato-thalamic circuits is relevant to cognitive function [Citation28]. The visual area of the inferior temporal gyrus has been found to terminate primarily in the caudate nucleus [Citation29]. Therefore, its abnormal brain activity might be considered a compensatory effect of impaired integrity of other brain regions [Citation10]. The continued activation of the caudate nucleus might contribute to its dysfunctional integration. In general agreement with previous studies, we found that the DMN, somatomotor network, and limbic network integrity were more impaired in MHD-CI patients than in controls. In contrast, no significant difference was found between the default network brain activity abnormalities compared with MHD-NCI patients. This finding suggests that patients with MHD undergoing maintenance hemodialysis still have spontaneous brain activity abnormalities in several brain regions based on impaired integrity of the default network, providing objective imaging support for studying the neurophysiological mechanisms of cognitive dysfunction in MHD patients.
We found that patients with MHD-CI had more severe anemia and higher urea nitrogen levels than patients with MHD-NCI, with no significant differences between the remaining clinical indicators. Anemia decreases the oxygen-carrying capacity of the blood and reduces the oxygenation of the brain [Citation30]. It causes decreased cerebral blood volume and thus hypoxia, which aggravates the dysregulation of iron metabolism associated with oxidative stress in the brain, leading to neurodegenerative changes [Citation31]. This study found a positive correlation between hemoglobin levels and MOCA scores, suggesting that lower hemoglobin is associated with more severe cognitive dysfunction. Reza-Zaldivar et al. found varying degrees of improvement in motor and cognitive function after treatment with recombinant human erythropoietin in rats with chronic kidney disease [Citation32]. Their findings suggest that correction of anemia might improve cognitive function, indicating that anemia may be a risk factor for CI. Other studies showed that serum urea nitrogen is cleared faster than intracranial urea nitrogen, leading to brain edema due to changes in osmotic pressure on both sides of the blood-brain barrier, further altering cognitive function [Citation33]. Tsuruya et al. suggested that neurotoxins induce oxidative stress, neuronal death, and frontotemporal lobe volume atrophy, affecting cognitive function [Citation34]. Chen et al. found that abnormal brain activity in ESRD patients was associated with urea nitrogen [Citation4]. These findings suggest that a high urea nitrogen level might be a risk factor for CI, explaining why there was more abnormal brain activity in brain areas in the MHD-CI group than in the MHD-NCI and control groups. These findings might help explore the neurophysiological mechanisms of MHD-CI patients and guide the early intervention in specific brain regions.
In our study, we combine quantifiable influencing factors to build different BPNN prediction model and reflect different prediction precision of the combination forecast model and the evaluation results. BPNN can efficiently extract key features in the exceedingly complicated nonlinear hidden neural layers and handle complex and nonlinear problems more easily than the conventional logistic regression model [Citation35]. Compared with model one, the other three models add neuroimaging markers, and the prediction accuracy is significantly improved. The mALFF values in the right caudate nucleus and left postcentral were added to models 2 and 3, respectively, and the correlation coefficient between these two neuroimaging markers and MOCA scores were roughly similar, but the diagnostic efficacy of model 3 was significantly higher than that of model 2, which showed that spontaneous changes in brain activity in the left postcentral gyrus played a key role in the construction of cognitive function models. We combined two neuroimaging markers with clinical indicators to predict cognitive function and found that the diagnostic efficacy of model 4 was not better than that of model 3, which further confirmed our conjecture. The main reason considered in this study is that the postcentral gyrus is located in the cerebral cortex to control somatic movement, and several studies have shown that in addition to the default network, the somatic motor network of patients with end-stage renal disease is also affected, which may improve the prediction accuracy of the model. The mALFF values in the right caudate nucleus are negatively correlated with the MOCA score, and considering that its change may be compensatory, it is not possible to increase the accuracy of the model after joining. The inferior temporal gyrus, which belongs to the default network, is not significantly related to clinical indicators and MOCA scores, and most studies on BPNN suggest that the inclusion of non-significantly related indicators will reduce the accuracy of the model, so this study did not include them in the model input layer. This study found that hemoglobin, urea nitrogen, and mALFF values of the left-center postcentral gyrus as input layers for predicting cognitive function also have good diagnostic efficacy in the external validation cohort, which further supports our experimental conclusions.
There are limitations to the present study. Firstly, this was a cross-sectional study, and it was impossible to determine causal relationships between changes in spontaneous brain activity and clinical indicators. Secondly, a full set of cognitive function scales was not performed, the neuropsychological scales will be refined for future assessments. Thirdly, Patients may experience decreased cerebral blood flow after hemodialysis, which may interfere with the experiment. Our follow-up research will focus on changes in cerebral blood flow in MHD patients and analyze their relationship with cognitive function. Finally, the BPNN prediction system such like a ‘black box’, compared to prediction systems built on methods such as linear regression. Some algorithms can help us better understand the relationship between the input layer and the outcome variable, such as Garson’s algorithm, Lek’s profile, partial dependence, and local interpretable model-agnostic explanations [Citation36]. Therefore, more samples need to be collected for multi-center research, combined with various algorithms to verify the validity of the model.
Conclusion
In summary, we found that MHD-CI patients had abnormal spontaneous brain activity in several brain regions, including the DMN, somatomotor network, and limbic network, the left inferior temporal gyrus and left postcentral gyrus might be the critical regions affecting cognitive function in MHD patients, and correction of anemia and adjustment of urea nitrogen levels might help prevent CI in MHD patients. Based on quantifiable influencing factors, we construct different BPNN prediction models, indicating that the diagnostic efficacy of the model which inputs were hemoglobin, urea nitrogen, and mALFF value in the left central posterior gyrus is optimal. It also indicates better diagnostic performance in external verification. Combined with rs-fMRI not only reveals the neurophysiological mechanism of cognitive impairment but also can serve as a neuroimaging marker for the diagnosis and evaluation of cognitive impairment in patients with MHD. The construction and application of the disease prediction model play an important reference value for disease screening.
Ethical approval
The study was approved by the Ethics Committee of the Second People’s Hospital of Changzhou City (KY032-01). All methods were carried out by relevant guidelines and regulations.
Consent form
Informed consent was obtained from all individual participants included in the study.
Author contributions
Author contributions included conception and study design (TLand QS), data collection or acquisition (QS, HZ, and XW), statistical analysis (QS and YZ), interpretation of results (Q Sand TL), drafting the manuscript work or revising it critically for important intellectual content (TL and HS) and approval of the final version to be published and agreement to be accountable for the integrity and accuracy of all aspects of the work (All authors).
Acknowledgments
We thank Chen Li from the Department of Nephrology for her assistance with recruiting patients.
A preprint of the article has been published in Research Square. Posted Date: October 26th, 2022. https://doi.org/10.21203/rs.3.rs-2159328/v1.
Disclosure statement
No potential conflict of interest was reported by the author(s).
Data availability statement
The datasets generated and analyzed during the current study are not publicly available because they constitute an excerpt of research in progress but are available from the corresponding author on reasonable request.
Additional information
Funding
References
- San A, Hiremagalur B, Muircroft W, et al. Screening of cognitive impairment in the dialysis population: a scoping review. Dement Geriatr Cogn Disord. 2017;44(3–4):1–12.
- Buchman AS, Boyle PA, Shah RC, et al. Kidney function is associated with the rate of cognitive decline in the elderly. Neurology. 2009;73(12):920–927. 2009.
- Hermann DM, Kribben A, Bruck H. Cognitive impairment in chronic kidney disease: clinical findings, risk factors and consequences for patient care. J Neural Transm. 2014;121(6):627–632.
- Chen HJ, Qi R, Kong X, et al. The impact of hemodialysis on cognitive dysfunction in patients with end-stage renal disease: a resting-state functional MRI study. Metab Brain Dis. 2015;30(5):1247–1256.
- Guo H, Liu W, Li H, et al. Structural and functional brain changes in hemodialysis patients with End-Stage renal disease: DTI analysis results and ALFF analysis results. Int J Nephrol Renovasc Dis. 2021;14:77–86.
- Jin M, Wang L, Wang H, et al. Disturbed neurovascular coupling in hemodialysis patients. PeerJ. 2020;8:e8989.
- Ma C, Gao S, Li W[, et al. Study on the changes of spontaneous brain activity in maintenance hemodialysis patients with end-stage renal disease based on three different resting state-functional magnetic resonance low-frequency amplitude algorithms. Zhonghua Yi Xue Za Zhi. 2021;101:265–270.
- Zou QH, Zhu CZ, Yang Y, et al. An improved approach to detection of amplitude of low-frequency fluctuation (ALFF) for resting-state fMRI: fractional ALFF. J Neurosci Methods. 2008;172(1):137–141.
- Zhou M, Hu X, Lu L, et al. Intrinsic cerebral activity at resting state in adults with major depressive disorder: a meta-analysis. Prog Neuropsychopharmacol Biol Psychiatry. 2017;75:157–164.
- Chen P, Hu R, Gao L, et al. Abnormal degree centrality in end-stage renal disease (ESRD) patients with cognitive impairment: a resting-state functional MRI study. Brain Imaging Behav. 2021;15(3):1170–1180.
- Su H, Fu S, Liu M, et al. Altered spontaneous brain activity and functional integration in hemodialysis patients with end-stage renal disease. Front Neurol. 2021;12:801336.
- Fu J, Chen X, Gu Y, et al. Functional connectivity impairment of postcentral gyrus in relapsing-remitting multiple sclerosis with somatosensory disorder. Eur J Radiol. 2019;118:200–206.
- Polinder-Bos HA, García DV, Kuipers J, et al. Hemodialysis induces an acute decline in cerebral blood flow in elderly patients. J Am Soc Nephrol. 2018;29(4):1317–1325.
- Yao T, Song G, Li Y, et al. Chronic kidney disease correlates with MRI findings of cerebral small vessel disease. Ren Fail. 2021;43(1):255–263.
- Sui J, Jiang R, Bustillo J, et al. Neuroimaging-based individualized prediction of cognition and behavior for mental disorders and health: methods and promises. Biol Psychiatry. 2020;88(11):818–828.
- He Z, Zhou S. BPNN-based behavioral modeling of the S-parameter variation characteristics of PAs with frequency at different temperatures. Micromachines. 2022;13(11):1831.
- Wei W, Yang X. Comparison of diagnosis accuracy between a backpropagation artificial neural network model and linear regression in digestive disease patients: an empirical research. Comput Math Methods Med. 2021;2021:6662779.
- Xiao F, Wang T, Gao L, et al. Frequency-dependent changes of the resting BOLD signals predicts cognitive deficits in asymptomatic carotid artery stenosis. Front Neurosci. 2018;12:416.
- Lyu J, Shi H, Zhang J, et al. Prediction model for suicide based on back propagation neural network and multilayer perceptron. Front Neuroinform. 2022;16:961588.
- Tiffin-Richards FE, Costa AS, Holschbach B, et al. The montreal cognitive assessment (MoCA) – a sensitive screening instrument for detecting cognitive impairment in chronic hemodialysis patients. PLOS One. 2014;9(10):e106700.
- Liang X, Wen J, Ni L, et al. Altered pattern of spontaneous brain activity in the patients with end-stage renal disease: a resting-state functional MRI study with regional homogeneity analysis. PLoS One. 2013;8(8):e71507.
- Nakajima M. Neuronal identity and cognitive control dynamics in the PFC. Semin Cell Dev Biol. 2022;129:14–21.
- Lin YH, Young IM, Conner AK, et al. Anatomy and white matter connections of the inferior temporal gyrus. World Neurosurg. 2020;143:e656–e666.
- Anderson ND. State of the science on mild cognitive impairment (MCI). CNS Spectr. 2019;24(1):78–87.
- Ma X, Jiang G, Li S, et al. Aberrant functional connectome in neurologically asymptomatic patients with end-stage renal disease. PLOS One. 2015;10(3):e0121085.
- Papoiu AD, Emerson NM, Patel TS, et al. Voxel-based morphometry and arterial spin labeling fMRI reveal neuropathic and neuroplastic features of brain processing of itch in end-stage renal disease. J Neurophysiol. 2014;112(7):1729–1738.
- Seger CA, Cincotta CM. The roles of the caudate nucleus in human classification learning. J Neurosci. 2005;25(11):2941–2951.
- Haber SN, Knutson B. The reward circuit: linking primate anatomy and human imaging. Neuropsychopharmacology. 2010;35(1):4–26.
- Haber SN. Corticostriatal circuitry. Dialogues Clin Neurosci. 2016;18(1):7–21.
- Duffin J, Hare GMT, Fisher JA. A mathematical model of cerebral blood flow control in anaemia and hypoxia. J Physiol. 2020;598(4):717–730.
- Carvalho C, Correia SC, Santos RX, et al. Role of mitochondrial-mediated signaling pathways in Alzheimer disease and hypoxia. J Bioenerg Biomembr. 2009;41(5):433–440.
- Reza-Zaldivar EE, Sandoval-Avila S, Gutierrez-Mercado YK, et al. Human recombinant erythropoietin reduces sensorimotor dysfunction and cognitive impairment in rat models of chronic kidney disease. Neurologia. 2020;35(3):147–154.
- Sm S. Cerebral edema after rapid dialysis is not caused by an increase in brain organic osmolytes. J Am Soc Nephrol. 1995;6(6):1600–1606.
- Tsuruya K, Yoshida H, Haruyama N, et al. Clinical significance of fronto-temporal gray matter atrophy in executive dysfunction in patients with chronic kidney disease: the VCOHP study. PLOS One. 2015;10(12):e0143706.
- Chen X, Li Y, Li X, et al. An interpretable machine learning prognostic system for locoregionally advanced nasopharyngeal carcinoma based on tumor burden features. Oral Oncol. 2021;118:105335.
- Zhang Z, Beck MW, Winkler DA, et al. Opening the black box of neural networks: methods for interpreting neural network models in clinical applications. Ann Transl Med. 2018;6(11):216.