
Abstract
Background
Ectopic calcification (EC) involves multiple organ systems in chronic kidney disease (CKD). Previous CKD-animal models primarily focused on a certain histological abnormality but did not show the correlation with calcified development among various tissues. This study compared calcified deposition in various tissues during CKD progression in mice.
Methods
Male 8-week-old C57BL/6J mice were randomly allocated to the seven groups: a basic, adenine, high-phosphorus, or adenine and high-phosphorus diet for 12–16 weeks (Ctl16, A12, P16, or AP16, respectively); an adenine diet for 4–6 weeks; and a high-phosphorus or adenine and high-phosphorus diet for 10–12 weeks (A6 + P10, A4 + P12, or A4 + AP12, respectively).
Results
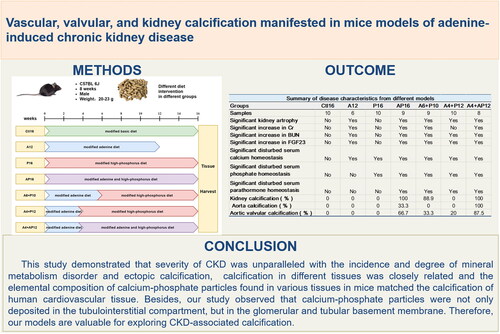
Compared to the Ctl16 mice, the P16 mice only displayed a slight abnormality in serum calcium and phosphorus; the A12 mice had the most serious kidney impairment; the A4 + P12 and A6 + P10 mice had similar conditions of CKD, mineral abnormalities, and mild calcification in the kidney and aortic valves; the A4 + AP12 and AP16 groups had severe kidney impairment, mineral abnormalities and calcification in the kidneys, aortic valves and aortas. Furthermore, calcium-phosphate particles were deposited not only in the tubulointerstitial compartment but in the glomerular and tubular basement membrane. The elemental composition of EC in various tissues matched the calcification of human cardiovascular tissue as determined by energy dispersive spectroscopy.
Conclusions
The severity of CKD was unparalleled with the progression of mineral metabolism disorder and EC. Calcification was closely related in different tissues and observed in the glomerular and tubular basement membranes.
Novelty & noteworthy
Previous CKD-animal models primarily focused on a certain histological abnormality but lacked investigations of the interplay of EC in various tissues. This study compared calcified deposition in several tissues during CKD progression in mice, which was closely related. The severity of CKD was unparalleled with the development of ectopic calcification. Glomerular and tubular basement membrane calcification was detected in CKD mice, which has been considered extremely rare in clinical.
Graphical Abstract
Introduction
Chronic kidney disease-mineral bone disease (CKD-MBD) has been described as abnormalities in biochemical markers, skeletal abnormalities, and ectopic calcification (EC) [Citation1]. All three manifestation components were gradually observed with the progression of CKD. Cardiovascular calcification (CVC) including cardiac valvular and vascular calcification (VC) was detected in 47–83% of patients in CKD stage 3–5 [Citation1]. Previous studies have confirmed that CKD-associated CVC was related to increased cardiovascular morbidity and mortality [Citation2–5], which was considered the highest cardiovascular risk (2 A) in the latest clinical practice guideline update [Citation6]. Current treatment of CKD-associated CVC is mainly targeted at lowering high serum phosphorus, controlling hyperparathyroidism, and maintaining serum calcium [Citation6]. Nevertheless, these treatments have been proven to slow the progression of VC to some extent [Citation7–9]. Effective therapeutic strategies for preventing and reversing CVC formation are lacking.
EC is thought to involve hyperphosphatemia [Citation10], an imbalance between calcific inducers and inhibitors [Citation11], the osteogenic transformation of vascular smooth muscle cells [Citation12], impaired osteoclastic bone reabsorption activity [Citation13], the release of matrix vesicles and the deposition of calcium-phosphate crystals in the extracellular matrix [Citation14], extracellular vesicles [Citation15] and so on. However, the precise mechanisms remain largely unexplored. Previous animal models of CKD have focused on a certain histological abnormality such as VC but have lacked investigations of the correlation and interplay of EC progression among the vessels, valves, and kidney, which is critical to understand the mechanisms of similar pathologies in different tissues and evaluate the efficacy of therapeutic compounds on the evolution of CKD-associated calcification. Therefore, it is valuable to better mimic in vivo environments to construct reliable and stable CKD-associated calcification, preclinical models.
A search of the literature was performed in the PubMed database using the keywords [adenine] and [vascular calcification], yielding 144 articles published between 2005 and 2022. Of those studies, most experimental objects were rats and fewer than 20 studies involved mouse models. There were significant differences in those studies with respect to initial age, induction period, dosage, and combination measures [Citation16–34]. The characteristics of previous relevant studies about mouse model methods are summarized in Supplementary 1. Moreover, many studies did not offer a specific survival rate and success rate during the construction period of the CKD-associated VC model.
Therefore, this study aimed to observe and compare calcified deposition in various tissues including the kidney, aortic valve, and aorta during the clinical course of CKD in mice, which would make it feasible and reliable to determine the underlying molecular and cellular mechanisms of similar pathophysiological processes in different tissues and to evaluate the efficacy of therapeutic compounds on the evolution of CKD-associated calcification simultaneously.
Methods
Animals
Male 7-week-old C57BL/6J mice were obtained from Vital River Laboratories (Zhejiang, China) and housed in a controlled environment (3–5 animals/cage, 12:12-h light/dark cycle, 23 ± 2 °C, humidity 50 ± 10%, purified water). All animal experiments were performed according to standard guidelines for the care and use of laboratory animals. All procedures were approved by the Institutional Animal Care and Use Committee of Southeast University (No. 20190112009). We present this article in accordance with the ARRIVE reporting checklist (Supplementary 2).
CKD-associated calcification models
After one week of acclimation feeding, male 8-week-old mice (110 mice in total) were randomized into the following groups. Mice were fed a basic diet without supplemental adenine or phosphorus (Xietong Pharmaceutical Bioengineering Co. Ltd. Nanjing, China) as the control group. Mice in the different experimental groups were fed an adenine diet (0.2% adenine, A8626, Sigma-Aldrich. Saint Louis, USA), a high-phosphorus diet (1.8% phosphorus, Xietong Pharmaceutical Bioengineering Co. Ltd. Nanjing, China) or a compound diet containing 0.2% adenine and 1.8% phosphorus as appropriate. Food intake and body weight were monitored weekly from 8 to 24 weeks of age. Animals were terminated at the twelfth or sixteenth week after induction for the assessment of growth, kidney impairment, mineral metabolism, secondary hyperparathyroidism, and EC.
Histology and pathological staining studies
For the generation of paraffin sections, tissues including kidneys, thoracic aortas, and hearts were isolated carefully and fixed with 4% paraformaldehyde (BL539A, Biosharp, Guangzhou, China) for 24 h, embedded in paraffin, and cut at 2-μm thickness. Sections were stained with hematoxylin and eosin (H&E), Masson, and von Kossa (G1005 HE, G1006, and G1043, Servicebio, Wuhan, China) as appropriate according to standard protocols. Stained sections were scanned with a 40× objective using a digital pathology slide scanner (Aperio CS2, Leica Biosystems, Germany) and qualitative image analysis was performed using pathology slide viewing software (Aperio ImageScope, Leica Biosystems, Germany). Semiquantitative analyses of calcification and fibrosis were performed using Image-Pro Plus software (Media Cybernetics, Silver Spring, MD).
Serum biochemical analyses
Serum levels of creatinine (Cr), blood urea nitrogen (BUN), calcium (Ca), and phosphorus (P) were determined by spectrophotometry (Multiskan GO. Thermo Scientific) using commercial kits (Cat no: C011-2-1, C013-2-1, C004-2-1, and C006-1-1, Nanjing Jiancheng Bioengineering, Nanjing, China) according to the manufacturer’s instructions. Quantification of serum parathyroid hormone (PTH) and fibroblast growth factor 23 (FGF23) was performed using commercial enzyme-linked immunosorbent assay kits (ELISA Cat no: E-EL-M0709c and E-EL-M2415c, Elabscience, Wuhan, China) according to the manufacturer’s instructions.
Calcium measurements
The commercial kit provided the tissue lysis solution (TLS) for this experiment. Beforehand, the TLS was used to dilute hydrochloric acid (HCl) and generate 5 mol/l HCl-TLS. Kidney, abdominal artery, and heart samples were isolated and weighed on a precision balance. Then, tissues were added to a certain volume HCl-TLS according to the mass and ground sufficiently. After standing for 1 h at room temperature, the tissue homogenate was centrifuged. The calcium content in the supernatant was measured by spectrophotometry using a commercial kit. (S1063S, Beyotime, Shanghai, China). The calcium content was normalized to the weight of the wet tissue.
SEM and EDS analyses
For the generation of samples for scanning electron microscopy (SEM) (HITACHI Regulus 8100), fresh tissues from the kidneys, abdominal arteries, and partial hearts including aortic valves were fixed with 2.5% glutaraldehyde and 1% osmic acid, dehydrated through graded ethanol and coated. Samples were imaged by SEM operating at 10 kV, which was equipped with energy dispersive spectroscopy (EDS) (AZtecLive Ultim Max 100). The EDS spectra were obtained in the regions of interest using the spot and region mode, which focused the beam on the selected region and provided a spatial resolution of 50 µm.
Statistics
Data are presented as the means ± SDs. Differences among multiple groups were tested by one-way ANOVA with Bonferroni correction for multiple comparisons. All statistical tests were two-sided, with a value of p < 0.05 defined as significant. All statistical analyses were performed using GraphPad Prism software, version 9.4 for Windows 10.
Results
Optimization of the adenine-fed CKD mouse model
Previous studies have shown that a high-phosphorus diet induced arterial medial calcification in adenine-fed CKD mice on a C57BL/6J background [Citation16–24,Citation26,Citation28,Citation33] (Supplementary 1). Initially, to induce CKD, mice (N = 20) were fed a diet containing 0.2% adenine added directly to the basic feed. However, the food intake and body weight of all the basic-adenine-diet mice decreased increasingly, and 80% of those animals died after the fourth week of induction (). The dead mice were significantly underweight. Visceral fat was rarely observed when we dissected the only four remaining mice induced for 4 weeks. Then fat (7%), casein (7%), and sucrose (20%) were added to the basic feed to increase the energy supply, improve taste and conceal the taste and smell of adenine, which was then called the modified basic feed. Adenine (0.2%) and phosphorus (1.8%) were individually or simultaneously added to the modified basic feed to form the modified adenine (0.2% adenine), high-phosphorus (1.8% phosphorus) or adenine and high-phosphorus (0.2% adenine and 1.8% phosphorus) feed (, Supplementary 3). The body weight and food intake were reduced at a significantly slower rate in the modified adenine-diet group than in the basic adenine-diet group (). As shown in , the new diet improved the survival of mice and only one of the 20 mice fed the modified adenine diet for 6 weeks died.
Figure 1. Comparison between basic and modified adenine diets and compositions of the optimized diets. Changes of body weight (a), average food intake (B), and survival rates (C) in mice fed a basic and modified adenine diet. (D) Proportion of nutritional ingredients in each kind of feed. (E) Total energy and proportion of energetic substance in each kind of feed. Notes: (1) Recipe and nutritional ingredient of feed were shown in the supplementary 1; (2) the total energy (kcal/Kg) = [protein (g)*4 + carbohydrate (g)*4 + fat (g)*9]*10.
![Figure 1. Comparison between basic and modified adenine diets and compositions of the optimized diets. Changes of body weight (a), average food intake (B), and survival rates (C) in mice fed a basic and modified adenine diet. (D) Proportion of nutritional ingredients in each kind of feed. (E) Total energy and proportion of energetic substance in each kind of feed. Notes: (1) Recipe and nutritional ingredient of feed were shown in the supplementary 1; (2) the total energy (kcal/Kg) = [protein (g)*4 + carbohydrate (g)*4 + fat (g)*9]*10.](/cms/asset/c6725eea-0d74-4d27-a7b8-9cce7bf62f56/irnf_a_2228920_f0001_c.jpg)
Comparisons of the survival rate, body weight, renal impairment and mineral abnormalities in different diet models
In the following experiments, C57BL/6 mice were randomly divided into 8 groups (N = 10/group): mice fed a modified basic, adenine, high-phosphorus or adenine and high-phosphorus diet (Ctl, A, P, or AP, respectively); mice fed a modified adenine diet for 4-6 weeks and then a modified high-phosphorus or adenine and high-phosphorus diet (A4 + P, A6+ P, A4 + AP, or A6 + AP, respectively). When the terminal time was set at the 16th week after the induction, the mice from the Ctl, P, and A4 + P groups achieved 100% survival and there was a survival rate of more than 80% in the A4 + AP, A6 + P, and AP groups (). All the mice from the A and A6 + AP groups died. Considering that more than half of the mice survived at the 12th week after a modified adenine diet, we fed another group in the modified adenine diet (N = 10) for 12 weeks. Finally, there were 6 experimental groups and one control group in this research as follows: mice fed a modified (1) basic diet for 16 weeks (Ctl16, N = 10); (2) adenine diet for 12 weeks (A12, N = 6); (3) high-phosphorus diet for 16 weeks (P16, N = 10); (4) adenine and high-phosphorus diet for 16 weeks (AP16, N = 9); (5) adenine diet for 6 weeks and then a modified high-phosphorus diet for 10 weeks (A6 + P10, N = 9); (6) adenine diet for 4 weeks and then a modified high-phosphorus diet for 12 weeks (A4 + P12, N = 10); and (7) adenine diet for 4 weeks and then a modified adenine and high-phosphorus diet for 12 weeks (A4 + AP12, N = 8)(), with 100%, 60%, 100%, 90%, 90%, 100%, and 80% survival rates, respectively. During the study period, the body weight was reduced in the A12 and A4 + AP12 mice, continuously increased in the Ctl16 and P16 mice, exhibited a V shape in the A4 + P12 and A6 + P10 mice, and approximately maintained in the AP16 mice in comparison to the level of 8-week-old mice before induction ().
Figure 2. Protocols for the study design and comparison of different diet modes in survival rate and body weight. (A) Probability of survival in different diet groups throughout the study duration. (B) Schematic overview of the study design for different models. (C) Body weight in different models throughout the study duration.
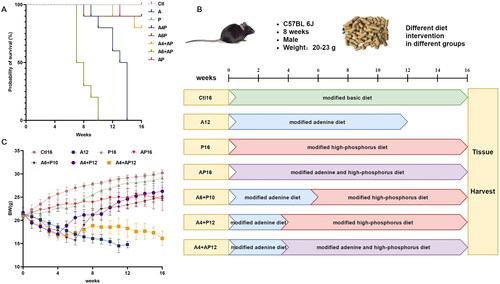
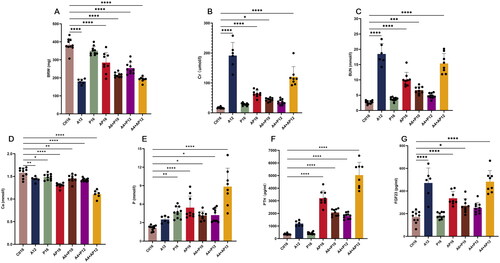
When compared to the level of the Ctl16 group, the bilateral renal weight was reduced in all other mouse groups except for P16, which was only approximately half the level in the A12 and A4 + AP12 mice (). Serum concentrations of Cr and BUN were elevated 5 to 10 times in the A12 and A4 + AP12 groups compared with the control values and were increased significantly in the AP16 and A6 + AP10 groups, but no significant difference was observed in the P16 and A4 + P12 groups (). Serum concentrations of Ca decreased in all groups on a special diet regardless of supplemental adenine or phosphorus, while elevation in serum concentration of P was seen in the P16, AP16, A6 + P10, A4 + P12 and A4 + AP12 groups (). In addition, PTH has dramatically increased in the A4 + AP12, AP16, A6 + P10, and A4 + AP12 groups in descending order by serum concentration, while FGF23 was increased significantly in the A4 + AP12, A12, AP16, and A6 + P10 groups ().
Figure 3. Comparison of different diet modes in kidney impairment and mineral homeostasis disorder. Bilateral renal weight were shown in (a). serum levels of (B) creatinine (Cr), (C) blood urea nitrogen (BUN), (D) calcium (Ca), (E) phosphorus (P), (F) parathyroid hormone (PTH) and (G) fibroblast growth factor 23 (FGF23) were measured at the end of the experimental period. Data are the mean ± SEM. ****p<0.0001, ***p<0.001, **p<0.01, *p<0.05 vs Ctl16, determined by ANOVA with Bonferroni multiple comparison test. Samples in each group: Ctl16 (n = 10), A12 (n = 6), P16 (n = 10), AP16 (n = 9), A6 + P10 (n = 9), A4 + P12 (n = 10), and A4 + AP12 (n = 9).
Renal histology: Fibrosis, inflammation and calcification
The differences and characteristics in the histology of kidney tissues among each group are shown in . There was no significant difference between Ctl16 and P16 mice ((ACitation1, Citation3, BCitation1, Citation3)). Compared to the Ctl16 mice, kidney tissues of all adenine-diet mice (the A12, AP16, A6 + P10, A4 + P12 and A4 + AP12 groups) exhibited renal atrophy with a contracted size and irregular surface ((A2, 4–7, C2, 4–7)). H&E staining in magnified images showed contracted glomerular capillary tuft, invasion of inflammatory cells and atrophic renal tubules with thickening of the tubular basement membrane, flattened epithelium with complete loss of the brush border, and deposition of crystalline structures in tubule lumens ((B2, 4–7)). Masson staining indicated interstitial fibrosis, protein casts and increasing mesangial matrix that effaces the glomerular capillaries ((E, F2, 4–7). All of the aforementioned findings indicated that chronic nephropathy was successfully induced in the mice fed an adenine diet. Further semiquantitative histopathological analysis of the kidney by multiple comparisons showed the following results (). The A12 mice had the highest rate of glomerulus sclerosis and interstitial fibrosis, followed by the A4 + AP12, AP16, A6 + P10, and A4 + P12 groups. Mice from the A12 ((B2, E2, F2, G, H)), AP16 ((B4, E4, F4, G, H) and A4 + AP12 groups ((B7, E7, F7, G, H)) presented more severe renal injury as evidenced by the glomerulus sclerosis, tubular impairment, interstitial inflammation, and interstitial fibrosis.
Figure 4. Representative histopathological images in renal tissues from different groups and semiquantitative analyses of glomerulus sclerosis and interstitial fibrosis. Renal tissues were evaluated in each group using hematoxylin and eosin (H&E) (A1–7, B1–7), von Kossa (C1–7, D1–7), and Masson staining (E1–7, F1–7). Invasion of inflammatory cells (green triangle), tubular luminal expansion (yellow triangle), protein casts (blue triangle and yellow square), contracted glomerular capillary tuft (black triangle), calcified deposits in the tubulointerstitial compartment including tubular lumen (green arrowhead) and interstitial (violet arrowhead), calcification in tubular basement membrane (yellow arrowhead), parietal layer of renal capsule (blue arrowhead), and renal small arteries (black arrowhead), interstitial fibrosis (black square), matrix deposition in glomerular capillary tuft (green square). Semiquantitative analyses of kidney injury were performed according to the proportion of sclerotic glomeruli based on H&E staining (G) and the percentage of fibrotic area based on Masson staining (H). the proportion of sclerotic glomeruli were calculated as the number of sclerotic glomeruli divided by the total number of glomeruli in the same 200× field view. Fibrotic area and the total renal tissue area were measured using Image-Pro plus (version 6.0). Data are the mean ± SEM. ****p<0.0001, ***p< 0.001, **p<0.01, *p<0.05 vs Ctl16, determined by ANOVA with Bonferroni multiple comparison test. N = 5/each group.
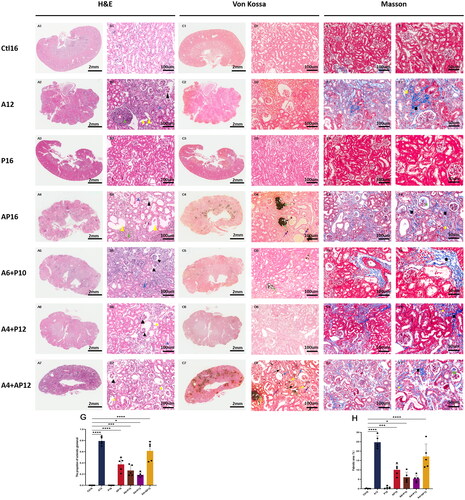
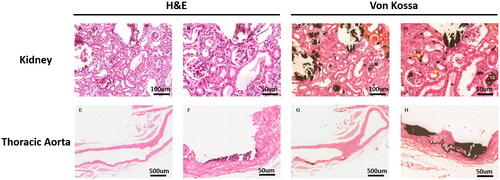
Von Kossa staining showed calcified deposition in kidney tissues. There was no calcified deposition observed in the Ctl16, A12, P16 and A4 + P12 mice ( C and D(1–3), 6). Mild calcification appeared in the A6 + P10 group (: C5) and moderate calcification in the AP16 group (: C4) with calcified deposition in the tubulointerstitial compartment involving tubular lumens ((D4–5)) and renal interstitium ((D4)). Furthermore, there was widespread and extensive calcification in the A4 + AP12 group ((C7)). By comparing the continuous tissue slices stained with H&E ((B7); (A, B)) and von Kossa ((E7); C,D)), calcified deposition was observed in the glomerular and tubular basement membrane, parietal layer of the renal capsule and renal small arteries apart from the tubulointerstitial compartment.
Aortic valvular and thoracic aorta calcification
Thoracic aorta and aortic valve slices stained by H&E and von Kossa, are shown in and . There was no observable calcified evidence in the aortic valves of the Ctl16, A12 and P16 mice ((A1–C3)). Mild aortic valvular calcification was detected in the A4 + P12, A6 + P10 and AP16 mice at different proportions (20%, 33.3% and 66.7%) ((A4–C6)). Moderate or severe calcification was observed in the A4 + AP12 mice (87.5%) accompanied by extensive calcification in the elastic layer of aortic initiation ((A7, B7, C7)).
Figure 5. Representative histopathological images in aorta valvular tissues from different groups. Aorta valvular tissues were evaluated in each group using hematoxylin and eosin (H&E) (A1–7), and von Kossa (B1–7, C1–7).
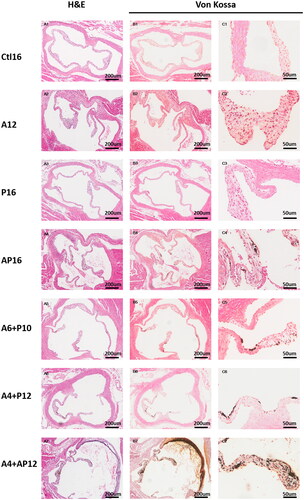
Figure 6. Representative histopathological images in thoracic aorta tissues from different groups. Thoracic aorta tissues were evaluated in each group using hematoxylin and eosin (H&E) (A1–7, B1–7), and von Kossa (C1–7, D1–7).
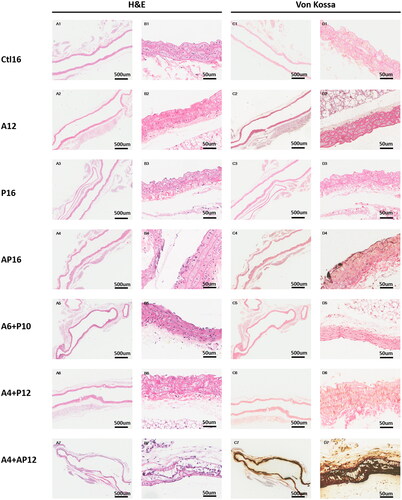
For VC, mild aorta calcification was observed in partial thoracic aorta slices from the AP16 group (33.3%) ((A4, B4, C4, D4)), while it was undetectable in mice fed the simple adenine or phosphorus diet (A12, P16, A4 + P12 and A6 + P10 groups) (: A1-D3; A5-D6). Moderate and severe calcification was observed in the A4 + AP12 mice (100%), and representative images are shown in (A7, B7, C7, D7) and . Notably, the elastin layers in these calcified areas grossly appeared to be disorganized and disrupted, when comparing the images stained by H&E ((B4, 7) and ) with images stained by von Kossa ( D4, 7) and ).
Figure 7. Representative histopathological images in thoracic aorta and renal tissues from the A4 + AP12 group. The continuous renal tissue slices were stained with H&E (A, B) and von Kossa (C, D). calcified depositions were observed in the glomerular basement membrane (grey arrowhead) and tubular basement membrane (yellow arrowhead). Representative images of moderate aorta calcification were stained with H&E (E, F) and von Kossa (G, H).
Quantitative comparisons in the aortic valves, aorta and kidney
The percentage of the calcified area (the von Kossa-positive surface) in the kidney, aortic valve, and thoracic aorta is shown in . Although some ectopic calcified depositions were also observed in the A6 + P10 and A4 + AP12 mice, there was no significant difference in the calcified area ratios among the Ctl16, A12, P16 A6 + P10 and A4 + AP12 groups. Renal and aortic valvular calcification was significantly increased in both the A4 + AP12 and AP16 groups, while the same trend of VC was observed only in the A4 + AP12 group.
Figure 8. Quantitative comparisons of calcified deposition in the kidney, aortic valves, and thoracic aorta. The percentage of calcified area (CA) in the kidney (a), aortic valve (B) and thoracic aorta (C). CA and tissue area (TA) were measured using Image-Pro plus software (version 6.0). samples in each group: Ctl16 (n = 10), A12 (n = 6), P16 (n = 10), AP16 (n = 9), A6 + P10 (n = 9), A4 + P12 (n = 10), and A4 + AP12 (n = 9). the tissue calcium content was in the (D) kidney, (E) heart, and (F) abdominal aorta. Data are the mean ± SEM. ****p<0.0001, ***p< 0.001, **p<0.01, *p<0.05 vs Ctl16, determined by ANOVA with Bonferroni multiple comparison test. N = 5/each group.
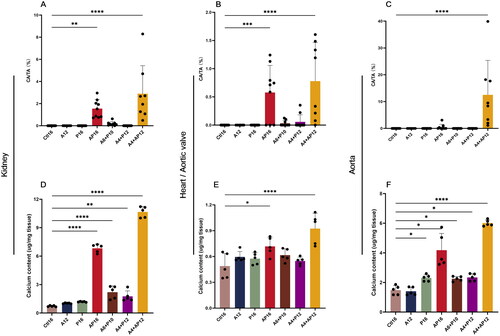
To further quantitatively evaluate calcification of the aorta, kidney, and aortic valve, the tissue calcium content of the heart, abdominal artery, and kidney in different groups was measured (). Aortic valves were alternated with using hearts since it was difficult to separate and measure aortic valves separately. Among all the groups, the calcium content of the A4 + AP12 mice increased dramatically compared with that of the other groups in the heart, abdominal arteries, and kidneys. This result was in line with the macroscopic observation stained by H&E and von Kossa. In addition, the calcium content of the kidneys was significantly elevated in the AP16 and A6 + P10 groups and moderately elevated in the A4 + P12 group, while no difference was observed in the A12 and P16 groups compared to the level in the Ctl16 group (). Although the heart calcium content was higher in the A12, P16, A4 + P12, A6 + P10, and AP16 groups, a significant difference among those groups was reached only in the AP16 group (). Vascular calcium deposition of the A12 group was comparable with that of the Ctl16 group; however, the other groups showed a significant increase as phosphorus and adenine loading was increased ().
Microchanges in the aortic valves, aorta, and kidney
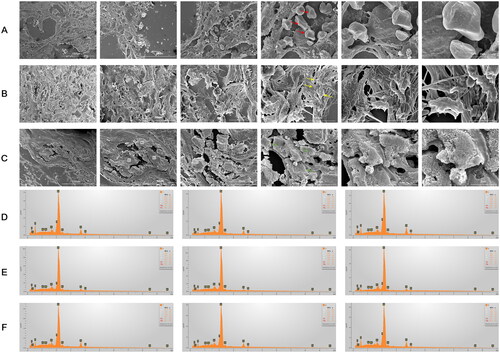
To further clarify the topographical characteristics of the CKD tissues, we examined samples of kidneys (), aortic valves (), and thoracic aortas () from the A4 + AP12 group with SEM. Calcific lesions revealed dense structures in three distinct forms—spherical particles, fibers, and compact material—compared to the non-calcific regions, which appeared smooth. The major morphology of calcified deposits showed a mixture of spherical particles and fibers in the aortic valve and a mixture of spherical particles and compact material in the kidney and thoracic aorta. Three regions of each tissue showing dense structures were measured by EDS (: labeled 1–3 in the kidney, 4–6 in the aortic valve, and 7–9 in the thoracic aorta). The elemental analysis confirmed that these structures contained an abundance of oxygen, carbon, calcium, and phosphorus, with small amounts of magnesium and sodium. Therefore, these calcific lesions were organic calcium-phosphate crystallization. Similar elemental composition was observed in bone [Citation35] and cardiovascular tissue calcification [Citation36] of humans.
Figure 9. SEM images and EDS Mapping analyses of kidney, aortic valve and thoracic tissues. The calcified deposition was observed in the kidney (a), aortic valve (B), and thoracic tissues (C) by SEM images. The calcified deposition in three distinct forms were labeled arrowhead with spherical particles (red arrowhead), fibers (yellow arrowhead) and compact material (green arrowhead). three regions of each tissue showing dense structures in SEM images were measured by EDS (D-F). the information of EDS spectra and their elementary composition were collected on micrographs of the kidney (a), aortic valve (B), and thoracic tissues (C) at the numbered sites labeled 1-3 (D), 4-6 (E), 7-9 (F), respectively. These structures contained an abundance of oxygen, carbon, calcium and phosphorus in descending order by content, with small amounts of magnesium and sodium.
Discussion
This research provided a group of novel and reliable mouse models showing the dynamic pathophysiology of CKD from mineral abnormalities to EC involving multiple organ systems with high survival and success-modeling rates. Previous studies added calcitriol, calcium, vitamin D, warfarin and even surgical hemi-nephrectomy based on adenine-induced CKD to accelerate the development of VC [Citation17,Citation19,Citation20,Citation25,Citation32]. However, patients with CKD rarely take long-term warfarin and most commonly manifest with vitamin D deficiency [Citation37–38]. In addition, abrupt renal failure from surgical hemi-nephrectomy is not consistent with the chronic pathophysiological process of CKD. Therefore, these additional pro-calcification factors may disturb the progression of CKD itself and conceal its pathophysiological characteristics. In the present study, our model simulated the cause, inducement, and histological changes in the human disease condition of CKD-associated calcification by reducing additional intervention as much as possible to improve operability and stability, which facilitated the development of subsequent experiments.
The present study was conducted in C57BL/6J mice by drug induction. Rats have typically been the original experimental objects of CKD models regardless of whether the method used to establish the model was surgery (5/6 nephrectomy, 5/6Nx) [Citation39] or drug induction [Citation40]. Rats have advantages in tolerance, sample size, and operability, while mice are more practicable and manageable considering some subsequent experiments such as drug treatment, genetic modification, and gene editing. While renal dysfunction was comparable for C57BL/6J male mice between the 5/6 Nx model and the adenine diet model, there was 50% mortality in the 5/6 Nx model [Citation41]. In addition, the adenine model avoids the potential confounding impact of surgical differences on nephrectomy and reduces the requirement of surgery and relevant technical ability, which helps to improve the feasibility, stability, and reliability of outcomes. Another advantage of the adenine-diet model is the consistent effect on renal impairment. Male mice were used to avoid the impact of estrogen-inhibiting VC [Citation42–43]. The C57BL/6J strain was selected because it is the most popular strain, while the mice are calcification-resistant [Citation44]. We established a C57BL/6 mouse model of calcification involving multiple organ systems by optimizing the inducing strength and time. Moreover, we circumvented the potential confounding impact of age or duration of disease by controlling the variable of induction time. Therefore, there is appreciable value for our models in preclinical research.
In our study, the severity of renal impairment was unparalleled with the incidence and degree of mineral metabolism disorder, hyperparathyroidism, and EC. Among the CKD groups, the A12 mice had the most severe renal impairment with the highest levels of Cr, BUN, glomerulosclerosis rate, and fibrotic rate, but no EC was detected. The A4 + P12 and A6 + P10 groups had similar conditions related to CKD, hyperparathyroidism, and mild calcified deposition in the kidney and aortic valves. When we offered a consistent impairment in renal function during the whole study period and added the phosphorus stimulus, there were dramatic abnormalities in mineral metabolism and FGF23 and PTH levels. In addition, calcification was observed in the kidneys, aortic valves, and aorta in the A4 + AP12 and AP16 groups. Therefore, adenine or phosphorus cannot induce hyperparathyroidism or EC alone, which was inconsistent with the previous report that 5-week-adenine-diet mice showed CKD-associated calcification [Citation29]. In addition, with increasing induction strength and time, calcification was observed in the kidneys, aortic valves, and aortas in sequence, although more severe calcification was exhibited in the A4 + AP12 mice than in the AP16 mice during the same induction time. Considering that more severe kidney impairment and higher mortality occurred in the A12 mice, there was more renal impairment induced in the adenine diet all one than in the adenine and high-phosphorus diet. This may be due to the essential interplay between the ingredients of adenine and phosphorus added to the mouse feed. Therefore, CKD was the basis of EC, and phosphorus seemed to be a catalyst for accelerating the progression of CKD-associated calcification. These results proved to some extent, the value of clinical practice guidelines recommending lowering elevated phosphorus levels toward the normal range in patients with CKD G3a–G5D (2 C) [Citation6].
By EDS analysis, calcium-phosphate particles deposited in various tissues were all verified to have a similar elemental composition as human cardiovascular tissue calcification [Citation36], which also indicated that EC in CKD involved multiple organ systems, not just vessels. Previous studies on animal models of CKD have paid more attention to the manifestation of VC, while the understanding of the correlation of calcified development among kidneys, vessels, and valves is far from satisfactory. To date, there has been no efficacious drug to reverse CVC. Hence, the development of animal models of calcification involving multiple organ systems is crucial to facilitate preclinical research on anti-calcification drugs and the assessment of their effects on CKD-associated calcification.
It was more likely that calcium-phosphate particles were deposited in the kidney than in the vessels and valves in our study. Nephrocalcinosis commonly involves the tubulointerstitial compartment, as a manifestation of systemic hypercalcemia mainly due to a variety of conditions including hyperparathyroidism, multiple myeloma, other malignancies, hypervitaminosis D or sarcoidosis [Citation45]. However, our study showed that calcium-phosphate particles were deposited not only in the tubulointerstitial compartment but in the glomerular and tubular basement membrane in CKD mice, which was first mentioned in Mulligan’s (1947) review and has been considered extremely rare in clinical [Citation46]. There are rare published case reports of EC involving glomeruli [Citation45,Citation47–50]. Of these, only one study reported glomerular calcification in a patient with CKD and secondary hyperparathyroidism [Citation45]. Rare cases of glomerular and tubular basement membrane calcification in CKD-MBD patients were reported, partly due to the lack of clinical indications for renal biopsy and routine pathological staining excluding calcium staining. Therefore, it may be potentially valuable for CKD-MBD clinical and mechanistic research to evaluate calcified deposition in the kidney.
This study had several limitations that should be noted. We did not clarify the specific components of these calcific lesions because of the device limitations. Further results involving mechanical and preclinical research cannot be shown. In addition, the models need a long period, which makes it difficult to clarify and exclude confounding factors.
Conclusion
This study provided a group of novel and reliable mouse models recapitulating the progression of CKD from mineral disorder to CKD-associated calcification. The severity of CKD was unparalleled with the incidence and degree of mineral metabolism disorder and EC. Calcification was closely related in different tissues and was observed in the glomerular and tubular basement membrane. In adition, the elemental composition of calcium-phosphate particles found in various tissues in mice matched the calcification of human cardiovascular tissue as determined by EDS. All these findings demonstrated that our models were valuable for exploring CKD-associated calcification.
Ethical approval
The authors are accountable for all aspects of the work, including ensuring that any questions related to the accuracy or integrity of any part of the work have been appropriately investigated and resolved. All procedures were approved by the Institutional Animal Care and Use Committee of Southeast University (No. 20190112009).
Author contributions
Research idea and study design: XY and XLZ. Data acquisition & analysis, or interpretation: XY, YQL, and XDZ. Manuscript Drafting: XY. Manuscript Revision/Editing: XY, PSC. Obtained Funding: XLZ, YZ, XTX, and TX. Approved Final Manuscript: XY, YQL, XDZ, PSC, XTX, TX, YZ, and XLZ. Final approval of manuscript: All authors. All authors have completed the ICMJE uniform disclosure form (Supplementary 4).
Supplemental Material
Download PDF (482.6 KB)Supplemental Material
Download PDF (71.2 KB)Supplemental Material
Download PDF (86.3 KB)Supplemental Material
Download PDF (92.8 KB)Disclosure statement
The author declares no conflicts of interests.
Additional information
Funding
References
- KDIGO clinical practice guideline for the diagnosis, evaluation, prevention, and treatment of chronic kidney disease-mineral and bone disorder (CKD-MBD). Kidney Int Suppl. 2009;(113):S1–S13.
- Schlieper G, Krüger T, Djuric Z, et al. Vascular access calcification predicts mortality in hemodialysis patients. Kidney Int. 2008;74(12):1582–1587. doi: 10.1038/ki.2008.458.
- Jankowski J, Floege J, Fliser D, et al. Cardiovascular disease in chronic kidney disease: pathophysiological insights and therapeutic options. Circulation. 2021;143(11):1157–1172. doi: 10.1161/CIRCULATIONAHA.120.050686.
- Paloian NJ, Giachelli CM. A current understanding of vascular calcification in CKD. Am J Physiol Renal Physiol. 2014;307(8):F891–F900. doi: 10.1152/ajprenal.00163.2014.
- Chen J, Budoff MJ, Reilly MP, et al. Coronary artery calcification and risk of cardiovascular disease and death among patients with chronic kidney disease. JAMA Cardiol. 2017;2(6):635–643. doi: 10.1001/jamacardio.2017.0363.
- Ketteler M, Block GA, Evenepoel P, et al. Diagnosis, evaluation, prevention, and treatment of chronic kidney disease-mineral and bone disorder: synopsis of the kidney disease: improving global outcomes 2017 clinical practice guideline update. Ann Intern Med. 2018;168(6):422–430. doi: 10.7326/M17-2640.
- Neven E, Dams G, Postnov A, et al. Adequate phosphate binding with lanthanum carbonate attenuates arterial calcification in chronic renal failure rats. Nephrol Dial Transplant. 2009;24(6):1790–1799. doi: 10.1093/ndt/gfn737.
- De Schutter TM, Behets GJ, Geryl H, et al. Effect of a magnesium-based phosphate binder on medial calcification in a rat model of uremia. Kidney Int. 2013;83(6):1109–1117. doi: 10.1038/ki.2013.34.
- Block GA, Spiegel DM, Ehrlich J, et al. Effects of sevelamer and calcium on coronary artery calcification in patients new to hemodialysis. Kidney Int. 2005;68(4):1815–1824. doi: 10.1111/j.1523-1755.2005.00600.x.
- Reiss AB, Miyawaki N, Moon J, et al. CKD, arterial calcification, atherosclerosis and bone health: inter-relationships and controversies. Atherosclerosis. 2018;278:49–59. doi: 10.1016/j.atherosclerosis.2018.08.046.
- Yamada S, Giachelli CM. Vascular calcification in CKD-MBD: roles for phosphate, FGF23, and Klotho. Bone. 2017;100:87–93. doi: 10.1016/j.bone.2016.11.012.
- Leopold JA. Vascular calcification: mechanisms of vascular smooth muscle cell calcification. Trends Cardiovasc Med. 2015;25(4):267–274. doi: 10.1016/j.tcm.2014.10.021.
- Chinetti-Gbaguidi G, Daoudi M, Rosa M, et al. Human alternative macrophages populate calcified areas of atherosclerotic lesions and display impaired RANKL-induced osteoclastic bone resorption activity. Circ Res. 2017;121(1):19–30. doi: 10.1161/CIRCRESAHA.116.310262.
- Zazzeroni L, Faggioli G, Pasquinelli G. Mechanisms of arterial calcification: the role of matrix vesicles. Eur J Vasc Endovasc Surg. 2018;55(3):425–432. doi: 10.1016/j.ejvs.2017.12.009.
- Kapustin AN, Chatrou ML, Drozdov I, et al. Vascular smooth muscle cell calcification is mediated by regulated exosome secretion. Circ Res. 2015;116(8):1312–1323. doi: 10.1161/CIRCRESAHA.116.305012.
- Yang L, Dai R, Wu H, et al. Unspliced XBP1 counteracts β-Catenin to inhibit vascular calcification. Circ Res. 2022;130(2):213–229. doi: 10.1161/CIRCRESAHA.121.319745.
- Pang Q, Wang P, Pan Y, et al. Irisin protects against vascular calcification by activating autophagy and inhibiting NLRP3-mediated vascular smooth muscle cell pyroptosis in chronic kidney disease. Cell Death Dis. 2022;13(3):283. doi: 10.1038/s41419-022-04735-7.
- De Maré A, Opdebeeck B, Neven E, et al. Sclerostin protects against vascular calcification development in mice. J Bone Miner Res. 2022;37(4):687–699. doi: 10.1002/jbmr.4503.
- Wang PW, Pang Q, Zhou T, et al. Irisin alleviates vascular calcification by inhibiting VSMC osteoblastic transformation and mitochondria dysfunction via AMPK/Drp1 signaling pathway in chronic kidney disease. Atherosclerosis. 2022;346:36–45. doi: 10.1016/j.atherosclerosis.2022.02.007.
- Arase H, Yamada S, Torisu K, et al. Protective roles of xenotropic and polytropic retrovirus receptor 1 (XPR1) in uremic vascular calcification. Calcif Tissue Int. 2022;110(6):685–697. doi: 10.1007/s00223-022-00947-3.
- Xie C, Chen C, Wu L, et al. BRCC36 prevents vascular calcification in chronic kidney disease through the β-catenin signalling pathway. Exp Cell Res. 2022;413(1):113051. doi: 10.1016/j.yexcr.2022.113051.
- Tóth A, Csiki DM, Nagy BJ, et al. Daprodustat accelerates high phosphate-induced calcification through the activation of HIF-1 signaling. Front Pharmacol. 2022;13:798053. doi: 10.3389/fphar.2022.798053.
- Oe Y, Mitsui S, Sato E, et al. Lack of endothelial nitric oxide synthase accelerates ectopic calcification in uremic mice fed an adenine and high phosphorus diet. Am J Pathol. 2021;191(2):283–293. doi: 10.1016/j.ajpath.2020.10.012.
- He W, Huang J, Liu Y, et al. Deletion of soluble epoxide hydrolase suppressed chronic kidney disease-related vascular calcification by restoring sirtuin 3 expression. Cell Death Dis. 2021;12(11):992. doi: 10.1038/s41419-021-04283-6.
- Su Z, Zong P, Chen J, et al. Celastrol attenuates arterial and valvular calcification via inhibiting BMP2/Smad1/5 signalling. J Cell Mol Med. 2020;24(21):12476–12490. doi: 10.1111/jcmm.15779.
- Tani T, Fujiwara M, Orimo H, et al. Inhibition of tissue-nonspecific alkaline phosphatase protects against medial arterial calcification and improves survival probability in the CKD-MBD mouse model. J Pathol. 2020;250(1):30–41. doi: 10.1002/path.5346.
- Huang LH, Liu H, Chen JY, et al. Seaweed porphyra yezoensis polysaccharides with different molecular weights inhibit hydroxyapatite damage and osteoblast differentiation of A7R5 cells. Food Funct. 2020;11(4):3393–3409. doi: 10.1039/c9fo01732a.
- Kukida M, Mogi M, Kan-No H, et al. AT2 receptor stimulation inhibits phosphate-induced vascular calcification. Kidney Int. 2019;95(1):138–148. doi: 10.1016/j.kint.2018.07.028.
- Nguyen-Yamamoto L, Tanaka KI, St-Arnaud R, et al. Vitamin D-regulated osteocytic sclerostin and BMP2 modulate uremic extraskeletal calcification. JCI Insight. 2019;4(13):e126467. doi: 10.1172/jci.insight.126467.
- Clinkenbeard EL, Noonan ML, Thomas JC, et al. Increased FGF23 protects against detrimental cardio-renal consequences during elevated blood phosphate in CKD. JCI Insight. 2019;4(4):e123817. doi: 10.1172/jci.insight.123817.
- Li XY, Li QM, Fang Q, et al. Laminaria japonica polysaccharide inhibits vascular calcification via preventing osteoblastic differentiation of vascular smooth muscle cells. J Agric Food Chem. 2018;66(8):1821–1827. doi: 10.1021/acs.jafc.7b06115.
- Yoshida T, Yamashita M, Horimai C, et al. Smooth muscle-selective nuclear factor-κB inhibition reduces phosphate-induced arterial medial calcification in mice with chronic kidney disease. J Am Heart Assoc. 2017;6(11):e007248.
- Tani T, Orimo H, Shimizu A, et al. Development of a novel chronic kidney disease mouse model to evaluate the progression of hyperphosphatemia and associated mineral bone disease. Sci Rep. 2017;7(1):2233. doi: 10.1038/s41598-017-02351-6.
- Gao C, Fu Y, Li Y, et al. Microsomal prostaglandin E synthase-1-derived PGE2 inhibits vascular smooth muscle cell calcification. Arterioscler Thromb Vasc Biol. 2016;36(1):108–121. doi: 10.1161/ATVBAHA.115.306642.
- Biltz RM, Pellegrino ED. The chemical anatomy of bone. I. A comparative study of bone composition in sixteen vertebrates. J Bone Joint Surg Am. 1969;51(3):456–466. doi: 10.2106/00004623-196951030-00003.
- Bertazzo S, Gentleman E, Cloyd KL, et al. Nano-analytical electron microscopy reveals fundamental insights into human cardiovascular tissue calcification. Nat Mater. 2013;12(6):576–583. doi: 10.1038/nmat3627.
- Laclair RE, Hellman RN, Karp SL, et al. Prevalence of calcidiol deficiency in CKD: a cross-sectional study across latitudes in the United States. Am J Kidney Dis. 2005;45(6):1026–1033. doi: 10.1053/j.ajkd.2005.02.029.
- Melamed ML, Chonchol M, Gutiérrez OM, et al. The role of vitamin D in CKD stages 3 to 4: report of a scientific workshop sponsored by the national kidney foundation. Am J Kidney Dis. 2018;72(6):834–845. doi: 10.1053/j.ajkd.2018.06.031.
- Morrison AB. Experimentally induced chronic renal insufficiency in the rat. Lab Invest. 1962;11:321–332.
- Yokozawa T, Zheng PD, Oura H, et al. Animal model of adenine-induced chronic renal failure in rats. Nephron. 1986;44(3):230–234. doi: 10.1159/000183992.
- Kim K, Anderson EM, Thome T, et al. Skeletal myopathy in CKD: a comparison of adenine-induced nephropathy and 5/6 nephrectomy models in mice. Am J Physiol Renal Physiol. 2021;321(1):F106–F119. doi: 10.1152/ajprenal.00117.2021.
- Mcrobb LS, Mcgrath K, Tsatralis T, et al. Estrogen receptor control of atherosclerotic calcification and smooth muscle cell osteogenic differentiation. Arterioscler Thromb Vasc Biol. 2017;37(6):1127–1137. doi: 10.1161/ATVBAHA.117.309054.
- Osako MK, Nakagami H, Koibuchi N, et al. Estrogen inhibits vascular calcification via vascular RANKL system: common mechanism of osteoporosis and vascular calcification. Circ Res. 2010;107(4):466–475. doi: 10.1161/CIRCRESAHA.110.216846.
- Ivandic BT, Utz HF, Kaczmarek PM, et al. New dyscalc loci for myocardial cell necrosis and calcification (dystrophic cardiac calcinosis) in mice. Physiol Genomics. 2001;6(3):137–144. doi: 10.1152/physiolgenomics.2001.6.3.137.
- Troxell ML, Higgins JP, Sibley RK. Glomerular and tubular basement membrane calcinosis: case report and literature review. Am J Kidney Dis. 2006;47(2):e23–e26. doi: 10.1053/j.ajkd.2005.10.030.
- Mulligan RM. Metastatic calcification. Arch Pathol. 1947;43(2):177–230.
- Trillo A, Orozco R, Jindal K. Glomerular calcinosis in sarcoidosis. Arch Pathol Lab Med. 1992;116(11):1221–1225.
- Fellner SK, Spargo BH. Nephrotic syndrome from hypercalcemia in a patient with primary hyperparathyroidism. Am J Med. 1987;83(2):355–358. doi: 10.1016/0002-9343(87)90712-1.
- Ross L, Wing C. Metastatic calcification of renal glomerular basement-membrane. J Pathol. 1970;101(1):69–71. doi: 10.1002/path.1711010113.
- Henegar JR, Coleman JP, Cespedes J, et al. Glomerular calcification in hypercalcemic nephropathy. Arch Pathol Lab Med. 2003;127(2):E80–E85. doi: 10.5858/2003-127-e80-GCIH.