
Abstract
Background
Muscle mass is important in determining patients’ nutritional status. However, measurement of muscle mass requires special equipment that is inconvenient for clinical use. We aimed to develop and validate a nomogram model for predicting low muscle mass in patients undergoing hemodialysis (HD).
Methods
A total of 346 patients undergoing HD were enrolled and randomly divided into a 70% training set and a 30% validation set. The training set was used to develop the nomogram model, and the validation set was used to validate the developed model. The performance of the nomogram was assessed using the receiver operating characteristic (ROC) curve, a calibration curve, and the Hosmer–Lemeshow test. A decision curve analysis (DCA) was used to evaluate the clinical practicality of the nomogram model.
Results
Age, sex, body mass index (BMI), handgrip strength (HGS), and gait speed (GS) were included in the nomogram for predicting low skeletal muscle mass index (LSMI). The diagnostic nomogram model exhibited good discrimination with an area under the ROC curve (AUC) of 0.906 (95% CI, 0.862–0.940) in the training set and 0.917 (95% CI, 0.846–0.962) in the validation set. The calibration analysis also showed excellent results. The nomogram demonstrated a high net benefit in the clinical decision curve for both sets.
Conclusions
The prediction model included age, sex, BMI, HGS, and GS, and it can successfully predict the presence of LSMI in patients undergoing HD. This nomogram provides an accurate visual tool for medical staff for prediction, early intervention, and graded management.
Background
Sarcopenia is highly prevalent in patients undergoing hemodialysis (HD) and is associated with adverse clinical outcomes [Citation1–3]. Therefore, it is crucial to identify sarcopenia in a timely manner for early intervention. Muscle mass is a key component of sarcopenia. However, the measurement of muscle mass requires special equipment such as dual-energy X-ray absorptiometry (DEXA), magnetic resonance imaging (MRI), and bioelectrical impedance analysis (BIA) [Citation4]. The equipment has some disadvantages, such as high cost and poor accessibility, which limit its wide clinical application [Citation5–7]. Very few dialysis centers have direct access to these devices. Consequently, sarcopenia is often underdiagnosed and undertreated in clinical practice. In addition to sarcopenia, muscle mass measurements are included in other approaches used to define nutritional status, such as protein energy wasting [Citation8], malnutrition [Citation9], and cachexia [Citation10]. Therefore, developing and validating an optimal tool that can estimate muscle mass based on simple parameters is of paramount clinical relevance.
The Global Leadership Initiative on Malnutrition (GLIM) recently updated the definition of malnutrition in 2019 [Citation9]. A reduction in muscle mass is a diagnostic criterion. Considering that muscle mass measurement using specialized equipment is still not available in most institutions worldwide, the GLIM consensus states that assessment of muscle function, such as handgrip strength (HGS), can be used as a supportive measure for muscle mass [Citation9]. The prognostic value of malnutrition, defined according to the GLIM criteria using HGS, has been verified in cancer patients [Citation11]. Very recently, it was reported that gait speed (GS) is another predictor of low muscle mass in cancer patients, and a model for low muscle mass prediction including GS was developed and validated [Citation12]. Among patients on HD, serum creatinine, a routinely measured biochemical marker, was also considered to be correlated with muscle mass [Citation13]. Assessing these factors is generally advantageous because of their simplicity, low cost, and ease of use [Citation14,Citation15]. However, the value of these nutritional status markers such as HGS and GS, assessed alone or in combination with serum creatinine, for predicting low muscle mass has rarely been investigated in patients undergoing HD, although the utility of HGS in estimating lean body mass has been investigated in chronic kidney disease (CKD) patients not receiving dialysis [Citation16].
Nomograms have recently received increasing attention and have been widely used to predict the risk of disease. A nomogram is a picture that is used to visualize the data analysis results. The form of the prediction tool is visual and intuitive [Citation17]. It has been shown to enable more accurate prediction for individual patients with diverse types of disease [Citation18–21]. Recent studies have developed and validated a nomogram for predicting sarcopenia in community-dwelling older adults and low muscle mass in patients with gastric cancer [Citation12,Citation17]. Those models can facilitate early identification and timely intervention for high-risk populations. Therefore, our study aimed to develop and validate a nomogram model using conveniently measured factors for the early identification of a low skeletal muscle mass index (LSMI), thus facilitating timely diagnosis and treatment in clinical practice.
Methods
Subjects and study design
We included all patients who participated in the previous cross-sectional study from September 2020 to January 2021 in our hemodialysis center [Citation22]. The inclusion criteria included being at least 18 years old and being on maintenance hemodialysis three times weekly for ≥ eight weeks. The exclusion criteria included the following: (1) patients who could not undergo BIA, (i.e., those who underwent pacemaker installation), or patients who underwent amputation surgery; (2) those with an acute infection; (3) those who had cardiovascular events or hospitalization within three months; (4) those who had been diagnosed with malignancies; (5) those with muscular and neuromuscular disorders; (6) those with severe edema or cognitive dysfunction; and (7) those confined to bed or a wheelchair. All patients provided written informed consent to participate in the study. The ethics committee of the hospital approved the study (no. 2020KY116).
Clinical, laboratory and nutritional parameters
Collection and measurement of samples were performed as previously described [Citation22]. Age, sex, dialysis vintage, primary kidney disease, body mass index (BMI), residual kidney function (RKF), and laboratory data were collected at the time of research recruitment. RKF was defined as a 24-h urine output of more than 200 mL. All laboratory parameters, including hemoglobin and serum concentrations of creatinine [SCr], blood urea nitrogen [BUN], hypersensitive C-reactive protein [hs-CRP], triglyceride [TG], total cholesterol [TCH], serum phosphorus, serum albumin, and total protein, were tested using fasting blood samples collected before dialysis at the midweek session. Intact parathyroid hormone [iPTH] assays were used to determine serum parathyroid hormone concentrations. Single-pool Kt/V for urea was calculated as an indicator of dialysis dose, and normalized protein equivalent of nitrogen appearance (nPNA) was calculated as an indicator of protein metabolism [Citation23].
The Modified Quantitative Subjective Global Assessment (MQSGA) was used as an indicator of nutritional status. There are seven variables with a total score ranging from 7 to 35; a score of 7 indicates normal and 35 indicates severe malnutrition [Citation24]. It has been widely used in the assessment of nutritional status in hemodialysis patients [Citation25,Citation26].
Measurement of muscle function
Muscle function was measured using HGS or GS [Citation27]. HGS was measured using a grip strength dynamometer (Guangdong Xiangshan Weighing Apparatus Group, China) before dialysis. All patients stood with their elbows fully extended. They were asked to squeeze the dynamometer using the non-fistulated hand (or the dominant hand for patients with central venous catheters). HGS was assessed in two consecutive trials with a 1-min interval between each trial, and the highest reading was recorded for analysis. GS was evaluated by a 6-m walking test at a normal pace before dialysis. A 10-m walking line was prepared with separate sections for walking and measurement. Participants were instructed to walk the distance at their normal pace, while the time taken to cover the 6-m measurement section was recorded using a stopwatch. The average result of the two trials was calculated and recorded.
Assessment of muscle mass
Skeletal muscle mass was measured by a multifrequency BIA device, model Seca515 (Seca GmbH & Co., Germany). To eliminate the influence of excessive body fluids on the measurement, BIA tests were timed after HD treatment, when patients reached the estimated dry weight. The estimated dry weight was determined by a nephrologist using clinical features, blood pressure, chest radiograph, inferior vena cava diameter, and serum natriuretic peptide level. According to the Kidney Disease Outcomes Quality Initiative (KDOQI) clinical practice guideline for BIA use in adults undergoing HD, BIA measurements were performed 30 min after the end of the dialysis session to allow for redistribution of body fluids [Citation28]. All patients were asked to eat only small snacks (e.g., small biscuits) during HD to prevent hypoglycemia and to fast for more than 2 h before the BIA measurement. The skeletal muscle index (SMI) was computed by dividing the skeletal muscle mass (kg) by the square of the height (m) [Citation29]. LSMI was defined as < 7.0 kg/m2 for males and < 5.7 kg/m2 for females [Citation27].
Physical activity level measurements
The international physical activity questionnaire (IPAQ) was used to assess physical activity level (PAL). It has been tested and has demonstrated acceptable reliability and validity [Citation30]. The questionnaire mainly evaluated the occupation, housework, transportation, and leisure physical activity of patients during the last seven days.
Statistical analysis
The study dataset was randomly divided into a 70% training set and a 30% validation set. The training set was used to develop the nomogram model, and the validation set was used to validate the developed model. Normally and nonnormally distributed continuous variables are presented as the mean ± standard deviation (SD), median, and interquartile range. Categorical variables were described as numbers (percentages). Comparisons of the groups were conducted using Student’s t test, the Mann–Whitney U test, or the chi-square test, depending on the type of variables.
Logistic regression analysis was used to construct a prediction model for LSMI in the training set. Variables with statistical significance in the univariate analysis (p < .05) were included in the multivariate logistic regression analysis through a backward conditional process. Based on the independent predictive factors, a nomogram was developed. Every variable in the nomogram plot could obtain a corresponding score on the top point line (0–100 points by default), and the final score was equal to the sum of the scores for each variable [Citation17]. This equation was also used to calculate the total points for each patient. The total points were then incorporated into the receiver operating characteristic (ROC) curve to obtain the optimal cutoff value. The discrimination performance of the nomogram model for predicting LSMI was analyzed using ROC curves in both the training and validation sets. In general, an area under the ROC curve (AUC) of 0.5 indicates no discrimination, 0.7 to 0.8 is considered acceptable, 0.8 to 0.9 is considered excellent, and more than 0.9 is considered outstanding [Citation31]. A p value >.05 in the Hosmer–Lemeshow test indicates a high calibration performance. Decision curve analysis (DCA) was used to evaluate the clinical practicality of the nomogram model.
Statistical analyses were performed using SPSS (version 23.0; IBM, Armonk, NY) and R software, version 4.1.3 (R Project for Statistical Computing, Vienna, Austria). All statistical tests were two-sided, and a p value <.05 was regarded as statistically significant.
Results
Baseline characteristics of the study population
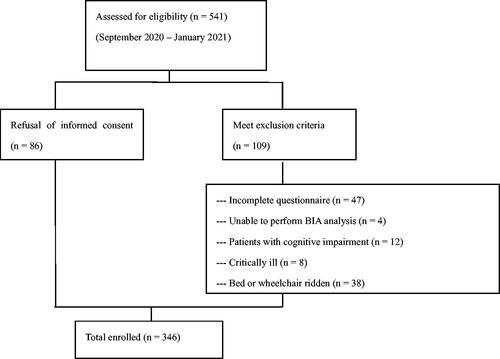
In total, 541 patients were assessed for eligibility between September 2020 and January 2021. We excluded 109 patients who met the exclusion criteria and 86 patients who refused to provide informed consent. A flowchart representing the patient selection process is presented in . Finally, 346 patients were enrolled and randomly divided into a training cohort (n = 244) or a validation cohort (n = 102).
Figure 1. Flow chart of the participants.
Note: ‘critically ill’ refers to individuals who had experienced cardiovascular events or hospitalization within the past 3 months, or who had acute infections or malignancies.
Of the 346 patients on maintenance hemodialysis (MHD), 129 were diagnosed with LSMI, with a prevalence of 37.3%. Patients with low muscle mass were significantly older than those with normal muscle mass. SCr, albumin, phosphorus, SMI, BMI, HGS, and GS were lower, whereas MQSGA were higher in the low muscle mass group. The baseline characteristics of the training and validation sets are presented in .
Table 1. Baseline characteristics of the training set and validation set.
Derivation of the predictive factors in the training set
Univariate analysis showed that age, sex, Kt/V, BUN, SCr, TCH, albumin, phosphorus, MQSGA, BMI, HGS, GS and PAL were associated with the LSMI in the training set (). As phosphorus-lowering drugs and cholesterol-lowering drugs are frequently prescribed to the HD population and have a significant impact on the predictive ability of serum phosphorus and TCH levels for low muscle mass, we excluded them in the multivariate analysis. In multivariate logistic regression analysis, age (1.090; 95% CI, 1.045–1.138), sex (0.239; 95% CI, 0.068–0.840), BMI (0.515; 95% CI, 0.415–0.641), HGS (0.851; 95% CI, 0.780–0.929), and GS (0.015; 95% CI, 0.001–0.206) were independently associated with LSMI ().
Table 2. Univariate analysis for LSMI in the training set.Table Footnotea
Table 3. Multivariate logistic regression analysis for LSMI in the training set.Table Footnotea
Construction of a nomogram for predicting LSMI
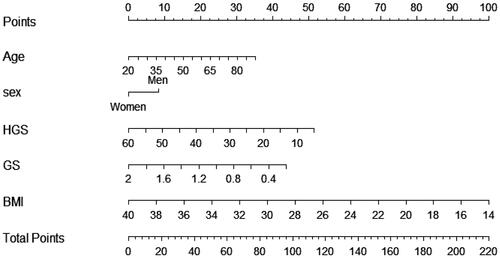
The nomogram for LSMI was developed based on all the independent significant factors in the training set (). Equations were extracted from the nomogram to calculate the total points for each patient. In the nomogram, the total points = 0.5025 × age (y) + 8.3022 × sex (male:1; female:0) − 0.9343 × HGS (kg) − 24.2520 × gait speed (m/s) − 3.8462 × BMI + 248.36.
Figure 2. The nomogram for predicting LSMI based on the training cohort (n = 244). HGS: handgrip strength; GS: gait speed; BMI: body mass index.
Discrimination and calibration
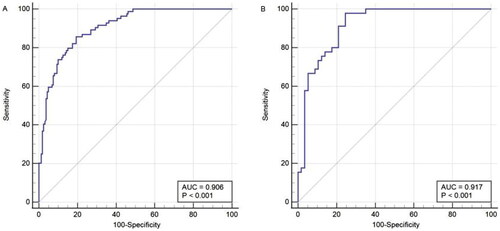
To examine the discriminative ability of the nomogram, the ROC curve of the nomogram was plotted, and the AUC was calculated (). The AUC values for the LSMI nomogram were 0.906 (95% CI, 0.862–0.940) in the training cohort and 0.917 (95% CI, 0.846–0.962) in the validation cohort, indicating an excellent ability to discriminate between patients with and without LSMI.
Figure 3. The ROC curves of nomogram for predicting LSMI in the training set (A, n = 244) and validation set (B, n = 102).
In the training set, the optimal cutoff value of the total nomogram points was 157.3 for LSMI when the Youden index reached a maximum of 1.66, and the corresponding sensitivity and specificity were 85.71% and 80.62%, respectively. If a patient’s total score was higher than the cutoff threshold, he or she was identified as having LSMI. With this cutoff value, the sensitivity and specificity in the validation set were 80.00% and 80.70%, respectively. In the total population, the sensitivity and specificity were 83.72% and 80.65%, respectively ().
Table 4. Accuracy of the nomogram to predict low skeletal muscle mass index.
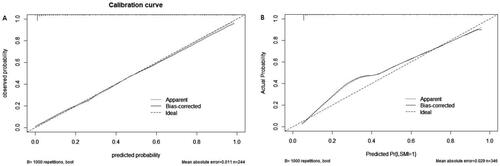
The calibration of the nomogram was checked by the calibration curve using the Hosmer–Lemeshow test. The calibration curves showed agreement between the observation and prediction (), and the Hosmer–Lemeshow tests for the calibration analysis showed that the p values in the training and validation sets were .792 and .230, respectively, indicating that there was no deviation from the perfect fit.
Figure 4. The calibration curves for predicting LSMI in the training (A, n = 244) and validation (B, n = 102) sets.
Clinical practicality
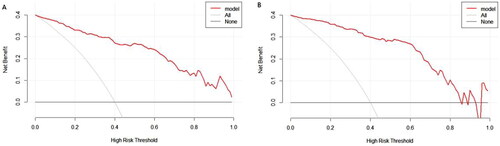
DCA was conducted for the prediction nomogram (). The results indicate that utilizing the nomogram to predict LSMI may offer greater benefits than either treating all patients or treating none, for a threshold probability less than 0.85.
Figure 5. Decision curves for the proposed nomogram model in (A, n = 244) the training set and (B, n = 102) the validation set.
Discussion
To the best of our knowledge, this is the first study to assess the predictive ability of easily available parameters, including BMI, SCr, HGS, and GS, for low muscle mass using a nomogram model. We established a model to predict LSMI. Age, sex, BMI, HGS, and GS were found to be independent predictive factors for LSMI. A diagnostic nomogram consisting of these factors successfully predicted LSMI with good accuracy and discrimination. Among the available methods for the assessment of muscle mass, we consider the nomogram model advantageous because LSMI can be easily assessed using this nomogram. The factors included in the nomogram model were practical and easy to measure.
Sarcopenia refers to the decline and dysfunction of skeletal muscle [Citation27]. Protein energy wasting (PEW) is commonly used to describe the process of CKD-related wasting resulting from impaired kidney function [Citation8]. It can be caused by compromised intake or assimulation of nutrients, as well as disease-associated inflammatory or other mechanisms [Citation32]. Both sarcopenia and protein-energy wasting (PEW) are highly prevalent among patients undergoing HD [Citation3,Citation33]. Among these pathological conditions, low muscle mass is a prevalent component. The rapid method to diagnose low muscle mass may also provide clinicians with some diagnostic clues about these pathological conditions.
A recent study assessed the predictive ability of accessible factors for low muscle mass in patients with gastric cancer. Age, BMI, hemoglobin concentration, and GS were included in the nomogram model for predicting LSMI, and the diagnostic nomogram exhibited good discrimination, with an AUC of 0.818 in the training set and 0.809 in the validation set [Citation12]. The factors included in the nomogram were similar to those used in our study. HGS was also included in the nomogram model in our study. Evidence suggests that the decline in muscle strength generally exceeds changes in muscle mass [Citation34]. HGS has been recommended as a supportive measure of muscle mass using the GLIM criteria [Citation9]. A recent study demonstrated that malnutrition, defined by GLIM criteria using HGS, could predict six-month mortality [Citation11]. Second, HGS was reported to be closely correlated with other nutritional parameters, such as the protein index (assessed using neutron activation) [Citation12]. Evidence suggests that HGS is a valid measure of nutritional status compared to malnutrition inflammation score (MIS) in patients on HD [Citation35]. HGS is recommended as an indicator of protein energy status by KDOQI guidelines [Citation28]. Third, HGS is reported to be associated with lean body mass (LBM) [Citation16]. Fourth, it was demonstrated that HGS was improved with nutritional supplementation [Citation36], indicating its use as a marker of nutritional interventions. These findings support its utility in predicting low muscle mass.
GS represents physical performance and is closely associated with lower extremity muscle mass [Citation37]. It serves as a predictive indicator for mortality among patients undergoing HD [Citation38], highlighting its significance in patient care. Physical performance not only predicts low muscle mass but also represents a potential therapeutic target. Aerobic exercise, for instance, may improve the physical performance and clinical outcomes of patients [Citation39]. In our study, the combination of HGS and GS, along with age, sex, and BMI, performed well in predicting LSMI with an AUC of 0.906 in the training set and 0.917 in the validation set.
Aging is characterized by accelerated muscle loss [Citation40]. Sex was also significantly associated with low muscle mass in our study. Males were at a higher risk of low muscle mass than females, which is consistent with a previous study [Citation40,Citation41]. Testosterone deficiency is a common finding among patients with end-stage renal disease (ESRD) [Citation42]. Testosterone is an anabolic steroid that promotes skeletal muscle synthesis, and testosterone deficiency can easily lead to low muscle mass. BMI is the most commonly used surrogate of nutritional status. It was demonstrated that the higher BMI group had a greater LBM and fat mass (FM) [Citation43]. An inverse relationship was observed between BMI and mortality [Citation44].
We found that the association between serum albumin levels and low muscle mass disappeared in multivariate analysis. Although serum albumin is routinely tested in dialysis centers, it is not sufficiently sensitive to assess nutritional status. It may take months for sustained visceral protein depletion to develop hypoalbuminemia. It may also be influenced by other nonnutritional factors [Citation28]. Serum creatinine was considered not only a uremic marker but also a predictor of nutritional status and muscle mass. However, it is affected by residual kidney function, dialysis adequacy, and dietary protein (meat) intake. In our study, serum creatinine levels were excluded from multivariate analysis. In addition to our research, Bataille et al. also did not recommend the use of serum creatinine levels in the prediction of low muscle mass [Citation45]. The creatinine generation rate (CGR) derived from the creatinine kinetic model has also been proposed as an indicator of muscle mass. However, the relationship between CGR and muscle mass has been reported to be insufficiently strong and is affected by Kt/V [Citation29].
For clinicians, a cost-effective and simplified method for the rapid diagnosis of low muscle mass is highly desirable. Among the variables that were incorporated into the nomogram model in our study, GS is widely used in practice due to its rapidity, security, and high reliability [Citation15]. Similarly, HGS is also recommended for regular use in both hospital settings and community healthcare practices [Citation46,Citation47]. In addition, body weight measurements were taken after each dialysis session for HD patients. Therefore, we believe that the nomogram model is beneficial not only for regular evaluation but also for routine monitoring among patients undergoing HD.
This study has some potential limitations. First, we used BIA, rather than DEXA, to diagnose LSMI. The accuracy of muscle mass measurement by BIA in hemodialysis patients has been confirmed and applied in multiple studies [Citation29,Citation45,Citation48–53], and it was recommended to assess body composition according to the KDOQI guidelines [Citation28]. To eliminate the effect of excess fluid, we excluded patients with severe edema, and the time of the measurements was set after the end of HD, when they approached the ideal weight. Thus, we considered the accuracy of muscle mass assessment using BIA to be reliable. Second, we excluded patients with the highest risk of LSMI, such as patients confined to bed or a wheelchair. Therefore, further studies are needed before extrapolating these results to the aforementioned excluded patients. Finally, although our findings were validated in the validation cohort, the sample size was relatively small, and studies with a larger number of patients are needed to further verify the reliability of our results.
Conclusion
We first developed a prediction model to identify LSMI in patients undergoing HD. The nomogram model included age, sex, BMI, HGS, and GS. It successfully predicted the presence of LSMI. This nomogram provides an accurate visual tool for early identification and timely intervention.
Author contributions
Conceptualization, R. R. T. and H. M. Z.; data curation, R. R. T. and L. Y. C.; data analysis, R. R. T. and Y. Z.; investigation, R. R. T. and L. Y. C.; methodology, R. R. T.; project administration, H. M. Z.; supervision, H. M. Z.; validation, H. M. Z.; writing-original draft, R. R. T. All authors have read and agreed to the published version of the manuscript.
Disclosure statement
No potential conflict of interest was reported by the author(s).
Additional information
Funding
References
- Hars M, Biver E, Chevalley T, et al. Low lean mass predicts incident fractures independently from FRAX: a prospective cohort study of recent retirees. J Bone Miner Res. 2016;31(11):1–9. doi: 10.1002/jbmr.2878.
- Lin Y, Liou H, Wang C, et al. Impact of sarcopenia and its diagnostic criteria on hospitalization and mortality in chronic hemodialysis patients: a 3-year longitudinal study. J Formos Med Assoc. 2020;119(7):1219–1229. doi: 10.1016/j.jfma.2019.10.020.
- Nishi H, Takemura K, Higashihara T, et al. Uremic sarcopenia: clinical evidence and basic experimental approach. Nutrients. 2020;12(6):1814. doi: 10.3390/nu12061814.
- Cruz-Jentoft AJ, Bahat G, Bauer J, et al. Sarcopenia: revised European consensus on definition and diagnosis. Age Ageing. 2019;48(1):16–31. doi: 10.1093/ageing/afy169.
- Carrero JJ, Johansen KL, Lindholm B, et al. Screening for muscle wasting and dysfunction in patients with chronic kidney disease. Kidney Int. 2016;90(1):53–66. doi: 10.1016/j.kint.2016.02.025.
- Erlandson MC, Lorbergs AL, Mathur S, et al. Muscle analysis using pQCT, DXA and MRI. Eur J Radiol. 2016;85(8):1505–1511. doi: 10.1016/j.ejrad.2016.03.001.
- Delgado C, Johansen KL. Revisiting serum creatinine as an indicator of muscle mass and a predictor of mortality among patients on hemodialysis. Nephrol Dial Transplant. 2020;35(12):2033–2035. doi: 10.1093/ndt/gfaa251.
- Fouque D, Kalantar-Zadeh K, Kopple J, et al. A proposed nomenclature and diagnostic criteria for protein-energy wasting in acute and chronic kidney disease. Kidney Int. 2008;73(4):391–398. doi: 10.1038/sj.ki.5002585.
- Cederholm T, Jensen GL, Correia MITD, et al. GLIM criteria for the diagnosis of malnutrition – a consensus report from the global clinical nutrition community. Clin Nutr. 2019;38(1):1–9. doi: 10.1016/j.clnu.2018.08.002.
- Fearon K, Strasser F, Anker SD, et al. Definition and classification of cancer cachexia: an international consensus. Lancet Oncol. 2011;12(5):489–495. doi: 10.1016/S1470-2045(10)70218-7.
- Contreras-Bolivar V, Sanchez-Torralvo FJ, Ruiz-Vico M, et al. GLIM criteria using hand grip strength adequately predict six-month mortality in cancer inpatients. Nutrients. 2019;11(9): 2043. doi: 10.3390/nu11092043.
- Zhang FM, Chen XL, Wu Q, et al. Development and validation of nomograms for the prediction of low muscle mass and radiodensity in gastric cancer patients. Am J Clin Nutr. 2021;113(2):348–358. doi: 10.1093/ajcn/nqaa305.
- Park J, Jin DC, Molnar MZ, et al. Mortality predictability of body size and muscle mass surrogates in Asian vs White and African American hemodialysis patients. Mayo Clin Proc. 2013;88(5):479–486. doi: 10.1016/j.mayocp.2013.01.025.
- Ibrahim K, May CR, Patel HP, et al. Implementation of grip strength measurement in medicine for older people wards as part of routine admission assessment: identifying facilitators and barriers using a theory-led intervention. BMC Geriatr. 2018;18(1):79. doi: 10.1186/s12877-018-0768-5.
- Bruyere O, Beaudart C, Reginster JY, et al. Assessment of muscle mass, muscle strength and physical performance in clinical practice: an international survey. Eur Geriatr Med. 2016;7(3):243–246. doi: 10.1016/j.eurger.2015.12.009.
- Heimbürger O, Qureshi AR, Blaner WS, et al. Hand-grip muscle strength, lean body mass, and plasma proteins as markers of nutritional status in patients with chronic renal failure close to start of dialysis therapy. Am J Kidney Dis. 2000;36(6):1213–1225. doi: 10.1053/ajkd.2000.19837.
- Mo Y, Su Y, Dong X, et al. Development and validation of a nomogram for predicting sarcopenia in community-dwelling older adults. J Am Med Dir Assoc. 2022;23(5):715–721.e5. doi: 10.1016/j.jamda.2021.11.023.
- Wang S, Tian S, Li Y, et al. Development and validation of a novel scoring system developed from a nomogram to identify malignant pleural effusion. Ebiomedicine. 2020;58:102924. doi: 10.1016/j.ebiom.2020.102924.
- Zhang J, Xiao L, Pu S, et al. Can We reliably identify the pathological outcomes of neoadjuvant chemotherapy in patients with breast cancer? Development and validation of a logistic regression nomogram based on preoperative factors. Ann Surg Oncol. 2021;28(5):2632–2645. doi: 10.1245/s10434-020-09214-x.
- Chen Y, Cai Y, Kang X, et al. Predicting the risk of sarcopenia in elderly patients with patellar fracture: development and assessment of a new predictive nomogram. PeerJ. 2020;8:e8793. doi: 10.7717/peerj.8793.
- Guo D, Wang H, Lai X, et al. Development and validation of a nomogram for predicting acute kidney injury after orthotopic liver transplantation. Ren Fail. 2021;43(1):1588–1600. doi: 10.1080/0886022X.2021.2009863.
- Tian R, Chang L, Liu D, et al. Association of the modified creatinine index with muscle strength and mortality in patients undergoing hemodialysis. Ren Fail. 2022;44(1):1732–1742. doi: 10.1080/0886022X.2022.2134027.
- National Kidney Foundation. K/DOQI clinical practice guidelines for nutrition in chronic renal failure. Am J Kidney Dis. 2000;35(6 Suppl 2):S1–S140.
- Kalantar-Zadeh K, Kleiner M, Dunne E, et al. A modified quantitative subjective global assessment of nutrition for dialysis patients. Nephrol Dial Transplant. 1999;14(7):1732–1738. doi: 10.1093/ndt/14.7.1732.
- Hou Y, Li X, Hong D, et al. Comparison of different assessments for evaluating malnutrition in Chinese patients with end-stage renal disease with maintenance hemodialysis. Nutr Res. 2012;32(4):266–271. doi: 10.1016/j.nutres.2012.02.006.
- Jiang J, Ni L, Ren W, et al. Nutritional status in short daily hemodialysis versus conventional hemodialysis patients in China. Int Urol Nephrol. 2018;50(4):755–762. doi: 10.1007/s11255-018-1804-2.
- Chen L, Woo J, Assantachai P, et al. Asian working group for sarcopenia: 2019 consensus update on sarcopenia diagnosis and treatment. J Am Med Dir Assoc. 2020;21(3):300–307.e2. doi: 10.1016/j.jamda.2019.12.012.
- Ikizler TA, Burrowes JD, Byham-Gray LD, et al. KDOQI clinical practice guideline for nutrition in CKD: 2020 update. Am J Kidney Dis. 2020;76(3 Suppl 1):S1–S107. doi: 10.1053/j.ajkd.2020.05.006.
- Mae Y, Takata T, Yamada K, et al. Creatinine generation rate can detect sarcopenia in patients with hemodialysis. Clin Exp Nephrol. 2022;26(3):272–277. doi: 10.1007/s10157-021-02142-4.
- Craig CL, Marshall AL, Sjöström M, et al. International physical activity questionnaire: 12-country reliability and validity. Med Sci Sports Exerc. 2003;35(8):1381–1395. doi: 10.1249/01.MSS.0000078924.61453.FB.
- Mandrekar JN. Receiver operating characteristic curve in diagnostic test assessment. J Thorac Oncol. 2010;5(9):1315–1316. doi: 10.1097/JTO.0b013e3181ec173d.
- Carrero JJ, Stenvinkel P, Cuppari L, et al. Etiology of the protein-energy wasting syndrome in chronic kidney disease: a consensus statement from the international society of renal nutrition and metabolism (ISRNM). J Ren Nutr. 2013;23(2):77–90. doi: 10.1053/j.jrn.2013.01.001.
- Carrero JJ, Thomas F, Nagy K, et al. Global prevalence of protein-energy wasting in kidney disease: a meta-analysis of contemporary observational studies from the international society of renal nutrition and metabolism. J Ren Nutr. 2018;28(6):380–392. doi: 10.1053/j.jrn.2018.08.006.
- Delmonico MJ, Harris TB, Visser M, et al. Longitudinal study of muscle strength, quality, and adipose tissue infiltration. Am J Clin Nutr. 2009;90(6):1579–1585. doi: 10.3945/ajcn.2009.28047.
- Silva LF, Matos CM, Lopes GB, et al. Handgrip strength as a simple indicator of possible malnutrition and inflammation in men and women on maintenance hemodialysis. J Ren Nutr. 2011;21(3):235–245. doi: 10.1053/j.jrn.2010.07.004.
- Cereda E, Turri A, Klersy C, et al. Whey protein isolate supplementation improves body composition, muscle strength, and treatment tolerance in malnourished advanced cancer patients undergoing chemotherapy. Cancer Med. 2019;8(16):6923–6932. doi: 10.1002/cam4.2517.
- Reid KF, Naumova EN, Carabello RJ, et al. Lower extremity muscle mass predicts functional performance in mobility-limited elders. J Nutr Health Aging. 2008;12(7):493–498. doi: 10.1007/BF02982711.
- Matsuzawa R, Matsunaga A, Wang G, et al. Relationship between lower extremity muscle strength and all-cause mortality in Japanese patients undergoing dialysis. Phys Ther. 2014;94(7):947–956. doi: 10.2522/ptj.20130270.
- Zhang Y, Liu Y, Bi X, et al. Therapeutic approaches in mitochondrial dysfunction, inflammation, and autophagy in uremic cachexia: role of aerobic exercise. Mediators Inflamm. 2019;2019:2789014. doi: 10.1155/2019/2789014.
- Xiao J, Caan BJ, Cespedes Feliciano EM, et al. The association of medical and demographic characteristics with sarcopenia and low muscle radiodensity in patients with nonmetastatic colorectal cancer. Am J Clin Nutr. 2019;109(3):615–625. doi: 10.1093/ajcn/nqy328.
- Giglio J, Kamimura MA, Lamarca F, et al. Association of sarcopenia with nutritional parameters, quality of life, hospitalization, and mortality rates of elderly patients on hemodialysis. J Ren Nutr. 2018;28(3):197–207. doi: 10.1053/j.jrn.2017.12.003.
- Carrero JJ, Qureshi AR, Nakashima A, et al. Prevalence and clinical implications of testosterone deficiency in men with end-stage renal disease. Nephrol Dial Transplant. 2011;26(1):184–190. doi: 10.1093/ndt/gfq397.
- Beberashvili I, Sinuani I, Azar A, et al. Nutritional and inflammatory status of hemodialysis patients in relation to their body mass index. J Ren Nutr. 2009;19(3):238–247. doi: 10.1053/j.jrn.2008.11.007.
- Ertilav M, Levin WN, Celtik A, et al. Impact of body mass index on short-term and long-term survival in prevalent hemodialysis patients. Hemodial Int. 2019;23(3):375–383. doi: 10.1111/hdi.12746.
- Bataille S, Serveaux M, Carreno E, et al. The diagnosis of sarcopenia is mainly driven by muscle mass in hemodialysis patients. Clin Nutr. 2017;36(6):1654–1660. doi: 10.1016/j.clnu.2016.10.016.
- Ibrahim K, May C, Patel HP, et al. A feasibility study of implementing grip strength measurement into routine hospital practice (GRImP): study protocol. Pilot Feasibility Stud. 2016;2:27. doi: 10.1186/s40814-016-0067-x.
- Beaudart C, McCloskey E, Bruyère O, et al. Sarcopenia in daily practice: assessment and management. BMC Geriatr. 2016;16(1):170. doi: 10.1186/s12877-016-0349-4.
- Kaysen GA, Zhu F, Sarkar S, et al. Estimation of total-body and limb muscle mass in hemodialysis patients by using multifrequency bioimpedance spectroscopy. Am J Clin Nutr. 2005;82(5):988–995. doi: 10.1093/ajcn/82.5.988.
- Lin TY, Wu MY, Chen HS, et al. Development and validation of a multifrequency bioimpedance spectroscopy equation to predict appendicular skeletal muscle mass in hemodialysis patients. Clin Nutr. 2021;40(5):3288–3295. doi: 10.1016/j.clnu.2020.10.056.
- Kittiskulnam P, Chertow GM, Carrero JJ, et al. Sarcopenia and its individual criteria are associated, in part, with mortality among patients on hemodialysis. Kidney Int. 2017;92(1):238–247. doi: 10.1016/j.kint.2017.01.024.
- Yoowannakul S, Tangvoraphonkchai K, Davenport A. The prevalence of muscle wasting (sarcopenia) in peritoneal dialysis patients varies with ethnicity due to differences in muscle mass measured by bioimpedance. Eur J Clin Nutr. 2018;72(3):381–387. doi: 10.1038/s41430-017-0033-6.
- Greenhall GH, Davenport A. Screening for muscle loss in patients established on peritoneal dialysis using bioimpedance. Eur J Clin Nutr. 2017;71(1):70–75. doi: 10.1038/ejcn.2016.202.
- Kang SH, Do JY. Effects of volume status on body composition in incident peritoneal dialysis patients. Eur J Clin Nutr. 2020;74(4):633–641. doi: 10.1038/s41430-020-0574-y.