
Abstract
Introduction
The tissue stiffness of donor kidneys in transplantation may increase due to pathological changes such as glomerulosclerosis and interstitial fibrosis, and those changes associate worse outcomes in kidney transplantation recipients. Ultrasound elastography is a noninvasive imaging examination with the ability to quantitatively reflect tissue stiffness. Aim of this study was to evaluate the prognostic value of ultrasound elastography for adverse kidney outcome in kidney transplantation recipients.
Methods
Shear wave elastography (SWE) examinations were performed by two independent operators in kidney transplantation recipients. The primary outcome was a composite of kidney graft deterioration, all-cause re-hospitalization, and all-cause mortality. Survival analysis was calculated by Kaplan-Meier curves with the log-rank test and Cox regression analysis.
Results
A total of 161 patients (mean age 46 years, 63.4% men) were followed for a median of 20.1 months. 27 patients (16.77%) reached the primary endpoint. The mean and median tissue stiffness at the medulla (hazard ratio: 1.265 and 1.229, respectively), estimated glomerular filtration rate (eGFR), and serum albumin level were associated with the primary outcome in univariate Cox regression. Adding mean or median medulla SWE to a baseline model containing eGFR and albumin significantly improved its discrimination (C-statistics: 0.736 for the baseline, 0.766 and 0.772 for the model added mean and median medulla SWE, respectively).
Conclusion
The medullary tissue stiffness of kidney allograft measured by shear wave elastography may provide incremental prognostic value to adverse outcomes in kidney transplantation recipients. Including SWE parameters in kidney transplantation recipients management could be considered to improve risk stratification.
Introduction
Allogenic kidney transplantation is one of the effective treatments for kidney failure, and previous studies have shown that patients receiving a kidney transplant have lower mortality and better quality of life than those on other kidney replacement therapies [Citation1,Citation2]. Despite the improvement in surgical techniques and immunosuppressive drugs, kidney transplantation recipients still face a variety of adverse outcomes including rejection, infections, malignancies and failure of the transplanted kidney [Citation3]. Prognostic determinants of patients after kidney transplantation are complex, including adjustment of immunosuppressive regimen, donor type and characteristics, intraoperative cold ischemia time, primary kidney diseases and comorbidities of the recipients [Citation4–8]. Histologic changes such as interstitial fibrosis/atrophy and infiltration of inflammatory cells, have been shown to correlate with allograft dysfunction [Citation9,Citation10]. Kidney biopsy is the gold standard to evaluate histological changes, but as an invasive procedure it has complications such as hemorrhage, arteriovenous fistula and infections [Citation11]. Therefore, an early accurate non invasive identification of kidney allograft fibrosis might be beneficial in improving the prognosis of recipients [Citation12]. And we aim to validate the prognostic ability of such non invasive assessment methods.
Conventional ultrasound has benefits like its low cost, short operating time, portability and versatility, while ultrasound elastography (USE) also has the advantage of being able to quantitatively reflect tissue stiffness. The USE assesses elasticity by applying a normal or dynamic stress to the tissue, then measures the deformation velocity after removal of the force [Citation13]. Two-dimensional (2D) shear wave elastography (SWE) is the currently newest USE method that uses an acoustic radiation force. A previous study has revealed that SWE is able to diagnose interstitial fibrosis in Immunoglobulin A Nephropathy with high specificity and sensitivity [Citation14]. Interestingly, studies on the correlation between the value of SWE and the extent of tissue stiffness in patients with chronic kidney disease (CKD) had controversial conclusions. Some demonstrated a positive correlation between SWE value and the extent of kidney fibrosis [Citation15–17], while others revealed an opposite trend [Citation18–20]. This contradiction may be caused by the diverse pathological features of CKD itself, or it may be related to the fact that the native kidney is located in the retroperitoneum. On the contrary, the superficial location of kidney allograft made it more suitable to be assessed by SWE [Citation13]. A single-center study of 83 patients found that the kidney allograft cortex stiffness was significantly higher in cases with dysfunction as compared to those with stable function [Citation21]. A radiological-pathological correlation analysis had the similar findings, and also demonstrated that cortical SWE values had superior test performance to serum creatinine in detecting early tubulointerstitial fibrosis [Citation22]. These above results suggested that SWE could be a novel noninvasive method for kidney fibrosis assessment in kidney allograft.
The purpose of this current study was to evaluate the cortical and medullary stiffness of the kidney allograft by SWE, and use it as an incremental predictor for adverse outcomes in kidney transplantation recipients.
Materials and methods
Study Population
Consecutive kidney transplantation recipients with SWE examination were prospectively enrolled from September 2020 to June 2021 in Renji Hospital Affiliated to Shanghai Jiao Tong University School of Medicine. The study was in compliance with the Declaration of Helsinki and was also reviewed, approved, and monitored by the Hospital Ethics Committee (RJ2018049). All recruited participants signed informed written consent. Patients were followed for outcomes from the SWE examination. The inclusion criteria were as follows: 1) at least 1 week post kidney transplantation; 2) no established acute rejection (defined as decreased kidney function with definitive diagnostic features on kidney allograft biopsy) or chronic allograft nephropathy (CAN, a histopathological diagnosis characterized by chronic interstitial fibrosis and tubular atrophy in allografted kidneys) [Citation23,Citation24]; 3) no history of hospitalization due to acute kidney injury (AKI) or severe infection; 4) cadaveric donor. The exclusion criteria were as follows: 1) incomplete clinical data; 2) no corticomedullar differentiation in B-mode; 3) poorly-filled elastography image with the color filling area less than half of the sampling frame. At the time of enrollment, demographic characteristics, immunosuppressive regimen, conventional ultrasound variables, and laboratory parameters were obtained for all participants from the Hospital Information System (HIS).
Ultrasound examinations
All enrolled patients were examined by two independent radiologists who were blinded to the patients’ medical history, surgery information, clinical parameters and their counterpart’s results. Gray-scale and color Doppler ultrasound, as well as SWE were performed using a Myriad Resona 8S color Doppler diagnostic ultrasound instrument with the SC5-1 convex array and L11-3 linear array probes. The time gain compensation control slides were placed in the middle position, and the focus point was set posterior to the transplanted kidney. First, observe the echogenicity of the transplanted kidney parenchyma and the cortical-medullary boundary with a convex array probe, simultaneously measuring the size of the grafted kidney, and the renal aorta at the hilum of the transplanted kidney. Then, the line array probe was used to determine cortical thickness under high frequency ultrasound, and the intracortical interlobular artery spectrum was measured. Then the shear wave elastography mode was activated to measure the cortical and medullary elastic modulus in the middle of the kidney. The maximum long-axis section of the kidney allograft was taken with the probe as perpendicular to the renal capsule as possible. Next, the sampling frame was set under the medial capsule of the transplanted kidney. The probe was kept stationary for 3–5 s and the image was stored after the elastic image was stabilized.
Follow-up and outcomes
Patient follow-up was performed by retrieval of information from HIS and telephone interview. The primary outcome was a composite of kidney graft deterioration (defined as eGFR, calculated by the Modification of Diet in Renal Disease equation, decreased by 25% after the SWE examination), all-cause re-hospitalization (such as AKI, severe infection, new onset of proteinuria or malignancy), and all-cause mortality. Follow-up time was calculated from the date of baseline SWE examination and censored at the first event or last patient contact.
Statistical analysis
All continuous variables were tested for normality using Shapiro-Wilk test and Q-Q plots. Variables emerging on normal distribution were summarized as mean ± standard deviation (sd) and were compared between groups by Student’s t tests. Continuous data emerging on non-normal distribution were presented as median [interquartile range], and testing for group differences was performed by Wilcoxon sum-rank test. Categorical variables were summarized as frequencies and percentages, and they were compared using chi-square tests. Inter- and intra-observer reproducibility was assessed using the Bland-Altman method. Proportional hazards assumption was evaluated by Schoenfeld residuals test, and linearity was visually assessed by using Martingale residual plots before the Cox regression analysis. Univariate hazard ratios (HRs) and 95% confidence intervals (CIs) were calculated using Cox proportional hazards regression. Kaplan-Meier survival curves were estimated with mean and median SWE medullary stiffness values as dichotomous parameters, based on the cutoff value of the receiver operating characteristic (ROC) curves, and differences in survival distributions were assessed by using the log-rank test. Multivariate Cox regression models were generated by the conventional clinical parameters and SWE values. To assess whether SWE values improved risk prediction of the conventional parameters, we calculated C-statistics of all predictive models, and then compared each other using DeLong test. All statistical analyses were performed with R studio (version 1.2.5033, Posit Software, PBC). P-value less than 0.05 were considered statistically significant.
Results
Study Population
A total of 161 kidney transplantation recipients were included in the study, and the flow diagram was displayed in . During the follow-up time, 27 kidney transplantation recipients reached the primary outcome. The mean age of the enrolled patients was 46.29 ± 12.03 years, and 63.4% of them were male. Baseline allograft function and other biochemical parameters were tested within three days before the SWE examination. The mean serum creatinine of all participants was 108.66 ± 38.30 μmol/L, and the mean eGFR was 69.59 ± 25.77 mL/min/1.73m2, indicating mildly impaired overall kidney allograft function in the study cohort. More than half (66.9%) of the participants had no proteinuria at baseline and 125 (77.6%) were prescribed tacrolimus-based immunosuppression regimen, while 12.4% and 3.7% of the enrolled patients took cyclosporin A and rapamycin, respectively ().
Figure 1. Enrollment and exclusion of the study cohort. Among the 174 subjects underwent assessment, 163 of them received CMR examination. Two subjects were excluded because of incomplete data. 161 subjects were finally analyzed with 27 patients reached the primary outcome during the follow-up time.
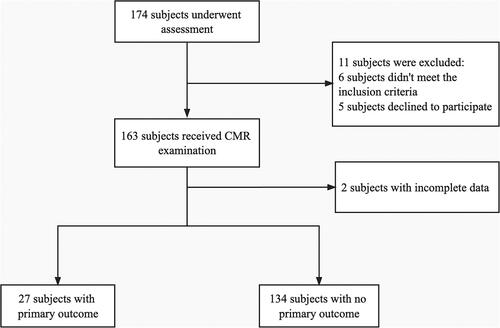
Table 1. Baseline characteristics of enrolled patients.
Shear wave elastography characteristics
Conventional ultrasound and SWE parameters were all described in . All 161 enrolled participants were analyzed for interobserver intraclass correlation coefficient (ICC) and 30 participants for intraobserver ICC. Both interobserver and intraobserver ICCs were >0.75, indicating good reproducibility. Patients who experienced the primary outcome had significantly higher cortical artery resistance index (RI) (0.69 ± 0.06 vs. 0.66 ± 0.07, p = 0.030), and more severe medullary stiffness (mean medullary SWE value: 10.46 ± 1.54 vs. 9.55 ± 2.02, p = 0.022; median medullary SWE value: 10.52 ± 1.81 vs. 9.53 ± 2.18, p = 0.022) compared to those without the outcome. The exemplary SWE images of patients who experienced the primary outcome or not were shown in .
Figure 2. Exemplary SWE images of kidney transplantation recipients who experienced the primary outcome or not. (a) B-mode image and color-coded shear wave elastography (SWE) map in a 47-year-old female who had the kidney transplantation 3 years before the SWE examination, and did not experience the primary outcome during the follow-up time. Regions of interest (ROI) were placed in the anterior aspect of the cortex (1+) and medulla (2+) as shown with the white circle. (b) B-mode image and color-coded shear wave elastography (SWE) map in a 39-year-old male who had the kidney transplantation 2 years before the SWE examination, and experienced the primary outcome (kidney graft deterioration) during the follow-up time. Regions of interest (ROI) were placed in the anterior aspect of the cortex (1+) and medulla (2+) as shown with the white circle.
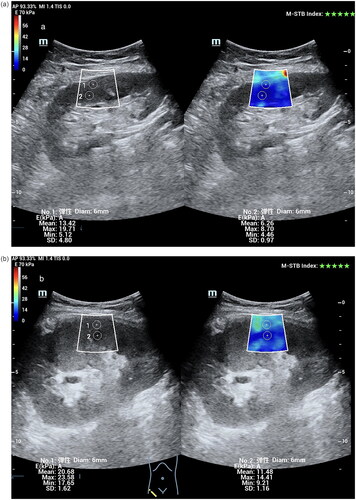
Table 2. Elastography parameters of patients who reached the Endpoint and not.
Association of SWE values with adverse outcome
A total of 27 patients reached the primary outcome (1 death of brain hemorrhage, 18 with kidney graft deterioration, and 8 with all-cause re-hospitalization). The eGFR, blood urea nitrogen, serum albumin level, mean and median SWE medullary values were univariably associated with the primary outcome (all p < 0.05) (). ROC curves of SWE cortical and medullary values, cortical artery and renal artery RI revealed that the median medullary stiffness had the highest predictive accuracy of the primary outcome (). Kaplan-Meier survival curves demonstrated that the incidence of primary outcome was higher in patients with high (≥ 9.68 kPa) median SWE medullary value compared to those with low (< 9.68 kPa) median SWE medullary value ().
Figure 3. ROC Curves for associations between SWE and conventional ultrasound parameters and adverse outcome in kidney transplantation recipients. The mean medulla SWE cutoff was 9.63 kPa in this population (area under curve [AUC]: 0.66). the median medulla SWE cutoff was 9.68 kPa (AUC: 0.67). SWE: shear wave elastography.
![Figure 3. ROC Curves for associations between SWE and conventional ultrasound parameters and adverse outcome in kidney transplantation recipients. The mean medulla SWE cutoff was 9.63 kPa in this population (area under curve [AUC]: 0.66). the median medulla SWE cutoff was 9.68 kPa (AUC: 0.67). SWE: shear wave elastography.](/cms/asset/32d530a2-4f86-4033-84b3-7787a8ec6233/irnf_a_2235015_f0003_c.jpg)
Figure 4. Kaplan-Meier Curves for SWE medulla stiffness and adverse outcome in kidney transplantation recipients. Survival probability and the number of risk for kidney transplantation recipients with mean (a) and median (b) medullary stiffness above and below cutoff values during the follow-up time are shown in green and red, respectively. Log-rank test was performed to compare the two groups of patients (p < 0.001). SWE: shear wave elastography.
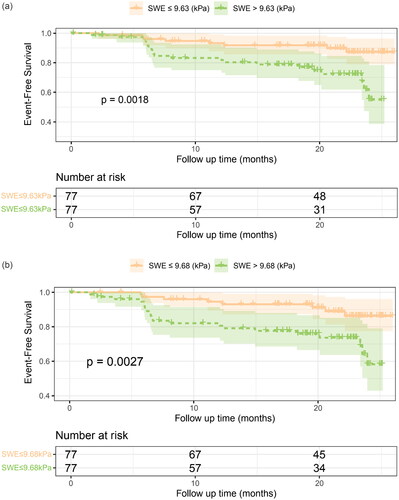
Table 3. Results of univariable Cox Analyses for the prediction of the incident of adverse events.
To compare the predictive ability between kidney allograft medullary stiffness and conventional risk predictors such as eGFR and serum albumin level, three risk models (Model 1, 2, and 3) were constructed using different combinations between the above indicators. C-statistics of Model 1 (containing eGFR and albumin level), 2 (containing eGFR, albumin level and mean medullary stiffness), and 3 (containing eGFR, albumin level and median medullary stiffness) were 0.736, 0.766, and 0.772, respectively. Model 3 showed a better predictive ability for the primary outcome compared to Model 1 and 2 by DeLong tests (). Time-dependent AUC curves were illustrated to show the prognostic value of these three risk models at different time points (). These curves suggested that risk predictive models containing SWE medullary values had promising prognostic values to adverse outcomes in kidney transplantation recipients after 1-year follow-up time.
Figure 5. Time-dependent AUC curves demonstrating the stability of AUC values of predictive models during the follow-up time. The solid green lines show that AUC values of different predictive models varying during the follow-up time, and the two dotted lines represent the 95% confidence intervals.
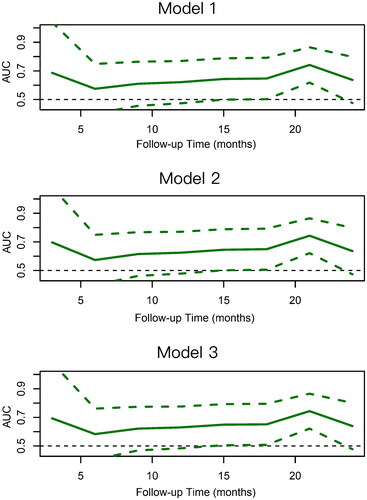
Table 4. Multivariable Analyses for the prediction of the Endpoint in patients after kidney transplantation.
Discussion and conclusion
The current study evaluated the prognostic value of kidney allograft stiffness measured by shear wave elastography. We found that the medullary stiffness was severer in kidney transplantation recipients with adverse outcomes than in those with a relatively good outcome. Among all parameters derived from conventional ultrasound and SWE, the median medullary SWE value had the best discrimination ability. And both mean and median medullary stiffness were univariately associated with the primary outcome. Adding SWE parameters to a baseline model consisting of eGFR and serum albumin level significantly improved the predictive performance.
Kidney transplantation has become a promising choice for patients with kidney failure to prolong life and improve the quality of life. Both short- and long-term survival of kidney transplantation recipients have improved substantially during the last few decades, resulting from advances in immunosuppression, more precise cytotoxic antibody detection and better human lymphocyte match [Citation25–27]. However, evolving challenges such as chronic allograft dysfunction, infection, and cardiovascular diseases are still a concern [Citation28]. Beyond one year after the transplantation, chronic allograft nephropathy was characterized by microvascular and glomerular injury [Citation29]. The use of calcineurin inhibitors (tacrolimus and cyclosporin a) could lead to luminal narrowing, glomerulosclerosis, and tubulointerstitial damage [Citation29]. All the above histological alterations cause increase stiffness of kidney parenchyma.
The gold standard for assessing histological changes in the kidney allograft is the transplant kidney biopsy, an invasive procedure that may have severe complications. Therefore, a noninvasive method to evaluate kidney allograft stiffness is highly desirable. Conventional ultrasound has become one of the most common tools for postoperative assessment and follow-up of kidney transplant recipients. The medulla can become enlarged, cortical echogenicity more sparsely distributed and present corticomedullary differentiation loss in the US images during allograft rejection. Some of thosae changes can even appear before significant elevation of serum creatinine [Citation30,Citation31]. Thus, we assumed that some emerging imaging techniques may have additional advantages in the assessment of tissue characteristics and in the prediction of prognosis of kidney transplant recipients.
Ultrasound elastography is an imaging technique determined by tissue stiffness. The mapped stiffness can be estimated by analyzing the strain of the tissue under stress or by imaging the shear and mechanical waves, whose propagation is determined by the stiffness of the tissue rather than its bulk modulus [Citation32]. In shear wave elastography, a dynamic stress is applied to tissue. Shear waves created by the excitation are measured perpendicular to the acoustic radiation force application [Citation13]. Two-dimensional (2D) SWE has the advantages of real-time visualization of a color quantitative elastogram superimposed on a B-mode image, allowing the operators to be guided by both anatomical and tissue stiffness information [Citation33,Citation34]. Studies using SWE to evaluate CKD showed contradictory trends probably due to different inclusion criteria, study design and operating protocols. Elevated SWE values in CKD patients may be due to increased overall kidney parenchyma stiffness [Citation19], while reduced SWE stiffness in patients with CKD could be explained by the decrease in blood perfusion [Citation35–37].
The accuracy of SWE measurement could be limited by the retroperitoneal location of the native kidneys. The superficial location of kidney allograft make it more suitable for elastography examination. A case-control study enrolling 95 kidney transplantation recipients found that point SWE was feasible in distinguishing patients with and without subclinical rejection [Citation38]. Several studies have demonstrated that the SWE values had statistically significant association with allograft fibrosis proven by biopsy [Citation22,Citation39]. However, there has been no study investigating the prognostic value of SWE in kidney transplantation recipients.
In this current study, we aimed to evaluate the association between the tissue stiffness of kidney allograft and the adverse outcomes including kidney graft deterioration, onset of AKI, severe infection, all-cause re-hospitalization and all-cause mortality. Interestingly, we found that stiffness of kidney allografts medulla measured by SWE was an independent risk predictor for the incidence of adverse events, but not the cortical stiffness, which is probably because the medullary blood supply is richer and more susceptible to hemodynamic changes in transplant allografts. Given that the follow-up period of the current study was relatively short, and most patients have not yet developed significant glomerulosclerosis, it might explain the lack of statistical difference in SWE cortical stiffness. In contrast, many factors may cause tubulointerstitial injury in the early post-transplant period, such as calcineurin inhibitor (CNI) nephrotoxicity, viral infections such as BK virus (BKV) and cytomegalovirus, and acute rejection, etc., The tubulointerstital injury then lead to a decrease in kidney function, and this may be an important reason for the statistical difference in SWE medullary stiffness in our study. ROC curves illustrated that medullary stiffness had better discriminatory ability for adverse events compared to other ultrasound parameters, including resistance index of renal artery and cortical (interlobular) artery, indicating that SWE could be a promising tool for the assessment of adverse outcome in kidney transplantation recipients. Baseline models were constructed by eGFR and serum albumin level, which were proved to be significantly associated with adverse outcomes in this study cohort. Adding medullary SWE values to the baseline model led to higher C-statistics. However, there was still more room for improvement of the SWE predicting models, as the area under curve was below 0.8. Therefore, future studies were needed in larger study population, and more accurate risk predictors could be found for kidney transplantation recipients.
The current study has several limitations. First, this was a single-center study, and multi-center studies in the future would substantiate our conclusion. Second, the follow-up duration was short and the sample size was small, resulted in fewer end-point events. Therefore, the conclusion needs to be verified in a large real-world cohort with sufficient control for potential confounding factors. Third, SWE is a novel method reflecting the tissue stiffness; hence, there is no accepted reference range for normal values in kidney allografts, and the absolute magnitude of each parameter varies depending on the SWE operator, the ROI plotter, and the image analysis protocol. Therefore, a wider application of this examination in clinical practice is rather challenging.
In conclusion, SWE is a novel ultrasound technique reflecting tissue stiffness. Herein, we demonstrated that medullary kidney allograft stiffness is an independent predictor of adverse outcome in kidney transplantation recipients. Moreover, the prognostic value of medullary stiffness was better than conventional ultrasound risk factors, including RI of cortical artery and renal artery, and cortical thickness.
Ethical approval
This study protocol was reviewed and approved by the ethnic committee of Renji Hospital, Shanghai Jiao Tong University, School of Medicine. Written informed consent was obtained from all participants.
Author contributions
Tian-yi Zhang: Methodology, Formal Analysis, Investigation, Writing - Original Draft Jiayi Yan: Data Curation, Funding Acquisition, Software, Visualization Jiajia Wu: Resources, Methodology, Validation Wenqi Yang: Software, Funding acquisition, Data Curation Shijun Zhang: Software, Visualization, Data Curation Jia Xia: Resources Xiajing Che: Resources Hongli Li: Supervision Dawei Li: Resources Liang Ying: Resources Xiaodong Yuan: Resources Yin Zhou: Supervision, Conceptualization Ming Zhang: Supervision, Conceptualization Shan Mou: Funding acquisition, Supervision, Conceptualization
| Abbreviations | ||
| SWE | = | shear wave elastography |
| CKD | = | chronic kidney disease |
| AKI | = | acute kidney injury |
| ROC | = | receiver operating characteristic |
| HR | = | hazard ratio |
Acknowledgement
Thanks to the innovative research team of high-level local universities in Shanghai for supporting the research.
Disclosure statement
No potential conflict of interest was reported by the author(s).
Data availability statement
Any inquiries toward the datasets generated and/or analyzed during the current study can be directed to the corresponding authors.
Additional information
Funding
References
- Schnuelle P, Lorenz D, Trede M, et al. Impact of renal cadaveric transplantation on survival in end-stage renal failure: evidence for reduced mortality risk compared with hemodialysis during long-term follow-up. J Am Soc Nephrol. 1998;9(11):1–10. doi: 10.1681/ASN.V9112135.
- Tonelli M, Wiebe N, Knoll G, et al. Systematic review: kidney transplantation compared with dialysis in clinically relevant outcomes: systematic review of kidney transplantation. Am J Transplant. 2011;11(10):2093–2109. doi: 10.1111/j.1600-6143.2011.03686.x.
- Voora S, Adey DB. Management of kidney transplant recipients by general nephrologists: core curriculum 2019. Am J Kidney Dis. 2019;73(6):866–879. doi: 10.1053/j.ajkd.2019.01.031.
- Tiong HY, Goldfarb DA, Kattan MW, et al. Nomograms for predicting graft function and survival in living donor kidney transplantation based on the UNOS registry. J Urol. 2009;181(3):1248–1255. doi: 10.1016/j.juro.2008.10.164.
- Øien CM, Reisaeter AV, Leivestad T, et al. Living donor kidney transplantation: the effects of donor age and gender on short- and Long-Term outcomes. Transplantation. 2007;83(5):600–606. doi: 10.1097/01.tp.0000255583.34329.dd.
- Krishnan AR, Wong G, Chapman JR, et al. Prolonged ischemic time, delayed graft function, and graft and patient outcomes in live donor kidney transplant recipients. Am J Transplant. 2016;16(9):2714–2723. doi: 10.1111/ajt.13817.
- Artero M, Biava C, Amend W, et al. Recurrent focal glomerulosclerosis: natural history and response to therapy. Am J Med. 1992;92(4):375–383. doi: 10.1016/0002-9343(92)90267-f.
- Jeon JY, Kim SJ, Ha KH, et al. Trends in the effects of pre‐transplant diabetes on mortality and cardiovascular events after kidney transplantation. J Diabetes Investig. 2021;12(5):811–818. doi: 10.1111/jdi.13397.
- Park WD, Griffin MD, Cornell LD, et al. Fibrosis with inflammation at one year predicts transplant functional decline. J Am Soc Nephrol. 2010;21(11):1987–1997. doi: 10.1681/ASN.2010010049.
- Cosio FG, Grande JP, Wadei H, et al. Predicting subsequent decline in kidney allograft function from early surveillance biopsies. Am J Transplant. 2005;5(10):2464–2472. doi: 10.1111/j.1600-6143.2005.01050.x.
- Whittier WL, Korbet SM. Timing of complications in percutaneous renal biopsy. J Am Soc Nephrol. 2004;15(1):142e7–14147. doi: 10.1097/01.asn.0000102472.37947.14.
- El-Zoghby ZM, Stegall MD, Lager DJ, et al. Identifying specific causes of kidney allograft loss. Am J Transplant. 2009;9(3):527–535. doi: 10.1111/j.1600-6143.2008.02519.x.
- Sigrist RMS, Liau J, Kaffas AE, et al. Ultrasound elastography: review of techniques and clinical applications. Theranostics. 2017;7(5):1303–1329. doi: 10.7150/thno.18650.
- Turgutalp K, Balcı Y, Özer C, et al. Shear wave elastography findings in immunoglobulin a nephropathy patients: is it more specific and sensitive for interstitial fibrosis or interstitial fibrosis/tubular atrophy? Ren Fail. 2020;42(1):590–599. doi: 10.1080/0886022X.2020.1779087.
- Hassan K, Loberant N, Abbas N, et al. Shear wave elastography imaging for assessing the chronic pathologic changes in advanced diabetic kidney disease. Ther Clin Risk Manag. 2016;12:1615–1622. doi: 10.2147/TCRM.S118465.
- Peng L, Zhong T, Fan Q, et al. Correlation analysis of renal ultrasound elastography and clinical and pathological changes in patients with chronic kidney disease. Clin Nephrol. 2017;87(6):293–300. doi: 10.5414/CN108866.
- Gungor O, Guzel FB, Sarica MA, et al. Ultrasound elastography evaluations in patient populations with various kidney diseases. Ultrasound Q. 2019;35(2):169–172. doi: 10.1097/RUQ.0000000000000404.
- Bob F, Grosu I, Sporea I, et al. Ultrasound-based shear wave elastography in the assessment of patients with diabetic kidney disease. Ultrasound Med Biol. 2017;43(10):2159–2166. doi: 10.1016/j.ultrasmedbio.2017.04.019.
- Bob F, Bota S, Sporea I, et al. Relationship between the estimated glomerular filtration rate and kidney shear wave speed values assessed by acoustic radiation force impulse elastography: a pilot study. J Ultrasound Med. 2015;34(4):649–654. doi: 10.7863/ultra.34.4.649.
- Grosu I, Bob F, Sporea I, et al. Correlation of point shear wave velocity and kidney function in chronic kidney disease. J Ultrasound Med. 2018;37(11):2613–2620. doi: 10.1002/jum.14621.
- Bolboacă SD, Elec FI, Elec AD, et al. Shear-Wave elastography variability analysis and relation with kidney allograft dysfunction: a Single-Center study. Diagnostics. 2020;10(1):41. doi: 10.3390/diagnostics10010041.
- Ma MK, Law HK, Tse KS, et al. Non-invasive assessment of kidney allograft fibrosis with shear wave elastography: a radiological-pathological correlation analysis. Int J Urol. 2018;25(5):450–455. doi: 10.1111/iju.13536.
- Kais H. Chronic allograft nephropathy [internet]. In: Ortiz J, Andre J, editors. After the kidney Transplant - The patients and their allograft. London (UK): InTech; 2011.
- Landais P, Jais JP, Margreiter R, et al. Survival modelling in kidney transplantation: hazard rates of graft loss. Nephrol Dial Transplant. 1995;10(Supp1):90–94. doi: 10.1093/ndt/10.supp1.90.
- Hariharan S, Johnson CP, Bresnahan BA, et al. Improved graft survival after renal transplantation in the United States, 1988 to 1996. N Engl J Med. 2000;342(9):605–612. doi: 10.1056/NEJM200003023420901.
- Diethelm AG, Deierhoi MH, Hudson SL, et al. Progress in renal transplantation a single center study of 3359 patients over 25 years. Ann Surg. 1995;221(5):446–458. doi: 10.1097/00000658-199505000-00002.
- Zhang R, Kumar P, Reisin E, et al. Kidney transplantation: the evolving challenges. Am J Med Sci. 2004;328(3):156–161. doi: 10.1097/00000441-200409000-00004.
- Nankivell BJ, Borrows RJ, Fung CLS, et al. The natural history of chronic allograft nephropathy. N Engl J Med. 2003;349(24):2326–2333. doi: 10.1056/NEJMoa020009.
- Hricak H, Toledo-Pereyra LH, Eyler WR, et al. The role of ultrasound in the diagnosis of kidney allograft rejection. Radiology. 1979;132(3):667–672. doi: 10.1148/132.3.667.
- Hillman BJ, Birnholz JC, Busch GJ. Correlation of echographic and histologic findings in suspected renal allograft rejection. Radiology. 1979;132(3):673–676. doi: 10.1148/132.3.673.
- Gennisson JL, Deffieux T, Fink M, et al. Ultrasound elastography: principles and techniques. Diagn Interv Imaging. 2013;94(5):487–495. doi: 10.1016/j.diii.2013.01.022.
- Cosgrove D, Piscaglia F, Bamber J, et al. EFSUMB guidelines and recommendations on the clinical use of ultrasound elastography. Part 2: clinical applications. Ultraschall Der Medizin. 2013;34:238–253.
- Ferraioli G, Tinelli C, Dal Bello B, et al. Accuracy of real-time shear wave elastography for assessing liver fibrosis in chronic hepatitis C: a pilot study. Hepatology. 2012;56(6):2125–2133. doi: 10.1002/hep.25936.
- Samir AE, Allegretti AS, Zhu Q, et al. Shear wave elastography in chronic kidney disease: a pilot experience in native kidneys. BMC Nephrol. 2015;16(1):119. doi: 10.1186/s12882-015-0120-7.
- Hu Q, Wang XY, He HG, et al. Acoustic radiation force impulse imaging for Non-Invasive assessment of renal histopathology in chronic kidney disease. PLoS One. 2014;9(12):e115051. doi: 10.1371/journal.pone.0115051.
- Zhu M, Ma L, Yang W, et al. Elastography ultrasound with machine learning improves the diagnostic performance of traditional ultrasound in predicting kidney fibrosis. J Formos Med Assoc. 2022;121(6):1062–1072. doi: 10.1016/j.jfma.2021.08.011.
- Kim BJ, Kim CK, Park JJ. Non-invasive evaluation of stable renal allograft function using point shear-wave elastography. Br J Radiol. 2018;91(1081):20170372. doi: 10.1259/bjr.20170372.
- Early HM, Cheang EC, Aguilera JM, et al. Utility of shear wave elastography for assessing allograft fibrosis in renal transplant recipients: a pilot study: shear wave elastography of fibrosis in renal transplants. J Ultrasound Med. 2018;37(6):1455–1465. doi: 10.1002/jum.14487.
- Chiocchini ALC, Sportoletti C, Comai G, et al. Correlation between renal cortical stiffness and histological determinants by point Shear-Wave elastography in patients with kidney transplantation. Prog Transplant. 2017;27(4):346–353. doi: 10.1177/1526924817731882.