
Abstract
Background
Kidney fibrosis is the common final pathway of virtually all advanced forms of chronic kidney disease (CKD) including diabetic nephropathy (DN), IgA nephropathy (IgAN) and membranous nephropathy (MN), with complex mechanism. Comparative gene expression analysis among these types of CKD may shed light on its pathogenesis. Therefore, we conducted this study aiming at exploring the common and specific fibrosis-related genes involved in different types of CKD.
Methods
Kidney biopsy specimens from patients with different types of CKD and normal control subjects were analyzed using the NanoString nCounter® Human Fibrosis V2 Panel. Genes differentially expressed in all fibrotic DN, IgAN and MN tissues compared to the normal controls were regarded as the common fibrosis-related genes in CKD, whereas genes exclusively differentially expressed in fibrotic DN, IgAN or MN samples were considered to be the specific genes related to fibrosis in DN, IgAN and MN respectively. Quantitative real-time PCR (qRT-PCR) was performed to validate the expression of the selected genes.
Results
Protein tyrosine phosphatase receptor type C (PTPRC), intercellular cell adhesion molecule-1 (ICAM1), vascular cell adhesion molecule-1 (VCAM1), interleukin 10 receptor alpha (IL10RA) and CC chemokine receptor 2 (CCR2) were identified as the potential common genes for kidney fibrosis in different types of CKD, while peroxisome proliferator-activated receptor alpha (PPARA), lactate oxidase (LOX), secreted phosphoprotein 1 (SPP1) were identified as the specific fibrosis-associated genes for DN, IgAN and MN respectively. qRT-PCR demonstrated that the expression levels of these selected genes were consistent with the NanoString analysis.
Conclusions
There were both commonalities and differences in the mechanisms of fibrosis in different types of CKD, the commonalities might be used as the common therapeutic targets for kidney fibrosis in CKD, while the differences might be used as the diagnostic markers for DN, IgAN and MN respectively. Inflammation was highly relevant to the pathogenesis of fibrosis. This study provides further insight into the pathophysiology and treatment of fibrotic kidney disease.
Introduction
Chronic kidney disease (CKD) is prevalent in approximately 8%–16% of the global population and is increasingly considered a silent epidemic [Citation1]. Diabetic nephropathy (DN), IgA nephropathy (IgAN) and membranous nephropathy (MN) are the three leading causes of CKD in China [Citation2,Citation3]. CKD often progresses to end-stage renal disease (ESRD), requiring necessary renal replacement therapy (RRT) [Citation4]. Current therapeutic approaches available to halt CKD progression are quite limited and the outcomes remain poor [Citation4,Citation5].
Kidney fibrosis, characterized by excessive accumulation and deposition of extracellular matrix (ECM), is the common final pathway of virtually all advanced forms of CKD [Citation6,Citation7]. It is a complex process of unsuccessful wound healing of renal tissue after chronic, sustained injury, leading to progressive destruction of renal structure and loss of renal function [Citation8]. Targeting fibrosis, therefore, may have a remarkable clinical impact on improving the prognosis of CKD patients. Several significant targets have been found in fibrotic CKD in recent years, including transforming growth factor β (TGF-β), connective tissue growth factor (CTGF) and bone morphogenetic protein 7 (BMP-7) [Citation9]. TGF-β signaling pathway has a key role in the fibrotic responses of DKD, while platelet-derived growth factor (PDGF) pathway is important in the fibrotic process of IgAN and MN [Citation10,Citation11], with more needed to be investigated. Despite these advances in helping clarify the cellular and molecular mechanisms underlying renal fibrogenesis, antifibrotic strategies are still far from satisfactory as there is still a paucity of success in translating these advances to clinical application for the complicated pathogenesis of CKD [Citation10]. In light of this, it is quite necessary to further explore the genes associated with kidney fibrosis to enrich our understanding of the underlying molecular pathologic mechanisms of CKD and develop more effective therapies.
In the present study, we carried out a differential analysis of the fibrosis-related genes in the three most commonly seen types of CKD and their paired control samples by integrating NanoString technology with bioinformatics analysis to elucidate the common and specific differentially expressed genes (DEGs). This study may provide a more in-depth insight into the pathophysiology and treatment of fibrotic CKD.
Materials and methods
Sample preparation and NanoString analysis
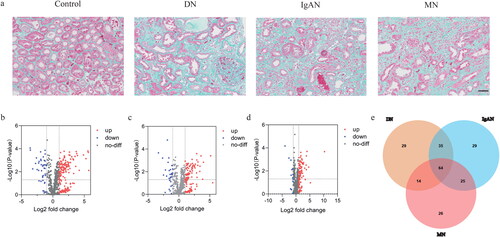
Kidney tissue samples were collected from the lower pole of the kidneys from twelve patients with biopsy-proven DN (n = 3), IgAN (n = 3), MN (n = 3), and renal cell carcinoma (n = 3). Samples from the normal areas of the nephrectomized kidneys from patients with renal cell carcinoma were set as normal controls. All samples were confirmed to be fibrosis or normal via regular light microscopy (). Tissues were immediately stored in liquid nitrogen and subsequently stored at −80 °C in preparation for use. This study was conducted in accordance with the Declaration of Helsinki, and the protocol was approved by the Ethics Committee of the Chinese PLA General Hospital (approval number: S2017-133-01). Written informed consent was obtained from all participants prior to sample collection.
Figure 1. Results of the pathological and NanoString analyses. (a) Representative images of Masson’s trichrome stained kidneys. Scale bar, 50 μm. (b) The volcano plots of the DEGs in DN. (c) The volcano plots of the DEGs in IgAN. (d) The volcano plots of the DEGs in MN. (e) The venn plot of the DEGs.
All the specimens were submitted to RNA extraction and analyzed using the NanoString nCounter® Human Fibrosis V2 Panel (NanoString Technologies, WA, USA) following the manufacturer’s instructions. RNA concentration and purity were assessed using the NanoDrop 2000 (Thermo Fisher Scientific, MA, USA) and RNA integrity was measured using the Agilent 2100 bioanalyzer (Agilent Technologies, CA, USA) before NanoString analysis. The raw data were processed via the nSolver 4.0 software (NanoString Technologies).
Identification of differentially expressed genes (DEGs)
DEGs between fibrosis and non-fibrosis samples were screened from the generated NanoString dataset using the nSolver 4.0 software, with |log2 fold change (FC) |>1 considered significant. The overlap DEGs among DN, IgAN and MN were visualized using the jvenn online software (https://jvenn.toulouse.inra.fr/app/example.html).
Enrichment analysis of differentially expressed genes (DEGs)
Gene Ontology (GO) analysis including biological process (BP), cellular component (CC), and molecular function (MF) is widely used for gene functional classification and annotation [Citation12]. Kyoto Encyclopedia of Genes and Genomes (KEGG) is a knowledge base for linking genomic information with higher-order functional information to obtain significantly enriched biological pathways [Citation13]. GO functional enrichment and KEGG pathway analysis of DEGs were investigated through the Database for Annotation, Visualization, and Integrated Discovery (DAVID, https://david.ncifcrf.gov/home.jsp). p < 0.05 and gene count ≥ 3 were regarded as the screening threshold.
Construction of protein–protein interaction (PPI) network and identification of hub genes
The PPI network was established based on the Search Tool for the Retrieval of Interacting Genes (STRING, https://string-db.org) database to demonstrate the functional interactions among DEGs. A combined score ≥ 0.4 was set as the cutoff criteria. The analyzed results were then imported into the Cytoscape software (version 3.7.2) for further integration and visualization. Hub genes were identified by Cytoscape plug-in CytoHubba.
Validation of hub genes
The Nephroseq database (https://v5.nephroseq.org) and quantitative real-time PCR (qRT-PCR) were applied to verify the NanoString results. The expression levels of the key genes in CKD patients were compared with those in normal controls utilizing the Nephroseq V5 tool. Clinical correlation between the hub genes and renal function was also evaluated via this tool.
For qRT-PCR analysis, total RNA was isolated from 12 fibrotic and normal samples using TRIzol reagent (Invitrogen). cDNA was synthesized with the SuperScript III First-Strand Synthesis System (Applied Biosystems, USA). qRT-PCR was performed with FastStart Universal SYBR Green Master Mix (Roche, Mannheim, Germany) using a 7500 FAST real‐time PCR system (Applied Biosystems, USA). The expression of the genes of interest was normalized to 18s rRNA. The primers are listed in .
Table 1. qPCR Primer sequences.
Statistics analysis
Data are presented as mean ± standard deviation (SD) as appropriate. Statistical analyses were implemented using GraphPad Prism 8.0 (GraphPad Software, CA, USA) and Stata 13.0 (Stata Corporation, College Station, TX, USA). Student’s t-test or Kruskal–Wallis tests were conducted to analyze the difference between the groups. Correlation analysis was assessed using Pearson correlation. Statistical significance was denoted as p < 0.05.
Results
Characteristics of the participants
shows the demographic, clinical and laboratory features of the participants involved in this study. Most of them were concomitant with the diagnosis of hypertension. There were no significant differences in age, body mass index (BMI) and diastolic blood pressure (DBP) among the four groups (p > 0.05). Systolic blood pressure (SBP), serum creatinine (Scr) and blood urea nitrogen (BUN) were remarkedly higher while estimated glomerular filtration rate (eGFR) were markedly lower in the DN group than those in the control group (p < 0.05). Additionally, the MN group had a significantly higher 24-h urinary total protein (24hUTP) compared with the control group (p < 0.05). It should also be mentioned that there was a trend toward an increase in Scr, BUN and 24hUTP as well as a decrease in eGFR in IgAN and MN groups versus the control group, however, it was not statistically significant (p > 0.05). This may be attributed to the small sample size.
Table 2. Demographic, clinical and laboratory features of study subjectsTable Footnote*.
Identification of the differentially expressed fibrosis-related genes
To elucidate the expression difference of the genes associated with fibrosis in DN, IgAN and MN, NanoString analysis was used to compare the expression levels of 760 fibrosis-related genes in these tissues and their paired controls. The results were shown in volcano plots (). After intersecting the three datasets, a total of 64 shared DEGs were screened out, among which CCL19 had the largest fold change (, Table S1). Additionally, a total of 29, 29 and 26 genes were identified to be specifically expressed in DN, IgAN and MN respectively (, Table S2-4).
Analysis of the differentially expressed genes (DEGs)
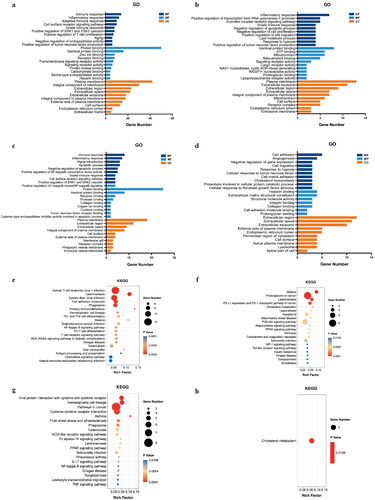
To further investigate the potential biological functions of the DEGs, GO and KEGG enrichment analysis were performed. In the GO analysis, the common and DN-specific, IgAN-specific DEGs in BP were mainly enriched in immune and inflammatory responses, while MN-specific DEGs were mainly related to cell adhesion and angiogenesis. The MF analysis revealed that the common and DN-specific, IgAN-specific DEGs were significantly involved in protein binding and identical protein binding, whereas MN-specific DEGs were remarkably participated in heparin binding and extracellular matrix structural constituent. As for CC, all the DEGs were mainly focused on plasma membrane, extracellular region and extracellular space (). In KEGG pathway analysis, the results displayed that the DEGs were primarily enriched in several pathways including NF-kB signaling pathway, PPAR signaling pathway, etc. ().
Figure 2. GO and KEGG pathway enrichment analysis of the DEGs. (a) GO result of the 64 common DEGs. (b) GO result of the 29 DN-specific DEGs. (c) GO result of the 29 IgAN-specific DEGs. (d) GO result of the 26 MN-specific DEGs. (e) KEGG result of the 64 common DEGs. (f) KEGG result of the 29 DN-specific DEGs. (g) GO result of the 29 IgAN-specific DEGs. (H) KEGG result of the 26 MN-specific DEGs.
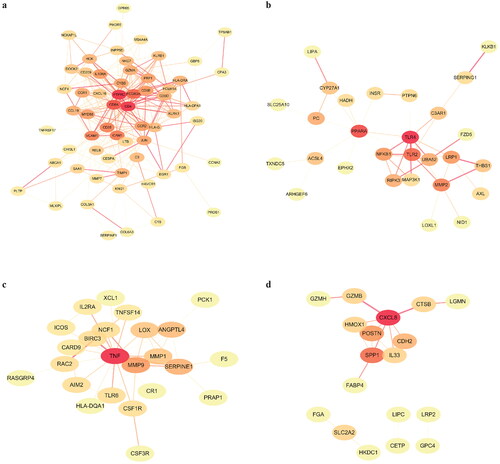
Successively, PPI networks were constructed by STRING database and visualized by Cytoscape software to analyze the core targets. The top 10 genes were identified as hub genes. For the 64 common DEGs, protein tyrosine phosphatase receptor type C (PTPRC) had the highest degree score in the PPI network, indicating its potential important role in fibrotic CKD. The other top hub genes included CD4, CD8A, (Fc fragment of IgG receptor IIIA) FCGR3A, intercellular cell adhesion molecule-1 (ICAM1), vascular cell adhesion molecule-1 (VCAM1), CD68, CD3E, interleukin 10 receptor alpha (IL10RA) and CC chemokine receptor 2 (CCR2) (). For the 29 DN-specific DEGs, the PPI network clearly showed two groups of linked proteins, at the center of which are toll-like receptor 4 (TLR4) and peroxisome proliferator-activated receptor alpha (PPARA) (). As for IgAN, tumor necrosis factor (TNF), matrix metalloprotein 9 (MMP9), serine protease inhibitor clade E member 1 (SERPINE1), angiopoetin-like 4 (ANGPTL4) and lactate oxidase (LOX) were the genes with the highest degree scores (). Furthermore, in MN, C-X-C motif chemokine ligand 8 (CXCL8) and secreted phosphoprotein 1 (SPP1) were found to have the most interactions with other genes (). However, for the hub genes in IgAN and MN, only SERPINE, LOX and SPP1 had a P value less than 0.05 (Table S3-4).
Figure 3. PPI network analysis of the DEGs. (a) PPI network of the 64 common DEGs. (b) PPI network of the 29 DN-specific DEGs. (c) PPI network of the 29 IgAN-specific DEGs. (d) PPI network of the 26 MN-specific DEGs.
Validation of the key genes
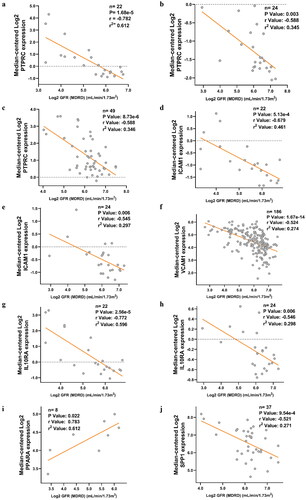
After the selection of the key genes, the functions of these genes in kidney fibrosis were ascertained by the Nephroseq V5 online tool. The results indicated that the expression levels of PTPRC, ICAM1, VCAM1, IL10RA, and CCR2 in CKD patients were significantly higher than those in healthy living donors. However, no significant difference was noted between the diseased and normal kidney samples in terms of PPARA expression (). It is also noteworthy that an obvious down-regulation of LOX was found in IgAN tissue compared with the control (). In addition, the association between the key genes and GFR were examined. The results revealed that the expression of PTPRC, ICAM1, VCAM1, IL10RA, and SPP1 in different types of CKD patients was negatively correlated with GFR, except for PPARA (). The results of the other hub genes were not available in the database.
Figure 4. Validation of the key DEGs in the Nephroseq database. (a) Expression of PTPRC in CKD tissues and the normal controls. (b) Expression of ICAM1 in CKD tissues and the normal controls. (c) Expression of VCAM1 in CKD tissues and the normal controls. (d) Expression of IL10RA in CKD tissues and the normal controls. (e) Expression of CCR2 in CKD tissues and the normal controls. (f) Expression of PPARA in DN tissues and the normal controls. (g) Expression of SPP1 in MN tissues and the normal controls. (h) Expression of LOX in IgAN tissues and the normal controls. *p < 0.05, **p < 0.01, ***p < 0.001.
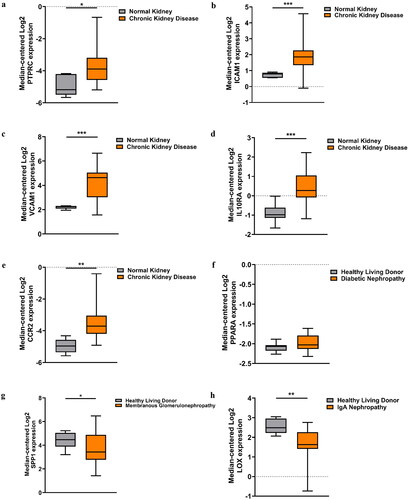
Figure 5. Correlation between the expression of hub genes and GFR in different types of CKD patients. (a) Correlation between PTPRC and GFR in DN patients. (b) Correlation between PTPRC and GFR in IgAN patients. (c) Correlation between PTPRC and GFR in MN patients. (d) Correlation between ICAM1 and GFR in DN patients. (e) Correlation between ICAM1 and GFR in IgAN patients. (f) Correlation between VCAM1 and GFR in CKD patients. (g) Correlation between IL10RA and GFR in DN patients. (h) Correlation between IL10RA and GFR in IgAN patients. (i) Correlation between PPARA and GFR in DN patients. (j) Correlation between SPP1 and GFR in MN patients. X axis: Log2 GFR (MDRD) (ml/min/1.73m2); Y axis: Median-centered Log2 expression of the genes.
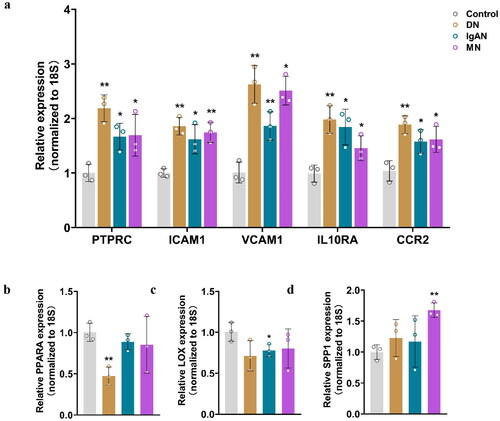
To further confirm the differential expression of the aforementioned genes, qRT-PCR analysis was performed. As shown in , the relative expression of PTPRC, ICAM1, VCAM1, IL10RA and CCR2 was significantly upregulated in all fibrosis groups compared to that in the controls. Furthermore, PPARA and LOX were downregulated in DN and IgAN groups respectively, while SPP1 was overexpressed in MN group ().
Figure 6. qRT-PCR analysis of the mRNA levels of the identified key genes in fibrotic CKD and normal tissues. (a) Relative expression of PTPRC, ICAM1, VCAM1, IL10RA and CCRA in DN, IgAN, MN and control groups. (b) Relative expression of PPARA in DN, IgAN, MN and control groups. (c) Relative expression of LOX in DN, IgAN, MN and control groups. (d) Relative expression of SPP1 in DN, IgAN, MN and control groups. n = 3. *p < 0.05, **p < 0.01. Student’s t-test was used for comparison between the groups.
Discussion
In this work, we identified the potential fibrosis-related genes in DN, IgAN, and MN using NanoString technology. A total of 64 common and 84 specific genes were screened out in these three CKD subtypes. GO functional and KEGG pathway analyses uncovered that the DEGs were particularly related to immune and inflammatory responses as well as cell adhesion, suggesting their pivotal roles in the occurrence and development of kidney fibrosis. In addition, the top 10 hub genes were selected via the PPI network. Further analysis demonstrated that PTPRC, ICAM1, VCAM1, IL10RA, and CCR2 might be involved in the common pathogenetic mechanisms of renal fibrosis, while PPARA, LOX, SPP1 might be specifically involved in the fibrosis progression of DN, IgAN, and MN respectively.
Broadly, the identified common genes can be classified into 2 clusters based on their predicted cellular functions: immune and inflammatory responses (PTPRC, IL10RA, CCR2) and cell adhesion (ICAM1, VCAM1)[Citation14–17].
It is now well appreciated that immune-mediated inflammatory responses are critical in renal fibrosis [Citation18]. PTPRC, also known as CD45, is a member of leucocyte common antigen family expressed on all nucleated cells of hematopoietic origin [Citation14]. PTPRC has an essential role in regulating T- and B-cell receptor signaling [Citation19]. Growing evidence has suggested the importance of T and B cells in renal fibrosis [Citation20,Citation21]. These two cells can contribute to renal fibrosis through cytokine secretion or interaction with other cells including fibroblasts, pericytes, tubular epithelial cells and macrophages, which, in turn, leads to the accumulation of myofibroblasts and matrix deposition[Citation20–22]. Given the ability of PTPRC to regulate the immune cell function and the results obtained from our study, the enhancement of PTPRC expression is speculated to be closely associated with the aggravation of renal fibrosis.
IL10RA is a receptor of IL10 that mediates IL-10 immunosuppressive signaling[Citation23]. IL10RA has been shown to be involved in a number of immune and inflammatory pathways such as JAK-STAT, NF-κB, and TGF-β signaling pathways [Citation23,Citation24]. Activation of these pathways has been implicated in the pathogenesis of a variety of immunity correlation kidney diseases, including DN, IgAN, and MN [Citation23,Citation25]. IL-10RA level is negatively correlated with interstitial fibrosis, indicating that the upregulation of IL-10RA may have the ability to prevent the lesions in tissues caused by exacerbated innate or adaptive immune responses [Citation26–28]. Notably, IL-10RA was observed to be highly expressed by fibrotic tissues in this study, which, may be in response to the tissue inflammation [Citation29,Citation30].
CCR2 is a member of chemokine receptor superfamily of human class A G-protein-coupled receptors expressed by monocytes, immature dendritic cells, as well as activated T-cell and B-cell subpopulations [Citation31,Citation32]. Recent studies provide strong evidence that CCR2 contributes significantly to the development of renal fibrosis and blockade of CCR2 is beneficial for progressive fibrosis via a diminishment in infiltration and activation of macrophages in the diseased kidneys [Citation33–35]. This is consistent with the finding in our study in which CCR2 was found to be overexpressed in fibrotic tissues compared to the controls.
Cell adhesion is also a notable bioprocess contributing to fibrosis[Citation36]. Cell adhesion molecules not only mediate cell-cell interactions such as leukocyte-endothelial adhesion but also support cells binding to the ECM [Citation36,Citation37]. Perturbations of adhesion through NF-κB or YAP/TAZ pathways has been reported to have a potential protective effect toward fibrosis [Citation38,Citation39]. In our study, an increase of ICAM1 and VCAM1 expression was detected, which is in line with the previous research. ICAM1 and VCAM1 are cell adhesion molecules belonging to the immunoglobulin gene superfamily [Citation40]. The primary functions of ICAM1 and VCAM1 are the mediation of leukocyte-endothelial cell interactions and signal transduction [Citation17,Citation41]. ICAM1 and VCAM1 expression is low in normal tissues while high in the tissues with fibrosis, suggesting their positive correlation with fibrotic disease [Citation41,Citation42]. Nevertheless, it has also been reported that ICAM1 might be negatively associated with renal fibrosis [Citation26]. This may be associated with its role in promoting angiogenesis, resulting in epithelial injury resolution and tissue repair [Citation43,Citation44]. Additional research is needed to further confirm this result. Overall, as cell adhesion molecules also play a pivotal role in the processes of inflammation [Citation45], it could be concluded that immune- and inflammation-related pathways may be the core process participating in the pathogenesis of fibrotic CKD. Thus, targeting genes associated with inflammation might be helpful in mitigating fibrosis during the management of CKD.
Despite identifying the common genes, we also searched for the genes specifically expressed in DN, IgAN and MN. As the correlation between TLR4 and DN progression cannot be validated by Nephroseq database, PPARA is regarded as the specific fibrosis-related gene for DN. PPARA is a nuclear transcription factor highly expressed in proximal renal tubular cells, having the function of modulating lipid and glucose metabolism as well as inflammatory response [Citation46,Citation47]. Converging lines of evidence support a link between PPARA and diabetes, in which PPARA deficiency has been suggested to contribute to the renal injury in DN [Citation46]. In our study, PPARA was downregulated in fibrotic tissues of DN patients, indicating the impairment of renal metabolism in DN.
LOX is a copper-dependent amine oxidase that catalyzes peptidyl lysine oxidation and initiates the cross-linking of collagen and elastin in the ECM [Citation48]. Collagen and elastin become insoluble fibers after cross-linking, and their excessive accumulation will ultimately lead to ECM remodeling and fibrosis [Citation49]. Evidence has shown that LOX expression is increased in many kinds of fibrotic kidneys including ischemia-reperfusion injury (IRI), unilateral ureteral obstruction (UUO) and folic acid (FA) [Citation50]. However, a decreased level of LOX was observed in the fibrotic tissues of IgAN patients in our study. This may be due to the reason that the expression of LOX may be time-dependent after injury and IgA-induced fibrosis may also have a pathogenesis differed from other types of renal fibrosis [Citation51]. As the relationship between LOX and IgAN progression remains unclear, future experiments are required to focus on this.
SPP1, also named osteopontin (OPN), is a secreted arginine-glycine-aspartate (RGD)-containing glycoprotein [Citation52]. SPP1 is mainly existed in the loop of Henle and distal nephrons in normal kidneys [Citation53]. It is documented that the SPP1 expression may be markedly elevated in diseased conditions such as fibrosis and silencing of SPP1 may attenuate the accumulation of macrophages, which thereby mitigating glomerular and interstitial fibrosis [Citation53–56]. SPP1 was detected to be increased and cholesterol metabolism was found to be the most significant enriched term in MN patients in our study. This result indicated that cholesterol metabolism may participate in MN pathogenesis and SPP1 may be correlated with it. Previous evidence has shown that lipid metabolism plays an essential role in the pathogenesis of MN and cholesterol level was significantly elevated in MN patients due to the abnormal lipid metabolism [Citation57–59]. One of the underlying mechanisms might be the local production of reactive oxygen species after subepithelial immune complex deposition, which leads to the formation of lipid peroxidation (LPO) adducts and ultimately alter the composition of the glomerular basement membrane [Citation59]. However, the role of SPP1 in this process is not clear. Given that thus far studies considering the association between SPP1 and MN are lacking, further research is still needed.
There are some limitations in our study. Firstly, the number of cases included in this study is relatively small, therefore, we could only provide preliminary results on the genes related to kidney fibrosis. Secondly, since all selected patients are in late stage of CKD, there are significant differences in eGFR and 24hUTP between the patients and controls, we could not know whether the genes screened out are also differentially expressed in patients with early stage of DN or in patients having MN with less proteinuria. Thirdly, as it is purely an observational study on biopsy samples with established fibrosis, we could not confirm the importance of the identified genes in fibrosis. Future study with larger sample size and fibrotic subjects at earlier phase of CKD is warranted to generate a firmer conclusion. Moreover, additional mechanistic research is also necessary to further confirm the findings of this study.
Conclusions
PTPRC, ICAM1, VCAM1, IL10RA and CCR2 might be used as the common therapeutic targets for kidney fibrosis in CKD regardless of the causes, while PPARA, LOX, SPP1 might be used as the diagnostic markers for DN, IgAN and MN respectively. Immune and inflammation associated pathways were highly relevant to the pathogenesis of fibrosis in CKD. Overall, our results indicated that there were both commonalities and differences in the mechanisms of fibrosis in different types of CKD, providing further insight into the pathophysiology and treatment of fibrotic kidney disease.
Acknowledgments
Not applicable.
Ethical statement
This study protocol was reviewed and approved by the Ethics Committee of the Chinese PLA General Hospital, approval number [S2017-133-01]. Written informed consent was obtained from all participants prior to sample collection.
Authors’ contributions
ZNF and QH conceived and designed the study. XDG, WJS, ZYD and GNS conducted sample selection and data management, undertook recruitment, collected phenotype data and obtained biological samples. ZNF, XDG and CL analyzed the sequencing data. ZNF, XDG and CL performed the experiments and data analysis. ZNF drafted the manuscript. GYC, XMC and QH revised the manuscript. All authors read and approved the final manuscript.
Supplemental Material
Download PDF (138.8 KB)Disclosure statement
No potential conflict of interest was reported by the authors.
Data availability statement
The authors confirm that the data supporting the findings of this study are available within the article and its supplementary materials.
Additional information
Funding
References
- Chen TK, Knicely DH, Grams ME. Chronic kidney disease diagnosis and management: a review. JAMA. 2019;322(13):1–12. doi: 10.1001/jama.2019.14745.
- Zhang L, Long J, Jiang W, et al. Trends in chronic kidney disease in China. N Engl J Med. 2016;375(9):905–906. doi: 10.1056/NEJMc1602469.
- Liu XM, Wang Q, Dong ZY, et al. Clinicopathological features of nondiabetic renal diseases from different age groups: an observational cross-sectional study. Chin Med J (Engl). 2018;131(24):2953–2959. doi: 10.4103/0366-6999.247197.
- Humphreys BD. Mechanisms of renal fibrosis. Annu Rev Physiol. 2018;80(1):309–326. doi: 10.1146/annurev-physiol-022516-034227.
- National kidney F. KDOQI clinical practice guideline for diabetes and CKD: 2012 update. Am J Kidney Dis. 2012;60(5):850–886. doi: 10.1053/j.ajkd.2012.07.005.
- Panizo S, Martinez-Arias L, Alonso-Montes C, et al. Fibrosis in chronic kidney disease: pathogenesis and consequences. Int J Mol Sci. 2021;22(1):408. doi: 10.3390/ijms22010408.
- Boor P, Ostendorf T, Floege J. Renal fibrosis: novel insights into mechanisms and therapeutic targets. Nat Rev Nephrol. 2010;6(11):643–656. doi: 10.1038/nrneph.2010.120.
- Webster AC, Nagler EV, Morton RL, et al. Chronic kidney disease. Lancet. 2017;389(10075):1238–1252. doi: 10.1016/S0140-6736(16)32064-5.
- Nastase MV, Zeng-Brouwers J, Wygrecka M, et al. Targeting renal fibrosis: mechanisms and drug delivery systems. Adv Drug Deliv Rev. 2018;129:295–307. doi: 10.1016/j.addr.2017.12.019.
- Ruiz-Ortega M, Rayego-Mateos S, Lamas S, et al. Targeting the progression of chronic kidney disease. Nat Rev Nephrol. 2020;16(5):269–288. doi: 10.1038/s41581-019-0248-y.
- Eitner F, Ostendorf T, Kretzler M, et al. PDGF-C expression in the developing and normal adult human kidney and in glomerular diseases. J Am Soc Nephrol. 2003;14(5):1145–1153. doi: 10.1097/01.asn.0000062964.75006.a8.
- Ashburner M, Ball CA, Blake JA, et al. Gene ontology: tool for the unification of biology. The gene ontology consortium. Nat Genet. 2000;25(1):25–29. doi: 10.1038/75556.
- Kanehisa M, Goto S. KEGG: orea encyclopedia of genes and genomes. Nucleic Acids Res. 2000;28(1):27–30. doi: 10.1093/nar/28.1.27.
- Al Barashdi MA, Ali A, McMullin MF, et al. Protein tyrosine phosphatase receptor type C (PTPRC or CD45). J Clin Pathol. 2021;74(9):548–552. doi: 10.1136/jclinpath-2020-206927.
- Park HK, Kim DH, Yun DH, et al. Association between IL10, IL10RA, and IL10RB SNPs and ischemic stroke with hypertension in orean population. Mol Biol Rep. 2013;40(2):1785–1790. doi: 10.1007/s11033-012-2232-5.
- Mysore V, Tahir S, Furuhashi K, et al. Monocytes transition to macrophages within the inflamed vasculature via monocyte CCR2 and endothelial TNFR2. J Exp Med. 2022;219(5):e20210562. doi: 10.1084/jem.20210562.
- Dejana E, Breviario F, Caveda L. Leukocyte-endothelial cell adhesive receptors. Clin Exp Rheumatol. 1994;12 Suppl 10: s 25–8.
- Lv W, Booz GW, Wang Y, et al. Inflammation and renal fibrosis: recent developments on key signaling molecules as potential therapeutic targets. Eur J Pharmacol. 2018;820:65–76. doi: 10.1016/j.ejphar.2017.12.016.
- Jonsson NN, Cox DK, Piper EK, et al. Allelic variation in protein tyrosine phosphatase receptor Type-C in cattle influences erythrocyte, leukocyte and humoral responses to infestation with the cattle tick rhipicephalus australis. Front Immunol. 2021;12:675979. doi: 10.3389/fimmu.2021.675979.
- Zhang M, Zhang S. T cells in fibrosis and fibrotic diseases. Front Immunol. 2020;11:1142. doi: 10.3389/fimmu.2020.01142.
- Zhu F, Bai X, Chen X. B lymphocytes in renal interstitial fibrosis. J Cell Commun Signal. 2017;11(3):213–218. doi: 10.1007/s12079-017-0382-x.
- Nikolic-Paterson DJ. CD4+ T cells: a potential player in renal fibrosis. Kidney Int. 2010;78(4):333–335. doi: 10.1038/ki.2010.182.
- Wei W, Zhao Y, Zhang Y, et al. The role of IL-10 in kidney disease. Int Immunopharmacol. 2022;108:108917. doi: 10.1016/j.intimp.2022.108917.
- Kapelski P, Skibinska M, Maciukiewicz M, et al. Family-based association study of interleukin 10 (IL10) and interleukin 10 receptor alpha (IL10RA) functional polymorphisms in schizophrenia in polish population. J Neuroimmunol. 2016;297:92–97. doi: 10.1016/j.jneuroim.2016.05.010.
- Yuan Q, Tang B, Zhang C. Signaling pathways of chronic kidney diseases, implications for therapeutics. Signal Transduct Target Ther. 2022;7(1):182. doi: 10.1038/s41392-022-01036-5.
- Hirohama D, Abedini A, Moon S, et al. Unbiased human kidney tissue proteomics identifies matrix metalloproteinase 7 as a kidney disease biomarker. J Am Soc Nephrol. 2023;34(7):1279–1291. doi: 10.1681/ASN.0000000000000141.
- Steen EH, Wang X, Balaji S, et al. The role of the anti-inflammatory cytokine interleukin-10 in tissue fibrosis. Adv Wound Care (New Rochelle). 2020;9(4):184–198. doi: 10.1089/wound.2019.1032.
- Ouyang W, Rutz S, Crellin NK, et al. Regulation and functions of the IL-10 family of cytokines in inflammation and disease. Annu Rev Immunol. 2011;29(1):71–109. doi: 10.1146/annurev-immunol-031210-101312.
- Yang CA, Li JP, Lai YH, et al. Assessing the immune cell subset and genetic mutations in patients with palindromic rheumatism seronegative for rheumatoid factor and anti-Cyclic citrullinated peptide. Arthritis Rheumatol. 2023;75(2):187–200. doi: 10.1002/art.42297.
- Berjaoui S, Povedano M, Garcia-Esparcia P, et al. Complex inflammation mRNA-related response in ALS is region dependent. Neural Plast. 2015;2015:573784–573711. doi: 10.1155/2015/573784.
- Singh R, Sobhia ME. Structure prediction and molecular dynamics simulations of a G-protein coupled receptor: human CCR2 receptor. J Biomol Struct Dyn. 2013;31(7):694–715. doi: 10.1080/07391102.2012.707460.
- Vande Broek I, Asosingh K, Vanderkerken K, et al. Chemokine receptor CCR2 is expressed by human multiple myeloma cells and mediates migration to bone marrow stromal cell-produced monocyte chemotactic proteins MCP-1, -2 and -3. Br J Cancer. 2003;88(6):855–862. doi: 10.1038/sj.bjc.6600833.
- Braga TT, Correa-Costa M, Silva RC, et al. CCR2 contributes to the recruitment of monocytes and leads to kidney inflammation and fibrosis development. Inflammopharmacology. 2018;26(2):403–411. doi: 10.1007/s10787-017-0317-4.
- Kitagawa K, Wada T, Furuichi K, et al. Blockade of CCR2 ameliorates progressive fibrosis in kidney. Am J Pathol. 2004;165(1):237–246. doi: 10.1016/S0002-9440(10)63292-0.
- Xu L, Sharkey D, Cantley LG. Tubular GM-CSF promotes late MCP-1/CCR2-Mediated fibrosis and inflammation after ischemia/reperfusion injury. J Am Soc Nephrol. 2019;30(10):1825–1840. doi: 10.1681/ASN.2019010068.
- Kanchanawong P, Calderwood DA. Organization, dynamics and mechanoregulation of integrin-mediated cell-ECM adhesions. Nat Rev Mol Cell Biol. 2023;24(2):142–161. doi: 10.1038/s41580-022-00531-5.
- Hintermann E, Christen U. The many roles of cell adhesion molecules in hepatic fibrosis. Cells. 2019;8(12):1503. doi: 10.3390/cells8121503.
- Choi HJ, Kim NE, Kim BM, et al. TNF-alpha-Induced Yap/TAZ activity mediates leukocyte-endothelial adhesion by regulating VCAM1 expression in endothelial cells. Int J Mol Sci. 2018;19(11):3428. doi: 10.3390/ijms19113428.
- Wada J, Makino H. Innate immunity in diabetes and diabetic nephropathy. Nat Rev Nephrol. 2016;12(1):13–26. doi: 10.1038/nrneph.2015.175.
- Kilic ID, Findikoglu G, Alihanoglu YI, et al. Circulating adhesion molecules and arterial stiffness. Cardiovasc J Afr. 2015;26(1):21–24. doi: 10.5830/CVJA-2014-060.
- Hauser IA, Riess R, Hausknecht B, et al. Expression of cell adhesion molecules in primary renal disease and renal allograft rejection. Nephrol Dial Transplant. 1997;12(6):1122–1131. doi: 10.1093/ndt/12.6.1122.
- Roy-Chaudhury P, Wu B, King G, et al. Adhesion molecule interactions in human glomerulonephritis: importance of the tubulointerstitium. Kidney Int. 1996;49(1):127–134. doi: 10.1038/ki.1996.17.
- Bui TM, Wiesolek HL, Sumagin R. ICAM-1: a master regulator of cellular responses in inflammation, injury resolution, and tumorigenesis. J Leukoc Biol. 2020;108(3):787–799. doi: 10.1002/JLB.2MR0220-549R.
- Haydinger CD, Ashander LM, Tan ACR, et al. Intercellular adhesion molecule 1: more than a leukocyte adhesion molecule. Biology (Basel). 2023;12(5):743. doi: 10.3390/biology12050743.
- Arnaout MA. Cell adhesion molecules in inflammation and thrombosis: status and prospects. Am J Kidney Dis. 1993;21(1):72–76. doi: 10.1016/s0272-6386(12)80725-6.
- Gao J, Gu Z. The role of peroxisome Proliferator-Activated receptors in kidney diseases. Front Pharmacol. 2022;13:832732. doi: 10.3389/fphar.2022.832732.
- Mirza AZ, Althagafi II, Shamshad H. Role of PPAR receptor in different diseases and their ligands: physiological importance and clinical implications. Eur J Med Chem. 2019;166:502–513. doi: 10.1016/j.ejmech.2019.01.067.
- Kagan HM, Li W. Lysyl oxidase: properties, specificity, and biological roles inside and outside of the cell. J Cell Biochem. 2003;88(4):660–672. doi: 10.1002/jcb.10413.
- Smith-Mungo LI, Kagan HM. Lysyl oxidase: properties, regulation and multiple functions in biology. Matrix Biol. 1998;16(7):387–398. doi: 10.1016/s0945-053x(98)90012-9.
- Zhang X, Zhou W, Niu Y, et al. Lysyl oxidase promotes renal fibrosis via accelerating collagen cross-link driving by beta-arrestin/ERK/STAT3 pathway. FASEB Journal: official Publication of the Federation of American Societies for Experimental Biology. 2022;36(8):e22427.
- Nuthakki VK, Fleser PS, Malinzak LE, et al. Lysyl oxidase expression in a rat model of arterial balloon injury. J Vasc Surg. 2004;40(1):123–129. doi: 10.1016/j.jvs.2004.02.028.
- Shin HD, Park BL, Cheong HS, et al. SPP1 polymorphisms associated with HBV clearance and HCC occurrence. Int J Epidemiol. 2007;36(5):1001–1008. doi: 10.1093/ije/dym093.
- Xie Y, Sakatsume M, Nishi S, et al. Expression, roles, receptors, and regulation of osteopontin in the kidney. Kidney Int. 2001;60(5):1645–1657. doi: 10.1046/j.1523-1755.2001.00032.x.
- Yu XQ, Wu LL, Huang XR, et al. Osteopontin expression in progressive renal injury in remnant kidney: role of angiotensin II. Kidney Int. 2000;58(4):1469–1480. doi: 10.1046/j.1523-1755.2000.00309.x.
- Cheng Y, Li Y, Scherer N, et al. Genetics of osteopontin in patients with chronic kidney disease: the german chronic kidney disease study. PLoS Genet. 2022;18(4):e1010139. doi: 10.1371/journal.pgen.1010139.
- Zhu X, Cheng YQ, Du L, et al. Mangiferin attenuates renal fibrosis through down-regulation of osteopontin in diabetic rats. Phytother Res. 2015;29(2):295–302. doi: 10.1002/ptr.5254.
- Dong L, Wei W, Han M, et al. Utility of non-HDL-C in predicting proteinuria remission of idiopathic membranous nephropathy: a retrospective cohort study. Lipids Health Dis. 2021;20(1):122. doi: 10.1186/s12944-021-01558-x.
- Fujita T, Nakamura N, Kumasaka R, et al. Comparison of lipid and fatty acid metabolism between minimal change nephrotic syndrome and membranous nephropathy. In Vivo. 2006;20(6B):891–893.
- Haas M, Kerjaschki D, Mayer G. Lipid-lowering therapy in membranous nephropathy. Kidney Int Suppl. 1999;71: s 110–2. doi: 10.1046/j.1523-1755.1999.07127.x.