
Abstract
The assessment of kidney function within the first year following transplantation is crucial for predicting long-term graft survival. This study aimed to develop a robust and accurate model using metabolite profiles to predict early long-term outcomes in patient groups at the highest risk of early graft loss. A group of 61 kidney transplant recipients underwent thorough monitoring during a one-year follow-up period, which included a one-week hospital stay and follow-up assessments at three and six months. Based on their 12-month follow-up serum creatinine levels: Group 2 had levels exceeding 1.5 mg/dl, while Group 1 had levels below 1.5 mg/dl. Metabolites were detected by mass spectrometer and first pre-processed. Univariate and multivariate statistical analyses were employed to identify significant differences between the two groups. Nineteen metabolites were found to differ significantly in the 1st week, and seventeen metabolites in the 3rd month (adjusted p-value < 0.05, quality control (QC) < 30, a fold change (FC) > 1.1 or a FC < 0.91, Variable Influence on Projection (VIP) > 1). However, no significant differences were observed in the 6th month. These distinctive metabolites mainly belonged to lipid, fatty acid, and amino acid categories. Ten models were constructed using a backward conditional approach, with the best performance seen in model 5 for Group 2 at the 1st-week mark (AUC 0.900) and model 3 at the 3rd-month mark (AUC 0.924). In conclusion, the models developed in the early stages may offer potential benefits in the management of kidney transplant patients.
1. Introduction
Kidney transplantation (KTx) is the preferred option for many individuals with end-stage kidney disease, as it offers numerous advantages such as improved quality of life, decreased mortality risk, and reduced financial burden [Citation1,Citation2]. Effective post-transplant care necessitates vigilant monitoring of allograft dysfunction. Detecting and addressing graft injury before irreversible harm develops is a crucial goal [Citation3]. Numerous risk factors have been identified that can impact kidney transplant outcomes. These factors include survival rejection episodes, nephrotoxic agents, recipient age, donor age, race, presence of diabetes, delayed graft function, Human Leukocyte Antigens (HLA) compatibility, Cytomegalovirus infection, and periods of warm (WIT) and cold ischemia (CIT), as well as acute graft effects, which refer to the immediate effects on the transplanted kidney [Citation4–7]. Serum creatinine levels and creatinine clearance are valuable markers for identifying patients the highest risk of graft loss (HREGL) after transplantation [Citation8]. Standard monitoring methods for assessing graft dysfunction encompass various approaches, including clinical evaluation, urine and serum parameters of kidney function, measurement of immunosuppressive drug levels, and renal allograft biopsy [Citation9,Citation10]. Serum creatinine, commonly used to assess kidney function, requires cautious interpretation. Its levels can significantly vary due to factors like age, gender, muscle mass, metabolism, body weight, nutrition, and hydration. Moreover, serum creatinine may not increase until significant kidney damage has occurred, potentially indicating the presence of renal injury before creatinine levels elevate [Citation11]. In cases where definitive diagnosis is required, follow-up biopsies are necessary. However, renal biopsies present certain drawbacks, including invasiveness, impracticality in clinical settings, potential risks of bleeding and elevated blood pressure [Citation12].
Metabolomics, a technique that involves analyzing metabolites in various biological matrices like urine, blood, feces, and tissues, is utilized for biomarker discovery and unraveling metabolic mechanisms. This field has witnessed remarkable advancements in bioinformatics and the adoption of high-throughput technologies, including capillary electrophoresis mass spectrometry, nuclear magnetic resonance, ultra-performance liquid chromatography coupled with electrospray ionization/quadrupole-time-of-flight mass spectrometry (UPLC/ESI/QToF-MS), infrared spectroscopy, and gas chromatography-mass spectrometry [Citation13–15]. MS technology offers significantly higher selectivity and sensitivity compared to nuclear magnetic resonance, and it is also a more cost-effective option [Citation16,Citation17]. Urine is advantageous due to its noninvasive collection, cost-effectiveness, and lower protein interference, allowing precise metabolite analysis. Its use for biomarker research minimizes complications associated with other sample types [Citation16,Citation18]. After undergoing a kidney transplant, patients will need to take medication and undergo regular monitoring to minimize the risk of organ rejection. This lifelong commitment to medication and monitoring is essential for maintaining the proper functioning of the transplanted kidney. The health and functionality of the kidneys are vital for overall well-being and quality of life [Citation19].
To enhance kidney transplant patient outcomes and enable timely intervention, detecting kidney disease early is crucial. In this study, 61 kidney transplant recipients were examined using advanced technology - ultra-high-performance liquid chromatography coupled with a benchtop QTof mass spectrometer. The goal was to find metabolite biomarkers indicating early Long-Term Outcomes (LTO) in patients at high risk of graft loss. Specifically, those with serum creatinine levels above 1.5 mg/dl after 12 months. By creating a reliable model based on these biomarkers, the study aims to provide doctors with a vital tool for early prediction and intervention, potentially improving patient survival.
2. Materials and methods
The Ethics Committee approved the study of Acıbadem Mehmet al.i Aydınlar University (Turkey). Prior to participation, all individuals provided informed written consent in accordance with the approved protocol (Approval ID: 2022-02/30). Informed consent was obtained from all subjects involved in the study.
Throughout the one-year follow-up, 61 kidney transplant recipients were closely monitored. This group consisted of 36 individuals in group 1 and 25 in group 2 during the first week, 29 in group 1 and 24 in group 2 at the third month, and 32 in group 1 and 23 in group 2 at the sixth month for routine post-transplant analysis. This monitoring also involved a one-week hospital stay and follow-up assessments at three and six months. Their 12-month follow-up serum creatinine levels categorized them into two groups: Group 2 had levels exceeding 1.5 mg/dl, while Group 1 had levels below 1.5 mg/dl. In our investigation, we did not observe any occurrences of rejection throughout the one-year follow-up period. Furthermore, no instances of delayed graft function were noted among the patients during this same follow-up duration. It’s crucial to emphasize that all surgical procedures utilized organs donated by living individuals. Data acquisition was performed using liquid chromatography-mass spectrometry (LC-MS) with the Xevo G2 XS QTof system. The detected metabolites were pre-processed and subjected to univariate and multivariate statistical analyses to uncover significant differences between the groups. In our study, analysis of the 24-hour urine volume revealed no statistically significant differences among the study participants (p > 0.05) (Supplementary File). Therefore, total urine volume was not used for data normalisation in the subsequent analyses. Instead, normalization of the metabolomic data was carried out using Total Ion Chromatogram (TIC)-based methods For a detailed and comprehensive analysis, see the Supplementary File.
3. Results
3.1. Technical reproducibility
Based on the evaluation of QC samples prepared from the study samples, it is crucial to effectively monitor the performance of the system in important analytical parameters such as retention time, detector response, and mass accuracy to ensure more reliable results. In our study, the data analysis demonstrated that the QC samples exhibited a tight clustering pattern (Figure 1S(A,B)). This observation confirms the reliability of the metabolomics data and indicates the effectiveness and repeatability of the method used for metabolite profiling of human urine.
3.2. Group comparison, univariate and multivariate statistical analysis
This study involved kidney transplant recipients categorized into two groups based on their serum creatinine levels at the 12th-month post-transplantation. Group 1 comprised patients with serum creatinine levels below 1.5, while Group 2 included those with levels exceeding 1.5 [Citation8,Citation9]. Metabolite measurements were conducted on urine samples taken from all recipients at the 1st week, 3rd month, and 6th month post-transplant. Comparisons between Group 1 and Group 2 were made to identify potential disparities in urinary metabolite profiles linked to kidney function and transplant outcomes.
The OPLS-DA model was utilized to identify potential biomarkers distinguishing between groups. OPLS-DA score plots exhibited clear metabolic profile differences between Group 1 and Group 2 at 1st week, 3rd month, and 6th month time points. These plots displayed distinct separation, signifying significant urinary metabolite differences. Notably, the 1st-week model showed R2Y of 0.98 and Q2 of 0.54, indicating good fit; likewise, the 3rd-month model demonstrated R2Y of 0.95 and Q2 of 0.50, denoting reliable separation (). These findings imply the potential of the identified metabolites as biomarker candidates for distinguishing between the groups post kidney transplantation. it’s important to note that no significant variations in features were observed during the 6th month after transplantation. Furthermore, the developed OPLS-DA model for the 6th month indicated overfitting, raising concerns about its ability to accurately capture the dataset’s underlying patterns.
Figure 1. The OPLS-DA-generated score plots and volcano plots depict samples from Group 1 (depicted by green circles) and Group 2 (depicted by blue circles) after kidney transplantation. The analysis contrasts data from the first week (1 W) and the third month (3 M) following kidney transplantation in the ESI-positive mode. (A,B) showcases volcano plots for Group 1 and Group 2 during the first week (A) and the third month (B) post-kidney transplantation. (C,D) demonstrates the outcomes of the OPLS-DA model for Group 1/Group 2 in the first week (C) and Group 1/Group 2 in the third month after kidney transplantation in ESI-mode (D). in these figures, ‘QC’ denotes the quality control sample, ‘1 W’ represents the first week, and ‘3 M’ represents the third month.
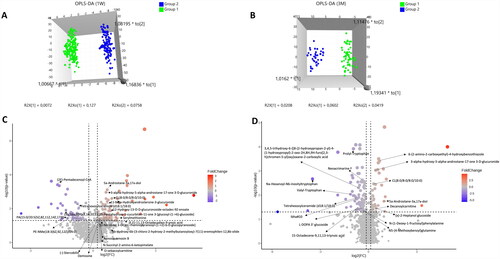
The OPLS-DA models’ predictive ability and variable significance were validated using VIP plots (). These plots confirmed metabolites with notable abundance differences between groups, contributing to separation. Statistical evaluations, including the CV-ANOVA and permutation tests, were conducted. CV-ANOVA produced p-values of 1.61E-32 (1st week) and 3.46E-11 (3rd month), indicating strong predictive power. The permutation test involved 200 permutations, comparing R2 and Q2 values of true models with those of permuted models. For the 1st-week comparison, R2 and Q2 values were superior in true models (0.952 and −0.336). Similarly, for the 3rd-month comparison, true models outperformed permutations (R2: 0.905, Q2: −0.291). This highlights the genuine models’ robustness in revealing significant differences between groups.
3.3. 1st week and 3rd month statistics
Serum creatinine levels are crucial markers for identifying a specific subset of patients within HREG. The discriminative ability of serum creatinine in distinguishing Group 2 from Group 1 in HREG was assessed through ROC analysis. In the 1st week post-transplantation, the AUC for serum creatinine was 0.73 (95% confidence interval: 0.674 to 0.785, p-value: 0.0001, model 1), indicating moderate to good discriminative power at this time point. Multivariable statistical analyses revealed significant differences between Group 1 and Group 2 based on serum creatinine levels at various time points. In the 1st week, 19 metabolites exhibited significant differences, and in the 3rd month, 17 metabolites were notably different. These distinctions were based on criteria including (adjusted p-value < 0.05, quality control (QC) < 30, a fold change (FC) > 1.1 or a FC < 0.91, VIP) > 1, as detailed in Table S2–S3. The identified metabolites hold the potential to serve as biomarkers for distinguishing the two groups based on serum creatinine levels.
The identified metabolites exhibiting significant differences between Group 1 and Group 2 belong to diverse classes, including fatty acyls, steroids, glycerolipids, glycerophospholipids, sphingolipids, saccharolipids, amino acids, prenol lipids, and sophorolipids (Table S2 and S3). To gauge the discriminatory potential of these metabolites, individual ROC curve analyses were conducted. In the 1st week post-kidney transplantation, the resulting AUC values ranged from 0.39 to 0.71, and in the 3rd month, from 0.32 to 0.76. These AUC values reflect the metabolites’ ability to differentiate between the two groups. Notably, there was variability in AUC values, with some metabolites demonstrating weak to moderate discriminative capability.
3.4. Combined biomarkers model
As shown in Tables S4 and S5, based on the Stepwise Backward logistic regression analysis, a total of five models were constructed: three models with clinical variables and two models without clinical variables both assessed in the 1st week and the 3rd month following kidney transplantation. The models were built using the potential individual biomarker candidates, their log-transformed values, log-transformed ratios, and serum creatinine ratios. The models without clinical variables focused solely on the metabolomic variables, their transformations, transformation ratios, and serum creatinine ratios. These models aimed to evaluate the discriminative power of the selected biomarkers in predicting the group classification. On the other hand, the models with clinical variables included not only metabolomic variables but also additional clinical variables such as gender, diabetes, HLA mismatch, WIT, CIT, and donor age. By incorporating clinical variables, these models aimed to assess the combined effect of both metabolomic and clinical factors in predicting the group classification. A total of 10 models were developed, consisting of 5 models constructed in the first week after transplantation and another 5 models constructed in the third month after transplantation. These diverse models encompassed various combinations of variables, enabling a comprehensive analysis of potential biomarkers and their interactions with clinical factors. This approach facilitated a thorough exploration of the complex dynamics between biomarkers and clinical variables within the specific time frames considered. Here is a summary of the different models we constructed: In Model 1, only serum creatinine was entered as a predictor variable. In Model 2, the same serum creatinine variable from Model 1 was retained, and additional clinic variables (gender, diabetes, HLA mismatch, WIT, CIT, and donor age) were added to the model. Model 3 introduced potential individual biomarker candidates’ serum creatinine ratios as predictor variables. Model 4 retained these ratios from Model 3 and added the same additional clinic variables as in Model 2. Lastly, Model 5 expanded on Model 4 by considering potential individual biomarker candidates, their log-transformed values, log-transformed ratios, and additional clinic variables both in the first week and three months after kidney transplantation.
The Hosmer & Lemeshow (H-L) goodness-of-fit test assesses the agreement between observed and predicted outcomes, with lower p-values suggesting a potential lack of fit. As shown Table S4, In the 1st week after kidney transplantation, in Model 1 and Model 2, the H-L test yielded significant p-values of 0.001, indicating a possible lack of fit. However, Model 3, Model 4, and Model 5 had p-values of 0.116, 0.066, and 0.175, respectively, suggesting a better fit for these models. The Nagelkerke (pseudo) R^2 values measure the proportion of variance explained by the models, with higher values indicating a better fit. In this case, Model 5 had the highest R^2 value of 0.571, followed by Model 4 (0.414), Model 2 (0.328), Model 3 (0.173), and Model 1 (0.099). These results indicate the goodness-of-fit of the logistic regression models.
During the 3rd month after kidney transplantation, the Hosmer & Lemeshow (H-L) goodness-of-fit test results, as presented in Table S5, indicated that all models demonstrated considerably high p-values. This suggests that the models provided a good fit for the data during this post-transplantation period. The Nagelkerke (pseudo) R^2 values showed that Model 3 had the highest R^2 value of 0.650, indicating that it had the strongest explanatory power among the models, followed by Model 5 (0.610), Model 4 (0.576), Model 2 (0.5383), and Model 1 (0.347).
In our investigation of the contribution of gender to the models in the first week after kidney transplantation, we found consistent results across multiple models. In Models 1,4 and 5, the odds ratios for gender were 0.242, 0244, and 0.412, respectively. (Table S4). These results indicate that being female is associated with a lower likelihood of being in Group 2, suggesting that female patients may have a reduced risk of renal dysfunction compared to male patients. In summary, our logistic regression analysis consistently suggests that being female is associated with a reduced risk of renal dysfunction compared to being male in kidney transplant patients during the first week after transplantation. This indicates that gender can serve as an important predictive factor for early LTO in patients at the HREGL after transplantation. Nevertheless, further validation and investigation are warranted to confirm these findings and delve into the underlying mechanisms contributing to the observed gender-based differences in outcomes.
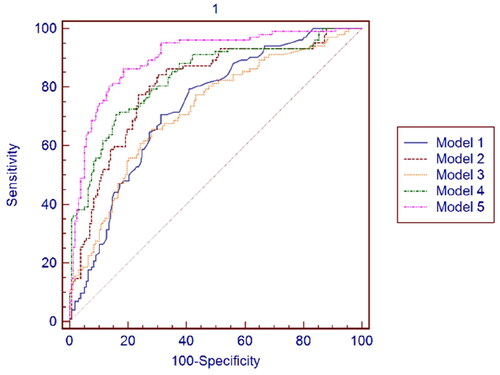
In the 1st week and 3rd month after kidney transplantation, the ROC analysis was conducted to assess the discriminative ability of Group 2 from Group 1 for Model 1, Model 2, Model 3, Model 4, and Model 5. As shown in Table S6, the AUC values obtained for each model in the 1st week after kidney transplantation indicate the discriminative ability of each model in distinguishing Group 2 from other groups. Model 5 demonstrates the highest AUC value (0.900), suggesting a good discriminative ability. Model 2 and Model 4 also show moderate discriminative abilities with AUC values of 0.805 and 0.834, respectively. Model 3 exhibits a slightly lower discriminative ability with an AUC value of 0.721. See for the ROC curve for the data presented in Table S6.
Figure 2. ROC curves of Model 1. Model 2. Model 3. Model 4 and Model 5 in the 1st week after kidney transplantation.
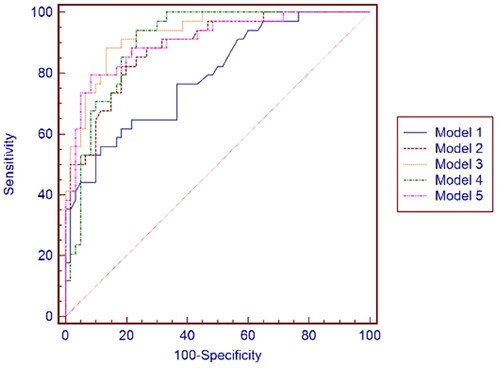
As shown in Table S7, Based on the provided AUC values, the best model in the 3rd month after kidney transplantation is Model 3, which has an AUC = 0.924 (95% Confidence interval 0.851 to 0.968, p-value = 0.0001). This model exhibits the highest AUC value among all the models, indicating a strong discriminatory ability in distinguishing between Group 2 and Group 1 in the 3rd month after kidney transplantation. See for the ROC curve for the data presented in Table S7.
Figure 3. ROC curves of Model 1, Model 2, Model 3, Model 4, and Model 5 at the 3rd month after kidney transplantation.
In Model 5, in the first week after kidney transplantation, the variable with the most significant contribution to the model was the ratio of HMDB0010365 to HMDB0113193, with an odd ratio of 3.71 (95% confidence interval: 1.15–11.90) and a p-value of 0.027 (Table S4). In Model 3, in the third month after transplantation, the variable with the most significant contribution to the model was the ratio of HMDB011679 to serum creatinine, with an odd ratio of 5.272 (95% confidence interval: 2.089–13.300) and a p-value of less than 0.0001 (Table S5). These results indicate that these specific biomarker ratios have a statistically significant association with the outcome being studied (e.g., graft survival or kidney function) in the respective time periods. CIT was excluded from all the models due to a lack of statistical significance. It appears that CIT did not demonstrate a significant association with the outcome being investigated in any of the models at either time point.
4. Discussion
Prior studies have highlighted the significance of serum creatinine levels at 6 and 12 months and their change in predicting graft survival and long-term graft survival [Citation9]. However, current monitoring methods for kidney transplants are limited [Citation11,Citation12]. The primary goal of this study was to construct a robust and accurate model using metabolite profiles to predict early LTO in patient groups at the HREGL. The study introduces a novel approach, utilizing non-targeted LC-MS-MS urine metabolomic analysis, to predict LTO in these patient groups. This research addresses a critical need for accurate early prediction methods in kidney transplant monitoring.
Using a panel of marker candidates instead of a single marker in a biological system can enhance discrimination capabilities. This approach captures various facets of the system, boosting accuracy, sensitivity, and specificity in diagnostic or predictive models [Citation20]. This study employed logistic regression to create models incorporating metabolomic and clinical variables. The study generated 10 models, 5 for the first week and 5 for the 3rd month post-transplantation. The most successful models were identified with high AUC values (0.900 in the 1st week, 0.924 in the 3rd month). These models offer insights into potential biomarkers for kidney transplantation outcomes, especially in the early stages, aiding risk assessment and targeted interventions for improved graft survival. However, no significant differences were observed in the 6th month. As patients recover from kidney transplant surgery, their initial metabolic changes, driven by the stress and adaptation to the new organ, undergo significant shifts. This dynamic phase of recovery is marked by notable metabolic perturbations. Yet, as patients stabilize and experience enhancements in their overall health, these early metabolic alterations tend to normalize. The body endeavors to return to a state of homeostasis, a balanced physiological condition. The successful adaptation and stabilization of kidney function by the 6th month suggest a potential approach to a metabolic baseline, resulting in a diminished number of significantly different metabolites.
A higher disparity in HLA between donor and recipient can increase the risk of the recipient’s immune system attacking the graft [Citation21]. This study revealed that patients with lower HLA mismatch experienced better kidney function one year after transplantation, underscoring a significant link between HLA mismatch and renal outcomes. This aligns with existing research. Furthermore, studies suggest improved kidney transplant prognosis for patients with preexisting diabetes after one year [Citation22,Citation23]. This study supports this, indicating a potential positive association between kidney transplantation and better renal results in diabetic patients. However, more research is needed for validation and a comprehensive understanding.
The study revealed significant differences in metabolites between patient groups, particularly in lipids like glycerophospholipids and sphingolipids [Citation24]. The study revealed significant differences in metabolites between patient groups, particularly in lipids like glycerophospholipids and sphingolipids. These lipids are associated with glomerular disease development, implying their role in kidney-related disorders’ pathogenesis. Phosphatidylcholine, a prevalent glycerophospholipid synthesized via the Kennedy pathway in normal kidneys, is vital for renal cell membrane composition. Its enhanced biosynthesis in response to growth signals suggests its early role in kidney cell responses. Research linking phosphatidylcholine to T cell-mediated rejection underscores its involvement in kidney rejection’s pathophysiology [Citation25]. The study highlighted metabolite HMDB0113193, involved in phosphatidylcholine biosynthesis, along with abnormal cardiolipin levels, as potential indicators for early prediction, especially in high-risk patient groups. Cardiolipin, a mitochondrial inner membrane phospholipid, is crucial for diverse cellular processes. Changes in cardiolipin levels post-kidney transplantation suggest its role in renal function restoration [Citation26,Citation27]. This research has indicated that the expression HMDB0116798, which refers to cardiolipin, decreases from one week to three months post-transplantation. This suggests that the process of renal function restoration may contribute to changes in cardiolipin levels during the early stages of kidney transplantation.
Sphingolipids, critical components of cell membranes, play diverse roles in cellular functions including adhesion, proliferation, migration, inflammation, and apoptosis [Citation28]. Imbalances in sphingolipid metabolism, particularly within specific glomerular cells like podocytes, have been linked to kidney disease progression [Citation29]. Such imbalances can disrupt podocyte function, cause glomerular inflammation, and impair the filtration barrier. Understanding the role of sphingolipids in kidney disease pathogenesis can potentially provide insights into novel therapeutic targets and interventions for the management of renal disorders. Our research emphasized the identification of the glycosphingolipid HMDB0004961, situated within sphingolipid subclasses, as notably linked to the risk of kidney dysfunction in recipients of kidney transplants. This discovery holds significance in foreseeing early, long-term consequences in patients at the utmost vulnerability of graft loss post-transplantation.
Previous studies have shown that testosterone and androgens are associated with an increased risk of ischemia-reperfusion injury [Citation30,Citation31]. Moderate to severe sexual dysfunction is a common occurrence in the advanced stages of kidney failure. Evidence suggests that reduced levels of circulating sex steroidal hormones are not only linked to clinical hypogonadism but may also be associated with an increased risk of premature cardiovascular disease development and graft loss. These hormones play a significant role in the pathogenesis and progression of kidney failure, contributing to adverse outcomes beyond hypogonadism alone [Citation32–35] According to recent data, physiological levels of sex hormones are typically restored around six months after a successful kidney transplantation. This restoration occurs as uremia, a condition associated with kidney failure, is no longer present [Citation35–38]. Steroid hormones play a crucial role in regulating various physiological functions, including blood salt balance, reproduction, maintenance of secondary sexual characteristics, response to stress, immunomodulation, regulation of stress responses, neuronal function, modulation of lipid metabolism, and various metabolic processes [Citation39]. Androgens, such as testosterone, androstenedione, and dehydroepiandrosterone sulfate, are major circulating androgens in the systemic circulation [Citation40]. Additionally, sex steroid hormone concentrations, including androgens and estrogens, have been linked to renal function decline and greater evidence of kidney damage. Steroids have also been studied as part of maintenance therapy for kidney transplants [Citation41–43]. In our study, we included steroid hormones in our model as a lipid type due to their enhanced sensitivity and specificity in identifying patients in Group 2. This garnered significant attention as the study pinpointed HMDB0000458, HMDB0010365, HMDB0010351, HMDB0035345, and HMDB0034205 as significant steroid hormone metabolites distinguishing groups in the first week after KTx. Findings suggest that HMDB0010365 and HMDB0000458 expression increases from one week to three months post-transplantation, indicating altered steroid hormone biosynthesis in HREGL patient groups. These hormones could potentially predict early LTO. The study underscores the importance of steroid hormones as essential metabolite structures for predicting LTO in HREGL patients. Moreover, HMDB0060118, identified as a saccharolipid, holds potential as a candidate in a metabolic biomarker model, suggesting the involvement of saccharolipids and other lipid types in prognosticating outcomes in high-risk end-stage renal disease patient groups. This underscores the importance of contemplating diverse lipid types, encompassing steroid hormones and saccharolipids, as possible biomarkers for foreseeing results in such patient cohorts.
Our study revealed notable alterations in fatty acids and amino acids expression, affecting the group at risk of early graft loss. Specifically, changes in amino acids like HMDB0012266, HMDB0029138, and HMDB0029452, along with lipids, were identified. Previous research linked lysine synthesis disruptions to acute rejection and post-transplant diabetes [Citation44,Citation45]. HMDB0012266, an intermediate in lysine synthesis [Citation46], showed increased levels in Group 2 compared to Group 1, potentially predicting early graft loss risk. Fatty acid metabolism disturbances have implications in conditions like chronic kidney disease and transplantation, causing mitochondrial dysfunction and cellular damage [Citation47–49]. Long-chain acyl-CoA, involved in fatty acid metabolism, membrane modifications, and physiological processes, is linked to these disturbances [Citation50]. Our findings emphasize HMDB0062229 and HMDB0012266's importance as early graft loss risk biomarkers within the first week after kidney transplantation. These metabolites from fatty acid and amino acid classes offer insights into early graft adaptation’s metabolic changes and could potentially predict poor outcomes in at-risk patients.
The study faces limitations, notably the relatively small sample size. In order to establish the predictive efficacy for long-term patient outcomes at HREGL, it is imperative to carry out a focused LC-MS approach within a more extensive longitudinal investigation. Expanding this research is vital for enhancing the clinical utility of these biomarkers in the management of kidney transplant patients, providing more dependable insights, and ultimately improving patient outcomes. Another constraint in our study arises from the potential introduction of variability into the metabolomic data due to the absence of standardized dietary conditions or fasting requirements during sample collection, which could affect the precision and comprehensibility of our results. Additionally, while our study sought to elucidate metabolomic profiles primarily from a human perspective, it’s essential to acknowledge the challenges in precisely attributing metabolites to human or microbial origins. The current methodologies, though advanced, might not entirely differentiate between the two sources. Our samples were predominantly from human subjects, and the study didn’t explicitly explore microbial contributions. Further investigations are warranted to determine the origin of these metabolites, whether human or microbial. In the study, TIC-based normalization was opted for because of its recognized advantages, especially in the context of the untargeted metabolomics [Citation51, Citation52]. This approach offers a global normalization strategy that considers the overall composition of metabolites in a sample. Notably, our investigation found no significant statistical differences in 24-hour urine volumes among the subjects studied. It is important to recognize that our deliberate choice of TIC normalization over expressing metabolite concentrations in terms of daily excretion amounts via multiplication with urine volume may be perceived as a limitation. While we acknowledge the value of expressing metabolite concentrations in relation to urine volume, our study prioritized the advantages offered by TIC normalization. This decision should be considered in the context of the specific goals and characteristics of our untargeted metabolomics analysis. Future studies may explore the comparative implications of different normalization methods, taking into account both the advantages and limitations of each approach. Additionally, the absence of significant statistical differences in urine volumes in our study enhances the robustness of our chosen normalization strategy within the scope of our investigation.
5. Conclusions
In summary, we formulated ten models using a backward conditional approach with model 5 performing best for Group 2 in the first week (AUC 0.900) and model 3 excelling at the 3rd month (AUC 0.924). These outcomes underscore the potential of our models to predict early LTO in individuals at risk of early graft loss. This insight holds promise for refining strategies and interventions to enhance the success of kidney transplant recipients. The incorporation of these biomarkers into predictive models can improve risk assessment and guide interventions, particularly in high-risk patients.
Author contribution
Ihsan Yozgat: Investigation, Conceptualization, Writing - Original draft preparation; Investigation, Methodology, Data curation, Formal analysis, Software; Ulkem Cakir: Conceptualization, Data curation, Investigation, Methodology, Writing—review & editing; Muhittin Abdulkadir Serdar: Conceptualization, Data curation, Formal analysis, Methodology, Writing—review & editing; Sevgi Sahin: Conceptualization, Investigation, Methodology, Writing—review & editing; Osman Ugur Sezerman: Data curation, Formal analysis, Methodology, Software, Writing—review & editing; Emirhan Nemutlu: Conceptualization, Formal analysis, Methodology, Writing—review & editing; Ahmet Tarik Baykal: Conceptualization, Data curation, Formal analysis, Methodology, Project administration, Software, Supervision, Writing—review & editing; Mustafa Serteser: Conceptualization, Formal analysis, Funding acquisition, Methodology, Project administration, Resources, Supervision, Writing—review & editing.
Supplemental Material
Download MS Excel (14.6 MB)Acknowledgments
The authors express our sincere gratitude to the patients who participated in this study, as their willingness to contribute and provide valuable insights is highly appreciated. Furthermore, the authors extend their heartfelt thanks to Dr. Gülay Yılmaz, we also acknowledge the invaluable contributions of Derya Candan, the organ transplant coordinator, Nilgun Demiroz, the organ transplant responsible nurse, and Sukran Cakan, the laboratory responsible technician, all of whom played crucial roles in the success of this study. Their commitment, professionalism, and support throughout the research process were truly integral.
Disclosure statement
The authors declare that there are no conflicts of interest.
Additional information
Funding
References
- Oweira H, Ramouz A, Ghamarnejad O, et al. Risk factors of rejection in renal transplant recipients: a narrative review. J Clin Med. 2022;11(5):1–9. doi: 10.3390/jcm11051392.
- Lemoine M, Beauport DT, Lobbedez T, et al. Risk factors for early graft failure in recipients older Than 70 years. Kidney Int Rep. 2019;4(5):656–666. doi: 10.1016/j.ekir.2019.01.014.
- Swanson KJ, Aziz F, Garg N, et al. Role of novel biomarkers in kidney transplantation. World J Transplant. 2020;10(9):230–255. doi: 10.5500/wjt.v10.i9.230.
- Schold JD, Nordyke RJ, Wu Z, et al. Clinical events and renal function in the first year predict long-term kidney transplant survival. Kidney360. 2022;3(4):714–727. doi: 10.34067/KID.0007342021.
- Hamidi O, Poorolajal J, Farhadian M, et al. Identifying important risk factors for survival in kidney graft failure patients using random survival forests. Iran J Public Health. 2016;45(1):27–33.
- Hariharan S, Israni AK, Danovitch G. Long-Term survival after kidney transplantation. N Engl J Med. 2021;385(8):729–743. doi: 10.1056/nejmra2014530.
- Kahraman S, Genctoy G, Cil B, et al. Prediction of renal allograft function with early doppler ultrasonography. Transplant Proc. 2004;36(5):1348–1351. doi: 10.1016/j.transproceed.2004.05.030.
- First MR. Renal function as a predictor of long-term graft survival in renal transplant patients. Nephrol Dial Transplant. 2003;18 Suppl 1(90001):i3–i6. doi: 10.1093/ndt/gfg1027.
- Josephson MA. Monitoring and managing graft health in the kidney transplant recipient. Clin J Am Soc Nephrol. 2011;6(7):1774–1780. doi: 10.2215/CJN.01230211.
- Freudenberger K, Hilbig U, Gauglitz G. Recent advances in therapeutic drug monitoring of immunosuppressive drugs. TrAC - Trends Anal Chem. 2016;79:257–268. doi: 10.1016/j.trac.2015.11.016.
- Urbschat A, Obermüller N, Haferkamp A. Biomarkers of kidney injury. Biomarkers. 2011;16(sup1):S22–S30. doi: 10.3109/1354750X.2011.587129.
- Peters B, Nasic S, Segelmark M. Clinical parameters predicting complications in native kidney biopsies. Clin Kidney J. 2021;13(4):654–659. doi: 10.1093/CKJ/SFZ132.
- Bedair M, Sumner LW. Current and emerging mass-spectrometry technologies for metabolomics. TrAC Trends Anal Chem. 2008;27(3):238–250. doi: 10.1016/j.trac.2008.01.006.
- Xiao L, Wang C, Dai C, et al. Untargeted tumor metabolomics with liquid chromatography–surface-enhanced raman spectroscopy. Angew Chem Int Ed. 2020;59(9):3439–3443. doi: 10.1002/anie.201912387.
- Gagnebin Y, Julien B, Belén P, et al. Metabolomics in chronic kidney disease: strategies for extended metabolome coverage. J Pharm Biomed Anal. 2018;161:313–325. doi: 10.1016/j.jpba.2018.08.046.
- Njoku K, Chiasserini D, Jones ER, et al. Urinary biomarkers and their potential for the non-Invasive detection of endometrial cancer. Front Oncol. 2020;10:559016. doi: 10.3389/fonc.2020.559016.
- Emwas AHM. The strengths and weaknesses of NMR spectroscopy and mass spectrometry with particular focus on metabolomics research. vol 1277. 2015. doi: 10.1007/978-1-4939-2377-9_13.
- Kim S, Kyung B, Gwon M, et al. Urinary metabolomic profiling for noninvasive diagnosis of acute T cell- mediated rejection after kidney transplantation. J Chromatogr B Analyt Technol Biomed Life Sci. 2019;1118-1119:157–163. doi: 10.1016/j.jchromb.2019.04.047.
- Gordon EJ, Gallant M, Sehgal AR, et al. Medication-taking among adult renal transplant recipients. Transpl Int. 2009;22(5):534–545. doi: 10.1111/j.1432-2277.2008.00827.x.Medication-taking.
- Kanda M, Murotani K, Tanaka H, et al. A novel dual-marker expression panel for easy and accurate risk stratification of patients with gastric cancer. Cancer Med. 2018;7(6):2463–2471. doi: 10.1002/cam4.1522.
- Manski CF, Tambur AR, Gmeiner M. Predicting kidney transplant outcomes with partial knowledge of HLA mismatch. Proc Natl Acad Sci U S A. 2019;116(41):20339–20345. doi: 10.1073/pnas.1911281116.
- Baek CH, Kim H, Baek SD, et al. Outcomes of living donor kidney transplantation in diabetic patients: age and sex matched comparison with non-diabetic patients. Korean J Intern Med. 2018;33(2):356–366. doi: 10.3904/kjim.2016.067.
- Rojas-Arzola J, Espinoza-Pérez L, Cruz-López R, et al. Kidney graft survival at a year, clinical evolution and associated factors in transplant patients with pre-existing diabetes. Trends Transplant. 2020;14:1–5. doi: 10.15761/tit.1000287.
- Sun Y, Cui S, Hou Y, et al. The updates of podocyte lipid metabolism in proteinuric kidney disease. Kidney Dis (Basel). 2021;7(6):438–451. doi: 10.1159/000518132.
- Blydt-Hansen TD, Sharma A, Gibson IW, et al. Urinary metabolomics for noninvasive detection of borderline and acute T cell-mediated rejection in children after kidney transplantation. Am J Transplant. 2014;14(10):2339–2349. doi: 10.1111/ajt.12837.
- McMillin JB, Dowhan W. Cardiolipin and apoptosis. Biochim Biophys Acta. 2002;1585(2-3):97–107. doi: 10.1016/S1388-1981(02)00329-3.
- Miranda-Díaz AG, Cardona-Muñoz EG, Pacheco-Moisés FP. The role of cardiolipin and mitochondrial damage in kidney transplant. Oxid Med Cell Longev. 2019;2019:3836186–3836113. doi: 10.1155/2019/3836186.
- Mallela SK, Merscher S, Fornoni A. Implications of sphingolipid metabolites in kidney diseases. Int J Mol Sci. 2022;23(8):4244. doi: 10.3390/ijms23084244.
- Mitrofanova A, Drexler Y, Merscher S, et al. Role of sphingolipid signaling in glomerular diseases: focus on DKD and FSGS. J Cell Signal. 2020;1(3):56–69. doi: 10.33696/signaling.1.013.
- Vinson AJ, Tennankore KK. Minding the missing link: the effect of donor-recipient pairing on kidney transplant outcomes. Clin J Am Soc Nephrol. 2018;13(10):1581–1583. doi: 10.2215/CJN.03730318.
- Park KM, Kim JI, Ahn Y, et al. Testosterone is responsible for enhanced susceptibility of males to ischemic renal injury. J Biol Chem. 2004;279(50):52282–52292. doi: 10.1074/jbc.M407629200.
- Kuczera P, Adamczak M, Wiecek A. Endocrine abnormalities in patients with chronic kidney disease. Pril (Makedon Akad Nauk Umet Odd Med Nauki). 2015;36(2):109–118. doi: 10.1515/prilozi-2015-0059.
- Lofaro D, Perri A, Aversa A, et al. Testosterone in renal transplant patients: effect on body composition and clinical parameters. J Nephrol. 2018;31(5):775–783. doi: 10.1007/s40620-018-0513-3.
- Reinhardt W, Kübber H, Dolff S, et al. Rapid recovery of hypogonadism in male patients with end stage renal disease after renal transplantation. Endocrine. 2018;60(1):159–166. doi: 10.1007/s12020-018-1543-2.
- Szypulska-koziarska D, Misiakiewicz-has K, Wiszniewska B. Hormonal (ım)balance and reproductive system’s disorders in transplant recipients—a review. Biology. 2021;10(4):271. doi: 10.3390/biology10040271.
- Colak H, Sert I, Kurtulmus Y, et al. The relation between serum testosterone levels and cardiovascular risk factors in patients with kidney transplantation and chronic kidney disease. Saudi J Kidney Dis Transpl. 2014;25(5):951–959. doi: 10.4103/1319-2442.139862.
- Grossmann M, Hoermann R, Ng Tang Fui M, et al. Sex steroids levels in chronic kidney disease and kidney transplant recipients: associations with disease severity and prediction of mortality. Clin Endocrinol (Oxf). 2015;82(5):767–775. doi: 10.1111/cen.12656.
- Pietrzak B, Bobrowska K, Jabiry-Zieniewicz Z, et al. Oral and transdermal hormonal contraception in women After kidney transplantation. Transplant Proc. 2007;39(9):2759–2762. doi: 10.1016/j.transproceed.2007.09.014.
- Hocher B, Adamski J. Metabolomics for clinical use and research in chronic kidney disease. Nat Rev Nephrol. 2017;13(5):269–284. doi: 10.1038/nrneph.2017.30.
- Piontek U, Wallaschofski H, Kastenmüller G, et al. Sex-specific metabolic profiles of androgens and its main binding protein SHBG in a Middle aged population without diabetes. Sci Rep. 2017;7(1):2235. doi: 10.1038/s41598-017-02367-y.
- Clayton P, McDonald S, Chadban S. Steroids and recurrent IgA nephropathy after kidney transplantation. Am J Transplant. 2011;11(8):1645–1649. doi: 10.1111/j.1600-6143.2011.03667.x.
- Moroni G, Longhi S, Quaglini S, et al. The long-term outcome of renal transplantation of IgA nephropathy and the impact of recurrence on graft survival. Nephrol Dial Transplant. 2013;28(5):1305–1314. doi: 10.1093/ndt/gfs472.
- Infante B, Rossini M, Di Lorenzo A, et al. Recurrence of immunoglobulin A nephropathy after kidney transplantation: a narrative review of the incidence, risk factors, pathophysiology and management of immunosuppressive therapy. Clin Kidney J. 2020;13(5):758–767. doi: 10.1093/CKJ/SFAA060.
- Mao Y y, Bai J Q, Chen J h, et al. A pilot study of GC/MS-based serum metabolic profiling of acute rejection in renal transplantation. Transpl Immunol. 2008;19(1):74–80. doi: 10.1016/j.trim.2008.01.006.
- He J, Yang M, Quan X, et al. Microbial and metabolic features in renal transplant recipients with post-transplantation diabetes mellitus. Int J Urol. 2023;30(6):504–513. doi: 10.1111/iju.15158.
- Dong H, Zhang S, Du W, et al. Pharmacodynamics and metabonomics study of tianma gouteng decoction for treatment of spontaneously hypertensive rats with liver-yang hyperactivity syndrome. J Ethnopharmacol. 2020;253:112661. doi: 10.1016/j.jep.2020.112661.
- Stadler K, Goldberg IJ, Susztak K. The evolving understanding of the contribution of lipid metabolism to diabetic kidney disease. Curr Diab Rep. 2015;15(7):40. doi: 10.1007/s11892-015-0611-8.
- Noels H, Lehrke M, Vanholder R, et al. Lipoproteins and fatty acids in chronic kidney disease: molecular and metabolic alterations. Nat Rev Nephrol. 2021;17(8):528–542. doi: 10.1038/s41581-021-00423-5.
- Mika A, Halinski LP, Sledzinski T, et al. Analysis of serum fatty acids profile in kidney transplant recipients. Nutrients. 2021;13(3):805. doi: 10.3390/nu13030805.
- Yan S, Yang XF, Liu HL, et al. Long-chain acyl-CoA synthetase in fatty acid metabolism involved in liver and other diseases: an update. World J Gastroenterol. 2015;21(12):3492–3498. doi: 10.3748/wjg.v21.i12.3492.
- Miller IJ, Peters SR, Overmyer KA, Paulson BR, Westphall MS, Coon JJ. Real-time health monitoring through urine metabolomics. Npj Digit Med. 2019;2. doi: 10.1038/s41746-019-0185-y.
- Mizuno H, Ueda K, Kobayashi Y, Tsuyama N, Todoroki K, Min JZ, et al. The great importance of normalization of LC–MS data for highly-accurate non-targeted metabolomics. Biomed Chromatogr. 2017;31:1–7. doi: 10.1002/bmc.3864.