
 ?Mathematical formulae have been encoded as MathML and are displayed in this HTML version using MathJax in order to improve their display. Uncheck the box to turn MathJax off. This feature requires Javascript. Click on a formula to zoom.
Abstract
Background
Citrate dialysate (CD) has been successfully used in conventional hemodialysis and continuous renal replacement therapy; however, no study has compared pre- and post-dilution online hemodiafiltration (oL-HDF). Therefore, we aimed to investigate the efficacy of citrate anticoagulation for oL-HDF and the metabolic changes and quality of life of patients on hemodialysis treated using both modes
Method
Eight dialysis patients were treated with CD containing 0.8 mmol of citric acid for 4 weeks in each phase. Visual clotting scores were investigated as the primary endpoints. Adequacy of dialysis, laboratory parameters, and quality of life were measured as secondary objectives.
Results
The mean clotting scores in the pre-dilution mode were significantly lower than those in the post-dilution mode and in all phases except the heparin-free phase (p < 0.001 in the baseline phase, p = 0.001 in phase 1, and p = 0.023 in phase 2). The values of Kt/V in both modalities were comparable except during the baseline phase, in which the values of pre-dilution were significantly greater than post-dilution (2.36 ± 0.52/week vs. 1.87 ± 0.33/week;95% CI −0.81 to −0.19, p = 0.002). The patient’s quality of life regarding their physical activity level was significantly higher in the post-dilution mode than in the pre-dilution mode at baseline and in phase 1 (p = 0.014 and 0.004 at baseline and in phase 1, respectively). Metabolic changes did not differ between the two modes.
Conclusion
Citrate dialysate decreased or prevented anticoagulation in both pre- and post-dilution modes of oL-HDF without significant side effects and had comparable adequacy of dialysis.
Introduction
Online hemodiafiltration (oL-HDF) is being increasingly used in patients undergoing chronic dialysis because of its improved convective clearance. The removal of large or protein-bound uremic retention solutes can be achieved, in addition to the excellent clearance of small molecules [Citation1]. Furthermore, oL-HDF has been associated with better hemodynamic tolerance and biocompatibility and may even result in better survival [Citation2] with reduction of proinflammatory cytokines [Citation3,Citation4] and circulating cells [Citation5], as well as better control of beta-2 microglobulin (β2-MG) levels [Citation6]. The oL-HDF is classified into two types according to the mode of addition of the substitution fluid: pre-dilution oL-HDF (pre-HDF) and post-dilution oL-HDF (post-HDF). Post-HDF is the most effective way to maximize molecule clearance, with higher removal rates of β2-MG and α1-microglobulin (α1-MG), albeit significantly higher albumin leakage, than hemodialysis (HD) and pre-HDF[Citation7]. However, a limitation of post-HDF is the intermittent hemoconcentration between the dialyzer and venous drip chamber, which can cause thrombosis. On the other hand, pre-HDF can resolve this problem [Citation8], but requires approximately three times more purified water than post-HDF and may not elicit maximal clearance.
Heparin is the most routinely used anticoagulant in hemodialysis (HD). Although the complication rates with heparin are low, certain complications such as bleeding and thrombocytopenia can occur. Furthermore, long-term use of heparin induces biological and clinical complications (osteoporosis, dyslipidemia, and hyperkalemia) [Citation9–11]. This has led to the exploration of alternative anticoagulants in patients with end-stage kidney disease (ESKD). Regional citrate anticoagulation is a good alternative to heparin use in HD for patients with increased bleeding risk [Citation12], but its implementation is cumbersome [Citation13,Citation14]. Citrate dialysate (CD) has proven to be a safe alternative to acetate-containing dialysate in dialysis without significant hypocalcemia or clinically important coagulation issues [Citation15–17]. Therefore, the present study aimed to compare the patency of the dialyzer, quality of life (QOL), and blood parameters between pre- and post-HDF CD patients. To date, no study has compared the use of CD between these two modalities in oL-HDF.
Materials and method
This trial was prospectively registered at ClinicalTrials.Gov Identifier: NCT05280106 (14/03/2022) and was approved by the Institutional Review Board of the Faculty of Medicine, Vajira Hospital,Navamindradhiraj University,Bangkok,Thailand (COA 080/64). The study was conducted in accordance with the Declaration of Helsinki and Good Clinical Practice guidelines, and all study methods were carried out in accordance with relevant guidelines and regulations. All patients who participated in the study signed an informed consent form before enrollment.
In this prospective one-group interrupted time series design (ITS), eight adult chronic dialysis patients (five women and three men) were already treated with HD at our dialysis unit three times per week. These included three men and five women; their mean age was 63.38 ± 17.00 years (range 38–86 years). These patients had been in a chronic HD program for a median of 8.05 years (range 3.12–14.7 years). The inclusion criteria were as follows: age 18–80 years, stable condition (normal blood pressure, no signs of infections, and no signs of other serious illnesses), and HD for at least 3 months. Vascular access should have a blood flow ≥ 300 mL/min. Exclusion criteria were no heparin use during HD, refusal to participate, intolerance or allergy to citrate, concurrent infection, poor life expectancy due to metastatic cancer, severe cirrhosis, hemorrhagic diseases, and acquired immunodeficiency syndrome (AIDS). Patients with vascular access modification, those affected by chronic liver disease, those with active neoplastic or inflammatory diseases, and those receiving immunosuppressives, anti-inflammatory drugs and calcimimetics were excluded.
The study was performed using a Fresenius 5008 dialysis machine (Fresenius Medical Care, Bad Homburg, Germany) or Nikkiso DBB-05 machine. All patients underwent HD three times per week for 4 h in each session using a high-flux polyester polymer alloy dialyzer with an effective surface area of 2.1 m2 (FDY21 GW, Nikkiso, Japan). The blood flow rate was maintained at 300–350 mL/min, individualized to the patient’s vascular access, to achieve an effective convection rate. The dialysate flow (Qd) rate was maintained at 500 mL/min. The dialysate sodium concentration was 140 mmol/L and bicarbonate concentration was 35 mmol/L. The heparin dose intradialysis ranged from 500 units in 4 h to 5,000 units at the maximum dosage and was carried out according to standard procedures continously throughout the dialysis session.Citrate acid concentrate contained 0.8 mmol of citric acid and 0 mmol of acetic acid; standard concentrate consisted of 3 mmol of acetic acid and 0 mmol of citrate. The dialysis prescription was aimed at obtaining effective convective exchanges of > 20 L/session. The CD contained 0.8 mmol/L citric acid and 1.25–3.5 mmol/L calcium (adjust according to the calcium levels of the patients). The dialysis fluid purity utilized in this study met the International Organization for Standardization criteria for ultrapure water and dialysate, indicated by total viable microbial counts of less than 0.1 colony forming units (CFU)/mL, and endotoxin concentrations of less than 0.03 EU/mL. The water and dialysate samples were tested monthly for biological contamination. Patients were not allowed to consume food or take antihypertensive medications during dialysis. Erythropoiesis stimulating agents (ESA) and iron were adjusted to keep the level of hemoglobin (Hb) in the range 10–13 g/dL, transferrin saturation more than 20%. Phosphate binders such as calcium carbonate and non-calcium based regimens were prescribed to keep serum calcium and phosphorus within normal limits. Vitamin D supplement was given to keep total vitamin D level more than 20 ng/mL.
The spKt/V was used to quantify dialysis adequacy using the second-generation single-pool Daugirdas formula (Kt/V = -ln (R-0.03) * [(4–3.5)* R) * (UF/W)], where R = post-dialysis blood urea nitrogen (BUN)/pre-dialysis BUN, UF = net ultrafiltration, W = weight, K = dialyzer clearance of urea, t = dialysis time, and V = patient’s total body water.
We also assessed QOL in both modalities using the short form of the Kidney Disease Quality of Life (KDQOL), that is, the KDQOL-short form (SF) [Citation18]. It is a self-report measure that includes an SF item health survey as the generic core and multi-item scales targeted on kidney disease and dialysis, including the burden of kidney disease, symptoms and problems with kidney disease, and effects of kidney disease. The KDQOL-SF can be split into generic and disease-specific parts. The domains of the SF-36 can be summarized in two summary scores: physical functioning (physical component summary [PCS]) and mental functioning (mental component summary [MCS]). The mean score of the general United States population was 50, with a standard deviation of 10 [Citation19]. The disease-specific part of the KDQOL-SF consisted of 44 kidney disease-targeted questions. The short KDQOL (KDQOL-SF™), currently version 1.3 [Citation18], consists of 36-item of SF-36 and 11 domains of the kidney disease-targeted domain including symptoms/problems (12 items), effects of kidney disease on daily life (8 items), burden of kidney disease (4 items), work status (2 items), cognitive function (3 items), quality of social interaction (3 items), sexual function (2 items), and sleep (4 items). It also included multi-item measures of social support (two items), dialysis staff encouragement (two items), and patient satisfaction (one item). These domains are scored from 0 to 100, with higher scores indicating an absence of problems [Citation19].
Study protocol
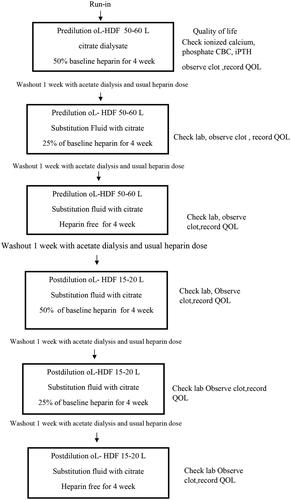
The study was conducted over a 29-week period in two phases. For the first 12 weeks, all patients were subjected to CD with pre-HDF. After enrollment, all patients began a 2-week run-in period with conventional intermittent hemodialysis (IHD) fluid containing acetate and the lowest dose of unfractionated heparin. We titrated the heparin dose by reducing the dose step-by-step and 25% in each step until the final minimal dose was achieved. The experimental study consisted of three phases, with four weeks in each phase, and the phases were separated by 1-week washout periods using online HDF. Phase 1 used CD with a 50% heparin dose at baseline. In phases 2 and 3, 25% heparin and no heparin were used, respectively. New dialyzers were introduced at the beginning of each phase and the heparin dose was resumed during the washout phase. The study design is illustrated in . The calcium concentration in the dialysis fluid was maintained at constant (1.5 mmol/L) to evaluate the effect of CD on calcium balance, followed by the same protocol with post-HDF in the same patients for the following 12 weeks.
Figure 1. Study flow chart.
In both modalities, we assessed QOL and the end of each phase and recorded the case record forms.
Data collection
Baseline clinical and laboratory parameters were determined at the beginning of the run-in period—the beginning of each treatment period (pre- and post-HDF period). Blood samples were collected to analyze the complete blood count, electrolytes, intact parathyroid hormone (iPTH), calcium, phosphorus, and albumin levels at the beginning of each phase. Ionized calcium (iCa) was measured pre- and post-HD in each session. The single-pool Kt/V was measured using the second-generation equation of the Daugirdas formula. The dialyzer clotting was assessed using the corrected visual scale adapted from Aniort et al. [Citation17] ().
Table 1. Restitutional clotting scale.
Quantification of dialysis dose
To compare the dialysis doses of the two online modalities, the effective convection volume normalized to a body-size-related factor was used as a surrogate marker [Citation20]. The effective convection volume is the total volume of the undiluted fluid that is ultrafiltered during treatment, including the fluid removed for weight loss. In post-HDF, the effective convection volume is equal to the total ultrafiltered volume, including weight loss. The ultrafiltration volume must be adjusted for the degree of dilution using a dilution factor (DF) that adjusts the effect of upstream infusion on the concentration of solute in the ultrafiltrate. The DF was calculated based on the total plasma water volume processed divided by the total non-erythrocyte water volume passed through the dialyzer (plasma water plus upstream infused fluid) as follows:
The protocrit is the volume fraction of plasma proteins, which can be calculated as the product of 0.000718 and the total protein concentration of plasma proteins in g/mL.
Calculating the UF rate to be used in pre-dilution
We planned to balance the effective convection flow rate (Qfeff) between pre- and post-dilution modes. We then calculated the ultrafiltration rate in pre-dilution (Qfpre) by multiplying by a factor of 1/DF such that Qfpre = Qfeff/DF. In pre-dilution HDF, the actual filtration rate needs to be at least 30–50% of the blood flow entering the dialyzer to achieve an effective convection rate of at least 20% of the undiluted blood flow rates.
Dialyzer reprocessing procedure
The dialyzer reprocessing procedure involved four steps: rinsing, cleaning, performance testing, disinfection, and sterilization. All steps were manually reused following the guidelines developed by the Association for the Advancement of Medical Instrumentation (AAMI):
The reprocessing area should be a separate area with good ventilation.
Return the blood using the machine’s blood pump and 0.9% normal saline. Air should not be allowed to enter the blood tubings or the dialyzer. Fill the circuit adding 1000 U of heparin to the saline before disconnecting it completely from the patient.
Remove the dialyzer and tubings from the machine and take to the reprocessing area in a covered tray to avoid blood spills. The tubings should be disconnected and the blood compartment of the dialyzer connected to the water source. The blood compartment should be rinsed with water till the effluent is clear.
Dialyzers should be labeled carefully and always used for the same patient. The external of the dialyzers should also be inspected that the caps are well tightly secured at both ends.
Clean by instilling 1% hypochlorite into the blood compartment till it is completely filled and allow the blood compartment to remain filled for up to two minutes. Immediately rinse out of the cleaning agent from the blood compartment.
The one end of the blood compartment is connected to the water supply, which is turned off, whereas the other end is left open. The one end of the dialysate compartment is capped, whereas the other is connected to a water supply with a pressure of 1–1.3 bar through a Hansen’s connector. The water should enter the dialysate compartment and exit through the blood compartment. The direction of flow should be reversed at five-minute intervals.
The dialyzer should be tested to make sure there are no broken fibers and it is still working.
The dialyzer is filled with peracetic acid
When the dialyzer is ready for use, paracetic acid is rinsed out.
The dialyzer is tested to make sure no germicide is left and the dialyzer can be used safely by measuring total cell volume (TCV), which should always be at least eighty percent compare to baseline according to the National Kidney Foundation’s Kidney Disease Outcomes Quality Initiative.
Clotting scores
The clotting scores were stratified according to the scales shown in .
Sample size calculation
For the study design with one dependent sample, a crossover study with the same group of patients with CD underwent pre- and post-dialysis [Citation21]. The main outcome was the clotting score for each of the five levels. If we used the clot score at 2 h with mean score = 4.3 (standard deviation [SD] = 0.7) and after HDF mean score = 4.0 (SD = 1.2), the effect size = 0.5, α = 0.05, β = 0.2 (power 0.8). The number of HDF was 35 sessions, calculated using program G Power 3.1.9.4.
Statistical analysis
Data are expressed as mean ± SD for normally distributed data and median (IQR) for non-normally distributed data. The difference between the two modalities at each time point was assessed using a paired t-test (normally distributed data) and Wilcoxon signed-rank test (not normally distributed data). Parametric tests were performed using the one-way Kolmogorov–Smirnov test. Repeated analysis of variance (ANOVA) was used if there were more than two independent variables. All p-values were one-tailed, and P-values less than 0.05 were considered to indicate statistical significance. The Friedman test was used to determine the effects of CD on the clotting score, QOL scores, and Kt/V in each phase. Differences were considered statistically significant at p < 0.05 (two-tailed test). All statistical tests were performed using the Statistical Package for the Social Sciences (IBM SPSS version 2).
Results
Patient characteristics
In total, 13 patients were recruited. Three were excluded owing to calcimimetic consumption, and the remaining 10 patients were enrolled. Eight patients completed the study, and two terminated the study prematurely due to death from sepsis. The baseline patient characteristics are shown in . The mean age of the patients was 68.38 ± 17.00 years. The etiologies of chronic kidney disease (CKD) included diabetes mellitus (n = 3), presumed chronic glomerulonephritis (n = 4), and IgA nephropathy (n = 1). The mean body mass index (BMI) was 23.43 ± 5.54 kg/m2. Nearly all patients (n = 6,75.00%) used native arteriovenous fistula (AVF), while two cases used perm catheters.
Table 2. Baseline characteristics.
Treatment characteristics between both modalities were comparable, except for substitution volume and Qfeff (). In pre-HDF, the mean substitution volume was 42.81 ± 5.06 L, while the volume was 18.27 ± 2.28 L in the post-dilution mode. Consequently, adding an ultrafilter volume to the substitution volume resulted in an effective convection volume. To achieve the target effective convection volume, the ultrafiltration rate in the pre-dilution mode must increase by a factor of 1/DF. The mean effective convection volume of pre-dilution was greater than in the post-dilution mode (23.06 ± 1.20 L vs. 20.60 ± 1.68 L, p = 0.002).
Table 3. Treatment characteristics.
Clotting scores
The mean clotting scores in the pre-dilution mode were significantly lower than those in the post-dilution mode in all phases, except in the heparin-free phase (p = 0.001 in phase 1 and p = 0.023 in phase 2). The clotting scores were 1.65 ± 0.27 in the pre-dilution baseline phase and increased to 1.88 ± 0.41 in phase 1, 2.10 ± 0.233 in phase 2, and 2.48 ± 0.27 in phase 3 (p < 0.01). The clotting scores in the post-dilution phases were 2.19 ± 0.46 at baseline, 2.32 ± 0.17 in phase 1, 2.42 ± 0.23 in phase 2, and 2.51 ± 0.18) in phase 3 (p = 0.167) (). Although the clotting score progressively increased from phase 1 to phase 3, and the number of dialyzer reuses significantly increased both in the pre- and post-dilution phases in the heparin-free phase (p < 0.001), the maximum scores were less than 25%, which can be reused effectively with acceptable adequacy of dialysis.
Table 4. Clotting scores in various phases in pre and postdilution oL-HDF.
Adequacy of dialysis
The values of Kt/V in both modalities were comparable except for the baseline phase, in which the values of pre-dilution were significantly greater than post-dilution mode (2.36 ± 0.52 vs. 1.87 ± 0.33;95% CI −0.81 to −0.19, p = 0.002) (). The Kt/V in heparin anticoagulation (baseline phase) was significantly higher than that in citrate anticoagulation in the predilution mode (p = 0.006), while there was no significant difference in the adequacy of dialysis in the postdilution mode between heparin and citrate anticoagulation (p = 0.610).
Table 5. Biochemical parameters, ESA doses, iron supplement per week, and reuse number of dialyzers after changing from acetate to citrate dialysate and reduce heparin in stepwise fashion.
Clinical and laboratory parameters
The laboratory evaluations in the two treatment periods are shown in , together with the adequacy of dialysis and ESA dosages.
Effect on anemia
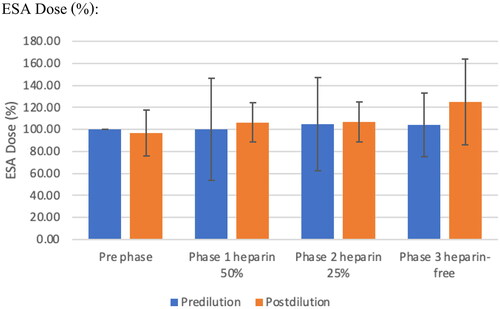
The mean hemoglobin and ESA doses were not significantly different in each and between pre- and post-protocol (). The median dose of ESA was not significantly different among the three study periods. Transferrin saturation (TSAT) declined from baseline to phase 1 in the pre-dilution mode (p = 0.004), but was not significantly different in the post-dilution mode. Serum ferritin increased progressively in the pre-dilution mode from baseline throughout Phase 2 and dropped in Phase 3 (601.48 ± 491, 20,803.25 ± 461.82, 611.88 ± 275 ng/mL in phases 1, 2, and 3, respectively, p = 090). The mean difference values of serum ferritin in phase 1 were significantly higher than in baseline in the pre-dilution mode (p = 0.041), and the values in the post-HDF group were significantly higher than in the pre-dilution mode in phase 1 (601.48 ± 491.20 ng/mL vs. 916.50 ± 748.54 ng/mL, p = 0.012). This corresponds to the administration of intravenous iron in six patients in the pre-dilution mode and five in the post-dilution mode ()
Figure 2. Comparison between erythrocyte stimulating agents dose between pre-and post- dilution online hemodiafiltration.
Calcium and phosphate balance and acid-base status
The baseline pre- and post-dilution levels of total serum calcium, ionized calcium, and iPTH were not significantly different between phases. The phosphorus levels in the post-dilution phase 1 were lower than in the pre-dilution mode and in the heparin-free phase (-2.05, 95% confidence interval [CI] − 3.12 to −0.98 absolute difference between the pre- and post-dilution in phase 1, p < 0.001 and −2.23, 95% CI −3.71 to −0.74 absolute difference compared to phase 3, p = 0.003 ().
Inflammatory cytokines
In both modes, there was no significant change in the levels of inflammatory cytokines (high-sensitivity C-reactive protein [hs-CRP] and interleukin [IL]-6) or across the HDF protocol or heparin phase, indicating no activation of the inflammatory cascade ().
Quality of life
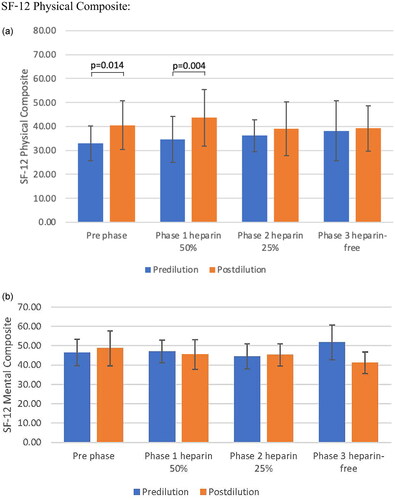
According to the KDQOL_SF v 1.3 scoring system, the mean scores of the items related to physical functioning (PCS) of the total study population were significantly higher in the post-dilution mode than in the pre-dilution mode both at baseline and phase 1 (p = 0.014 and 0.004 at baseline and phase 1, respectively). The mean scores of the KDQOL-SF-12 were not far from the mean score of 50, as mentioned previously [Citation22]. The mental component summary (MCS) was comparable between the pre- and post-dilution modes but declined significantly in phase 3 of the post-dilution mode compared with baseline (p = 0.006 in phase 1 and p < 0.001 in phase 2) ().
Figure 3. Mental component summary (MCS) and physical component summary (PCS) are comparable between pre and post-dilution mode A: Physical component B: Mental component Comparison between erythrocyte stimulating agents between pre- and post- dilution online hemodiafiltration
For subdomain scores, the mean of the scores of the item related to the ‘symptoms and problem’ list of the post-dilution at baseline was 82.29 ± 11.99 and 84.64 ± 9.89 in phase 1, respectively, which was nearly the maximum possible score of 100 for the least symptoms and problems. The mean scores in the post-dilution mode were greater than in the pre-dilution mode in this item as well as other items such as ‘burden of kidney diseases’, quality of social interaction’, ‘sleep’, ‘social interaction’, ‘emotional well-being’, ‘social-function’, ‘physical functioning’, and ‘energy’ except for ‘cognitive function’, in which the pre-dilution mode was greater in the post-dilution mode. On the other hand, the mean scores of the items dealing with ‘work status’, ‘physical function’, and ‘burden of kidney disease’ were very low (31.25 ± 25.88, 25.00 ± 29.28, and 6.25 ± 11.57, respectively, at baseline), indicating high age in this group of patients and poor physical function at baseline ().
Table 6. KDQOL-SF-12 physical /mental composite score.
Discussion
Recent evidence shows that the clinical benefits of HDF are directly correlated to the excellent combination of diffusive solute transport and the high clearances for larger uremic toxins, the so-called middle molecules. The advantage of this combination is that HDF is superior to conventional HD with respect to uremic toxin removal [Citation23].
However, the main limiting factor for HDF is clotting in the extracorporeal circuit.
The post-dilution mode, that is, the substitution fluid administered after the dialyzer, increases the clearance compared with HD for both small and large uremic toxins. A limitation of post-HDF is the hemoconcentration between the dialyzer and the venous drip chamber. In the predilution mode, that is, replacement before the dialyzer will have plasma dilution, which may affect the overall efficiency of the clearance, while clotting is less than post-dilution.
Normally, unfractionated heparin and low-molecular-weight heparin are used as anticoagulants. However, anticoagulant use is limited by the risk of bleeding. Another technique to limit thrombosis in the extracorporeal circuit is regional citrate anticoagulation or CD, which has shown promising results in previous studies [Citation24,Citation25].
In this study, pre-dilution had less extracorporeal circuit clotting than post-dilution mode at baseline through phase 2. This phenomenon was not surprising, as it corresponds to the characteristics of pre-versus post-HDF [Citation26,Citation27]. The clotting scores significantly increased in the post-dilution mode compared to the pre- dilution mode, with a maximum value of less than 3. We previously reported that citrate eliminates the need for heparin during HD [Citation25] but does not prolong the circuit life span in continuous venovenous hemodiafiltration in the post-dilution mode [Citation24]. Previous studies have suggested that some clotting occurs during HD or continuous renal replacement therapy and that citrate can attenuate the need for heparin [Citation28,Citation29] but not abolish it entirely. One study from pediatric cohorts under pre-HDF divided into acetate and citrate phases observed no difference in clotting episodes and clearance between the periods [Citation30]. Aniort et al. safely used CD post-HDF and were able to remove heparin in most patients [Citation17]. Richtrova et al. performed a study using citrate in pre-HDF to successfully eliminate heparin. Dialysis adequacy declined significantly in the citrate group compared with the acetate group [Citation31]. In our study, a citrate-based dialysis solution enabled heparin dose tapering or even complete exclusion, both in pre- and post-HDF, without compromising the adequacy of dialysis as quantified by spKt/V. The spKt/V in post-dilution was not significantly different between the pre- and post-dilution modes. The effective convective volume in our study was significantly higher during pre-dilution. Notably, citrate can be feasibly used both pre- and post-HDF. However, at 300 mL/min, blood flow, as performed in this study, the pre-dilution mode would lead to less thrombogenesis. Special attention should be paid to the heparin-free phase because the number of maximum reused dialyzers increased in that phase, especially in the post-dilution mode.
Previous reports have also indicated that citrate reduced iCa levels at the end of the session [Citation15, Citation32]. In the study by Ortiz et al. citrate produced less post-dialysis alkalemia, significantly modified Ca, Mg, and PTH levels, and had a positive impact on hemodynamic tolerance in patients on maintenance HD. Our study did not find any electrolyte abnormalities or calcium phosphate derangements during the oL-HDF with citrate. The ionized calcium levels were stable throughout the study period. The anticoagulant effect of citrate in this study, despite the stable iCa level, may be due to its adequate anticoagulant effect. The stable iCa2 level in this study may be due to the difference in the diffusible calcium gradient (free calcium + calcium chelated by citrate), which allows calcium to be transferred from the dialysate to the patient. Citrate-chelated calcium is released during the metabolism of citrate to bicarbonate in the liver [Citation25].
Considering the effect of citrate on anemia, stability of plasma hemoglobin and a decrease in the erythropoietin resistance index were found in a recent report [Citation17]. We previously showed that citrate dialysate stabilized the mean hemoglobin levels during different heparin reduction phases in conventional HD [Citation25]. The iron status was also maintained, except in post-dilution phase 1, which corresponds to iron supplements in this group of patients at that time. Our findings provided some evidence that although heparin reduction during CD was associated with a slight increase in the clotting score, hemoglobin levels were maintained, and no effects of CD on anemia were found. This could be explained by adequate iron storage and the adjustment of ESA doses according to the Hb levels of the patients to maintain Hb within acceptable ranges.
Our data also showed that CD produced similar levels of inflammatory markers as acetate. IL-6 and hs-CRP levels were not elevated during any phase of CD. This is in accordance with previous reports by Nunez et al. who reported lower inflammatory parameters, that is, CRP and β2-MG using CD [Citation33]. These results are not attributable to dialysis technology (oL-HDF) and may suggest a potential biological effect of citrate on the CKD-associated inflammatory state [Citation34].
The goal of RRT in patients with ESKD is not only to improve patient survival but also to achieve well-being [Citation35]. This study evaluated physical, emotional, and social functions, and treatment effectiveness using multidimensional measurements, including generic and disease-specific instruments. [Citation36]. The physical domain includes three subscales, namely, physical function, role limitation due to physical function, and bodily pain. In previous studies, this domain has been reported to be a significant predictor of both death and hospitalization [Citation37]. In the current study, each of the three subscales of the physical domain had a score below an average of 50 in the predilution mode, which was inferior to post-dilution, suggesting that post-HDF itself has an impact on performance. This is in agreement with the higher kT/V values in post-dilution than in pre-dilution, although the difference was not statistically significant in phase 1–3. This finding emphasizes the positive impact of dialysis adequacy on QOL. Hasan et al. reported a positive association between the adequacy of dialysis using Kt/V and health-related quality of life (HRQOL) [Citation38], while some showed no significant association [Citation39]. On the other hand, the mental domain includes social function and role limitation due to mental and general mental health being better in the post-dilution mode, especially at baseline and Phase 1. The scores for almost all the subscales in the present study were above 50. The sleep scores were also better post-dilution, which may be the consequence of the better adequacy of dialysis in that mode.
Although overall health was not different between the two treatment groups, patient satisfaction was greater after post-dilution. CD had no effect on the physical domain, except for the role-limit subscale, in which the scores dropped in the heparin-free phase. The mental domain sub-scores declined progressively as heparin was curtailed. The patients denied answering sex-related questions. This may be due to embarrassment in traditional Thai culture and the high mean age of patients.
This trial has many strengths, including a comparison between pre- and post-dilution, which has rarely been reported previously. Additionally, an assumption to avoid heparin use was developed for both modalities. We designed the trial as a step-down of the heparin dose in a gradual framework. We explored the potential impact of dialysis modalities for CD on different parameters, including laboratory data, adequacy of dialysis, and QOL. Another advantage is the paired comparisons of various variables between both modalities in every step of heparin reduction, which could envision the benefits of improving the selection of the appropriate doses of heparin.
Our study has some limitations. First, we recruited a limited number of patients for the study. Second, the duration of follow-up was only three months, and long-term clinical and laboratory results were lacking. This study did not use a randomized-controlled or crossover design, and the cumulative effect of the pre-dilution oL-HDF on parameters such as quality of life cannot be ruled out. Further well-designed studies with a greater number of participants and longer follow-up periods are required to establish the beneficial effects of CD on oL-HDF.
In conclusion, citrate can be safely used both pre- and post-HDF. In patients with a limited blood flow rate of < 300 mL/min, the pre-dilution mode with CD is recommended. Moreover, heparin can be avoided without excessive clotting and yields comparable adequacy of dialysis, as well as maintaining calcium-phosphorus metabolism and hematologic profile. The post-dilution QOL was significantly better than the pre-dilution QOL in the physical domain. Overall health was not affected by CD or heparin reduction. Therefore, CD could be an appropriate alternative anticoagulant for oL-HDF in patients on chronic HD.
Authors’ contributions
TT supervised the project, interpreted the data, contributed to the writing of the manuscript, had full access to the data in the study, and contributed to the study design. PN contributed to data collection and conceived and designed the study. KM and MH conducted the study and collected the data. All authors have approved the final version of the manuscript for submission.
Supplemental Material
Download PDF (264.7 KB)Acknowledgement
The authors thank all staff and investigators involved in this study and Ms. Worachanee Imjaijit for her statistical analyses.This manuscript has been published as a preprint version in Research Square https://doi.org/10.21203/rs.3.rs-2536555/v1. The authors thank Editage (www.editage.com) for English language editing.
Disclosure statement
No potential conflict of interest was reported by the author(s).
Data availability statement
Data supporting the findings of this study are available from the corresponding author. Data supporting the findings of this study are openly available in ‘figshare’ at http://10.6084/m9.figshare.21971570.
Additional information
Funding
References
- Canaud B, Bosc JY, Leray H, et al. On-line haemodiafiltration: state of the art. Nephrol Dial Transplant. 1998;13(90005):1–13. doi:10.1093/ndt/13.suppl_5.3.
- Canaud B, Bragg-Gresham JL, Marshall MR, et al. Mortality risk for patients receiving hemodiafiltration versus hemodialysis: european results from the DOPPS. Kidney Int. 2006;69(11):2087–2093. doi:10.1038/sj.ki.5000447.
- Guth HJ, Gruska S, Kraatz G. On-line production of ultrapure substitution fluid reduces TNF-alpha- and IL-6 release in patients on hemodiafiltration therapy. Int J Artif Organs. 2003;26(3):181–187. doi:10.1177/039139880302600301.
- Canaud B, Wizemann V, Pizzarelli F, et al. Cellular interleukin-1 receptor antagonist production in patients receiving on-line haemodiafiltration therapy. Nephrol Dial Transplant. 2001;16(11):2181–2187. doi:10.1093/ndt/16.11.2181.
- Carracedo J, Merino A, Nogueras S, et al. On-line hemodiafiltration reduces the proinflammatory CD14 + CD16+ monocyte-derived dendritic cells: a prospective, crossover study. J Am Soc Nephrol. 2006;17(8):2315–2321. doi:10.1681/ASN.2006020105.
- Lin CL, Yang CW, Chiang CC, et al. Long-term on-line hemodiafiltration reduces predialysis beta-2-microglobulin levels in chronic hemodialysis patients. Blood Purif. 2001;19(3):301–307. doi:10.1159/000046958.
- Kurihara Y, Hosoya H, Kishihara R, et al. Comparison of the effects of pre-dilution and post-dilution online hemodiafiltration on the levels of inflammatory markers, lymphocytes, and platelets. J Artif Organs. 2022;25(1):59–65. doi:10.1007/s10047-021-01281-5.
- Tsuchida K, Minakuchi J. Clinical benefits of predilution on-line hemodiafiltration. Blood Purif. 2013;35 (Suppl 1):18–22. doi:10.1159/000346221.
- Hottelart C, Achard JM, Moriniere P, et al. Heparin-induced hyperkalemia in chronic hemodialysis patients: comparison of low molecular weight and unfractionated heparin. Artif Organs. 1998;22(7):614–617. doi:10.1046/j.1525-1594.1998.06204.x.
- Mahmood D, Grubbström M, Lundberg LDI, et al. Lipoprotein lipase responds similarly to tinzaparin as to conventional heparin during hemodialysis. BMC Nephrol. 2010;11(1):33. doi:10.1186/1471-2369-11-33.
- Nelson-Piercy C. Heparin-induced osteoporosis. Scand J Rheumatol Suppl. 1998;107:68–71. doi:10.1080/03009742.1998.11720769.
- Evenepoel P, Maes B, Vanwalleghem J, et al. Regional citrate anticoagulation for hemodialysis using a conventional calcium-containing dialysate. Am J Kidney Dis. 2002;39(2):315–323. doi:10.1053/ajkd.2002.30551.
- Kelleher SP, Schulman G. Severe metabolic alkalosis complicating regional citrate hemodialysis. Am J Kidney Dis. 1987;9(3):235–236. doi:10.1016/s0272-6386(87)80061-6.
- Silverstein FJ, Oster JR, Perez G,O, et al. Metabolic alkalosis induced by regional citrate hemodialysis. ASAIO Trans. 1989;35:22–25.
- Grundström G, Christensson A, Alquist M, et al. Replacement of acetate with citrate in dialysis fluid: a randomized clinical trial of short-term safety and fluid biocompatibility. BMC Nephrol. 2013;14(1):216. doi:10.1186/1471-2369-14-216.
- Panichi V, Fiaccadori E, Rosati A, et al. Postdilution on-line haemodiafiltration with citrate dialysate: first clinical experience in chronic dialysis patients. ScientificWorldJournal. 2013;2013:703612–703617. doi:10.1155/2013/703612.
- Aniort J, Petitclerc T, Créput C. Safe use of citric acid-based dialysate and heparin removal in postdilution online hemodiafiltration. Blood Purif. 2012;34(3-4):336–343. doi:10.1159/000345342.
- Hays RD, Kallich JD, Mapes DL, et al. Kidney disease quality of life short form (KDQOL-SFTM), vversion 1.3: a manual for use and scoring. Santa Monica, CA, RAND Corporation, 1997).
- Ware JE, Keller SD, Kosinski M. SF-36 physical and mental health summary scales: health Assessment Lab Boston 1994).
- Tattersall JE, Ward RA, EUDIAL group. Online haemodiafiltration: definition, dose quantification and safety revisited. Nephrol Dial Transplant. 2013;28(3):542–550. Epub 2013 Jan 22. PMID: 23345621. doi:10.1093/ndt/gfs530.
- Buturovic-Ponikvar J, Gubensek J, Ponikvar R. Citrate anticoagulation for postdilution online hemodialfiltration with calcium-containing dialysate and infusate: significant clotting in the venous bubble trap. Int J Artif Organs. 2008;31(4):323–328. doi:10.1177/039139880803100408.
- Peipert JD, Bentler PM, Klicko K, et al. Psychometric properties of the kidney disease quality of life 36-item short-form survey (KDQOL-36) in the United States. Am J Kidney Dis. 2018;71(4):461–468. doi:10.1053/j.ajkd.2017.07.020.
- Wizemann V. Hemodiafiltration – an avenue to shorter dialysis?. Contrib nephrol. Basel, Karger. 44, 49–56. 1985).
- Trakarnvanich T, Sirivongrangson P, Trongtrakul K, et al. The effect of citrate in cardiovascular system and clot circuit in critically ill patients requiring continuous renal replacement therapy. J Artif Organs. 2022;26(1):53–64. doi:10.1007/s10047-022-01329-0.
- Trakarnvanich T, Thirathanakul S, Sriphueng N, et al. The effect of citrate on clot formation, dialyzer reuse, and anemia in hemodialysis patients. Blood Purif. 2019;47(4):361–368. doi:10.1159/000495025.
- Uchino S, Fealy N, Baldwin I, et al. Pre-dilution vs post-dilution during continuous venovenous hemofiltration: impact on filter life and azotemic control. Nephron Clin Pract. 2003;94(4):c94–c98. doi:10.1159/000072492.
- Van der Voort PH, Gerritsen RT, Kuiper MA, et al. Filter run time in CVVH: pre-versus postdilution and nadroparin versus regional heparin-protamine anticoagulation. Blood Purif. 2005;23(3):175–180. doi:10.1159/000083938.
- Brain MJ, Roodenburg OS, Adams N, et al. Randomised trial of software algorithm driven regional citrate anticoagulation versus heparin in continuous renal replacement therapy: the filter life in renal replacement therapy pilot trial. Crit Care Resusc. 2014;16(2):131–142. doi:10.1016/S1441-2772(23)01454-0.
- Schmitz M, Loke O, Fach B, et al. Effects of citrate dialysate in chronic dialysis: a multicentre randomized crossover study. Nephrol Dial Transplant. 2016;31(8):1327–1334. doi:10.1093/ndt/gfv347.
- Quinaux T, Pongas M, Guissard É, et al. Comparison between citrate and acetate dialysate in chronic online hemodiafiltration: a short-term prospective study in pediatric settings. Nephrol Ther. 2020;16(3):158–163. doi:10.1016/j.nephro.2019.12.002.
- Richtrova P, Mares J, Kielberger L, et al. Citrate-buffered dialysis solution (citrasate) allows avoidance of anticoagulation during intermittent hemodiafiltration-at the cost of decreased performance and systemic biocompatibility. Artif Organs. 2017;41(8):759–766. doi:10.1111/aor.12851.
- Šafránek R, Moučka P, Vávrová J, et al. Changes of serum calcium, magnesium and parathyroid hormone induced by hemodialysis with citrateenriched dialysis solution. Kidney Blood Press Res. 2015;40(1):13–21. doi:10.1159/000368478.
- Molina Nuñez M, de Alarcón R, Roca S, et al. Citrate versus acetate-based dialysate in on-line haemodiafiltration. A prospective cross-over study. Blood Purif. 2015;39(1-3):181–187. doi:10.1159/000371569.
- Pizzarelli F, Cantaluppi V, Panichi V, et al. Citrate high volume on-line hemodiafiltration modulates serum interleukin-6 and klotho levels: the multicenter randomized controlled study "hephaestus. J Nephrol. 2021;34(5):1701–1710. doi:10.1007/s40620-020-00943-6.
- Kimmel PL, Patel SS. Quality of life in patients with chronic kidney disease: focus on end-stage renal disease treated with hemodialysis. Semin Nephrol. 2006;26(1):68–79. doi:10.1016/j.semnephrol.2005.06.015.
- ElHafeez SA, Sallam SA, Gad ZM, et al. Cultural adaptation and validation of the “kidney disease and quality of life-short form (KDQOL-SF™) version 1.3” questionnaire in Egypt. BMC Nephrol. 2012;13(1):170. doi:10.1186/1471-2369-13-170.
- DeOreo PB. Hemodialysis patient-assessed functional health status predicts continued survival, hospitalization, and dialysis-attendance compliance. Am J Kidney Dis. 1997;30(2):204–212. doi:10.1016/s0272-6386(97)90053-6.
- Hasan LM, Shaheen DAH, El Kannishy GAH, et al. Is health-related quality of life associated with adequacy of hemodialysis in chronic kidney disease patients? BMC Nephrol. 2021;22(1):334. doi:10.1186/s12882-021-02539-z.
- Merkus MP, Jager KJ, Dekker FW, et al. Quality of life in patients on chronic dialysis: self-assessment 3 months after the start of treatment. Am J Kidney Dis. 1997;29(4):584–592. doi:10.1016/S0272-6386(97)90342-5.