
Abstract
Objective
We conducted a community-based cohort study to predict the 3-year occurrence of chronic kidney disease (CKD) among population aged ≥60 years.
Method
Participants were selected from two communities through randomized cluster sampling in Jiading District of Shanghai, China. The two communities were randomly divided into a development cohort (n = 12012) and a validation cohort (n = 6248) with a 3-year follow-up. Logistic regression analysis was used to determine the independent predictors. A nomogram was established to predict the occurrence of CKD within 3 years. The area under the curve (AUC), the calibration curve and decision curve analysis (DCA) curve were used to evaluate the model.
Result
At baseline, participants in development cohort and validation cohort were with the mean age of 68.24 ± 5.87 and 67.68 ± 5.26 years old, respectively. During 3 years, 1516 (12.6%) and 544 (8.9%) new cases developed CKD in the development and validation cohorts, respectively. Nine variables (age, systolic blood pressure, body mass index, exercise, previous hypertension, triglycerides, fasting plasma glucose, glycated hemoglobin and serum creatinine) were included in the prediction model. The AUC value was 0.742 [95% confidence interval (CI), 0.728–0.756] in the development cohort and 0.881(95%CI, 0.867–0.895) in the validation cohort, respectively. The calibration curves and DCA curves demonstrate an effective predictive model.
Conclusion
Our nomogram model is a simple, reasonable and reliable tool for predicting the risk of 3-year CKD in community-dwelling elderly people, which is helpful for timely intervention and reducing the incidence of CKD.
Introduction
Chronic kidney disease (CKD) is a progressive condition in which the kidneys do not work normally and can cause serious problems for health [Citation1]. CKD has five stages (G1–G5), and progression can eventually lead to kidney failure, also known as end-stage renal disease (ESRD). Currently, the global prevalence of CKD is relatively high and is rapidly increasing, ranging from 11% to 13%, most of which are in stage G3 [Citation2]. It is expected that CKD will become the fifth leading cause of death worldwide by 2024 [Citation3]. CKD affects 120 million Chinese adults and is associated with the increased morbidity and mortality [Citation4]. CKD is increasingly recognized as a global public health problem associated with an 8- to 10-fold increase in cardiovascular mortality and a risk multiplier in patients with diabetes mellitus (DM) and hypertension [Citation5]. A reduction in the estimated glomerular filtration rate (eGFR) is associated with an increased incidence of cardiovascular disease and hospitalization risk in a community-based population [Citation6]. Therefore, the application of risk prediction models is crucial for the primary prevention of CKD, which can stratify the risk of developing CKD and identify high-risk individuals for more intensive interventions [Citation7,Citation8].
To date, more than 20 risk prediction models for CKD have been developed worldwide and four of them have been developed for the Chinese population: ‘Chien Model’ in 2010 [Citation9], ‘Taiwan MJ Model’ in 2013 [Citation10], ‘Handan Model’ in 2020 [Citation11] and ‘Shanghai Perk Model’ in 2021 [Citation12], details of these four models were presented in Supplement Figure S1. Briefly, the existing models can predict the occurrence of CKD among particular participants, but they also have some limitations in terms of outcome definition, predictors, strategies for handling missing data, or model derivation [Citation9–12].
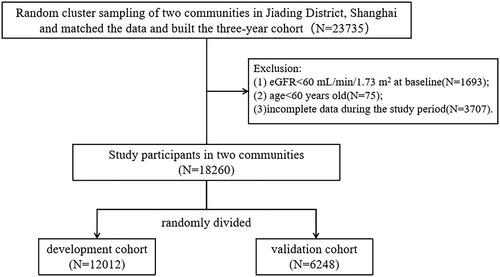
Figure 1. Flow chart of study design and participants.
Abbreviations: eGFR, estimated glomerular filtration rate.
As the economic center in China, Shanghai stands at the forefront of national strategic initiatives and responds quickly to economic reform and health promotion policies. We selected Jiading district of Shanghai as a study district based on the following reasons. First, Jiading District, one of the five new towns in Shanghai, is an important district in boosting Shanghai’s development of science and technology due to its automobile manufacturing industry. Second, residents in Jiading, rather than in Shanghai, have been relatively complex in recent decades, with a high frequency of immigration influx or efflux. Third, predictive models of CKD evaluated in a complicated population may provide a study for something more representative view of the international community.
In the present study, we developed a nomogram model to predict the 3-year occurrence of CKD based on independent factors in the elderly population of the Chinese community. This study may help in improving CKD control strategies in other countries, especially in low- and middle-income countries, as well as help community physicians identify high-risk individuals and provide scientific recommendations for the primary prevention of CKD.
Material and methods
Participants
Participants were selected from two communities through randomized cluster sampling in the Jiading District of Shanghai, China. The two communities were randomly divided into a development cohort (n = 12012) and a validation cohort (n = 6248), with a 3-year follow-up. A three-year community CKD prediction model was built using the development cohort among Anting community population between May 1, 2014 and December 31, 2020. The validation cohort was drawn from the population in Nanxiang community between January 1, 2019 and December 31, 2022, and it was used to evaluate the predictive power of the established model ().
According to the Kidney Disease Improving Global Outcomes (KDIGO) classification, all participants in stages G1 and G2 CKD were included in the study. The endpoint was CKD incident, defined as incident eGFR < 60 mL/min/1.73 m2 during three-year follow-up period [Citation1]. Participants who met the following criteria were excluded: eGFR < 60 mL/min/1.73 m2 at baseline; age < 60 years; incomplete data during the study period. Sensitivity analysis was performed to test the consistency of CKD evaluation. Participants who had the data of eGFR repeated at least three times independently within 3-year followup were included in the sensitivity analysis (N = 11306). If eGFR < 60 mL/min/1.73 m2 reoccurred after the first occurrence during the follow-up period, we confirmed CKD occurred. The kappa value is equal to 0.70, indicating a relatively high degree of consistency in our study.
This study was approved by the Medical Ethics Committee of Tongji University School of Medicine (Ethics number:2020tjdx068), and written informed consent was obtained from all the participants.
Sociodemographic and anthropometric data
Sociodemographic data, including sex, age, nationality and physical exercise, were collected at baseline. History of diseases and medications was recorded through self-report, including hypertension, diabetes and cancer, and medication status including taking antihypertensive drugs, antidiabetic drugs and lipid-lowering drugs.
Data on height, weight, body mass index (BMI), systolic blood pressure (SBP) and diastolic blood pressure (DBP) were obtained through physical examinations. Venous blood samples and urine samples were obtained from fasting individuals in the morning. Biological markers, including red blood cell (RBC) count, white blood cell (WBC) count, platelet (PLT) count, hemoglobin (Hb), total cholesterol (TC), triglycerides (TG), low-density lipoprotein cholesterol (LDL-C), high-density lipoprotein cholesterol (HDL-C), aspartate aminotransferase (AST), alanine aminotransferase (ALT), fasting plasma glucose (FPG), glycated hemoglobin (HbAlc), total bilirubin (TBil), uric acid (UA) and serum creatinine (Scr), were measured by uniformed methods in the Department of Laboratory Medicine of Shanghai Jiading District Central Hospital.
Definitions
eGFR was calculated using the CKD-EPI formula, which is more suitable for Chinese people, according to age, sex and serum creatinine [Citation13]. Hypertension was defined as not using antihypertensive drugs, SBP ≥ 140 mmHg, and/or DBP ≥ 90 mmHg, or having a history of hypertension and taking antihypertensive drugs [Citation14]. Diabetes was defined as fasting blood glucose ≥ 7.0 mmol/L and/or a clear history of diabetes or taking antidiabetics drugs [Citation15]. Exercise was classified by the number of times the weekly moderate intensity exercise was more than 30 minutes [Citation16]. Less than three times a week is considered insufficient activity, and more than or equal to three times a week is considered regular exercise, corresponding to ‘No’ and ‘Yes’, respectively.
Statistical analysis
Continuous variables are expressed as mean and standard deviation (mean ± SD) and compared using an unpaired two-tailed t-test. Categorical variables are expressed as cases and percentages (n, %) and compared using the chi-square test.
A logistic regression model was used to screen for the independent factors of CKD in the development cohort. Significant variables from the univariate logistic regression analysis were then included in multivariate logistic regression. After screening for collinearity, we determined the final predictors based on previous reports and the clinical significance of these variables. These variables were classified and assigned according to the current standards and guidelines in China [Citation14,Citation15, Citation17,Citation18]. Serum creatinine level was divided into normal high and normal low values according to the median of the normal range [Citation19]. A predictive nomogram was constructed using the rms package of the R software. Based on the nomogram model, a detailed score table of influencing factors was obtained.
The nomogram was evaluated in both development and validation cohorts. Receiver operating characteristic (ROC) curves, calibration curves, and decision curve analysis (DCA) were used to validate the prediction model. The AUC of the ROC curve was used to estimate the discriminative ability of our model. The calibration curve determined whether the prediction is in good agreement with the actual situation. The DCA curve determined the clinical value of our model and visualized its potential net benefits. The horizontal curve indicates that all samples are negative, no one intervened, and the net benefit rate is 0. The diagonal curve indicates that all samples are positive, everyone has received intervention, and the net benefit rate is a negative slope. If the net profit of the DCA curve is higher than that of the extreme curve, it indicates that the DCA curve has certain application value [Citation20].
All statistical tests were two-tailed, and a P value less than 0.05 was considered statistically significant. All analyses were conducted using Stata 15.0 and R 4.2.2.
Results
Population characteristics
Total 12012 participants were included at baseline in the development cohort, with a mean age of 68.24 ± 5.87 years old, including 5275 hypertension patients (43.91%) and 1214 diabetes patients (10.11%). Total 6248 participants were enrolled in the validation cohort, with a mean age of 67.68 ± 5.26 years old, including 3290 hypertension patients and 763 diabetes patients, representing 52.66% and 12.21%. During the follow-up period, 1516 (12.6%) and 544 (10.3%) new cases developed CKD in the development and validation cohorts, respectively.
Baseline characteristics of the development cohort are presented in . Briefly, compared to those who had no CKD, participants who developed CKD were older and less likely to enjoy exercise. They were more likely to have hypertension and diabetes and to take antihypertensive and antidiabetic drugs. Patients with CKD had higher levels of SBP, BMI, RBC, WBC, TG, ALT, AST, FPG, HbAlc, UA, and Scr, but lower levels of PLT, Hb, TC, and HDL-C at baseline (All p < 0.05). There were no significant differences in sex, DBP, lipid-lowering drugs, LDL-C, and TBil between the non-CKD and CKD groups at baseline (All p > 0.05). Other details of the differences between the two groups are shown in . The baseline characteristics of the validation cohort are presented in Supplement Table S1.
Table 1. Baseline characteristics of participants with and without follow-up chronic kidney disease (CKD) in the development cohort (N = 12012).
Logistic regression to determine independent factors of CKD
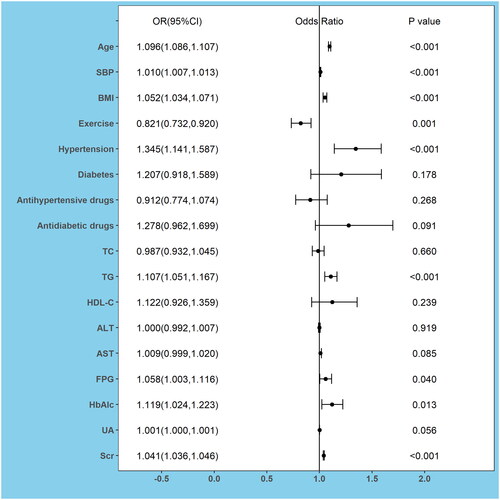
Significant variables including age, SBP, BMI, exercise, hypertension, diabetes, antihypertensive drugs, antidiabetic drugs, TC, TG, HDL-C, ALT, AST, FPG, HbAlc, UA, and Scr in the univariable logistic regression analysis (Supplement Table S2) were selected in the multivariable logistic regression model, which was used to explore the independent factors related to the risk of CKD. Odds ratios (OR) and 95% confidence intervals (CI) are shown in . Age (OR: 1.096, 95%CI: 1.086 to 1.107), SBP (OR: 1.010, 95%CI: 1.007 to 1.013), BMI (OR: 1.052, 95%CI: 1.034 to 1.071), hypertension (OR: 1.345, 95%CI: 1.141 to 1.587), TG (OR: 1.107, 95%CI: 1.051 to 1.167), FPG (OR: 1.058, 95%CI: 1.003 to 1.116), HbAlc (OR: 1.119, 95%CI: 1.024 to 1.223) and Scr (OR: 1.041, 95%CI: 1.036 to 1.046) were independent risk factors for CKD, while only exercise(OR: 0.821, 95%CI: 0.732 to 0.920) was protective factors for CKD.
Figure 2. Forest Plots of factors of chronic kidney disease (CKD) were analyzed by multivariable logistic analysis in the development cohort.
Abbreviations: OR, odds ratio; 95% CI, 95% confidence interval; SBP, systolic blood pressure; BMI, body mass index; TC, total cholesterol; TG, triglycerides; HDL-C, high-density lipoprotein cholesterol; ALT, alanine aminotransferase; AST, aspartate aminotransferase; FPG, fasting plasma glucose; HbAlc, glycated hemoglobin; UA, uric acid; Scr, serum creatinine.
Development of the incident CKD-predicting nomogram
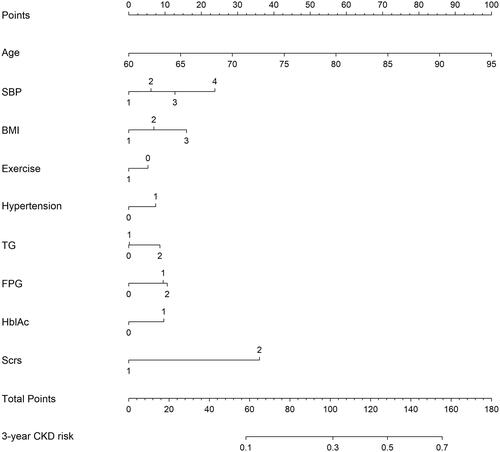
We screened the collinearity of the independent factors (Supplement Table S3) and determined the final predictors according to previous reports and the clinical significance of these variables. The final predictors were age, SBP, BMI, exercise, hypertension, TG, FPG, HbAlc and Scr. The classification and assignment of these variables are presented in Supplement Table S4.
A nomogram for predicting 3-year CKD risk was constructed based on these nine variables (). The total score for the nomogram model was 180. When the total scores were 58, 101, 128, and 156 points, the predicted probabilities of CKD occurrence within three years were 10%, 30%, 50%, and 70%, respectively (Supplement Table S5). A detailed scoring table was obtained according to the nomogram (Supplement Table S6).
Figure 3. Nomogram to predict the 3-year risk of chronic kidney disease (CKD).
Abbreviations: SBP, systolic blood pressure; BMI, body mass index; TG, triglycerides; FPG, fasting plasma glucose; HbAlc, glycated hemoglobin; Scr, serum creatinine.
Validation of the incident CKD-predicting nomogram
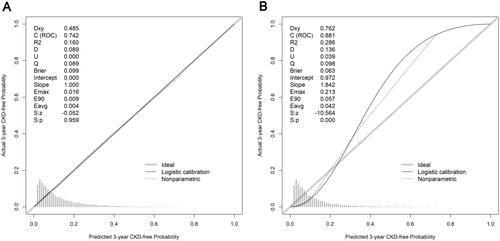
In both cohorts, the nomogram demonstrated good discriminative power, with an AUCs of 0.742 (95%CI, 0.728–0.756) in the development cohort and 0.881(95%CI, 0.867–0.895) in the validation cohort (). The correction curves for the development and validation cohorts are shown in . The actual line and ideal lines (light gray line) were well adapted, with Brier scores of 0.099 and 0.063 in the development and validation cohorts, respectively. It was indicated that there was good fit between actual observations and predictions made using the nomogram in both the development and validation cohorts.
Figure 4. Receiver operating characteristic (ROC) curves for the 3-year chronic kidney disease (CKD) risk prediction model. AUCs in the development cohort (A) and in the validation cohort (B).
Abbreviations: AUC, area under the curve.
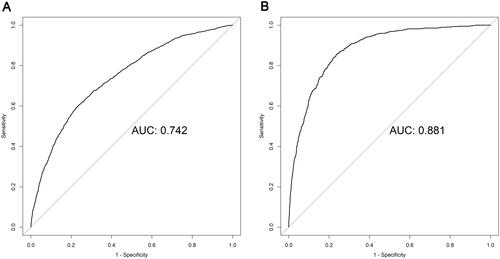
Figure 5. Calibration curves for predicting the risk of 3-year chronic kidney disease (CKD) in all cohorts. (A) in the development cohort; (B) in the validation cohort.
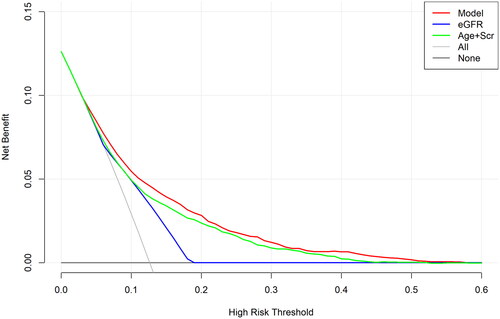
We used the DCA to evaluate the clinical efficacy of the new model. The DCA was drawn using predicted probability of the model group and the external validation group and the actual occurrence of CKD. The DCA results are shown in . In the DCA curve, the black line indicated that in extreme cases, the new model predicted that there were no CKD within 3 years and the clinical net benefit was 0. The gray line, which had a negative slope and was the clinical net benefit, indicated that in extreme cases, the new model predicted that there were CKDs within 3 years. The red line was the DCA of the new model. The results revealed our predictive model (red line) was a little higher than that of the eGFR curve alone or the age + Scr curve, indicating our model had better clinical value and potential net benefits.
Figure 6. The decision curves analysis curve of nomogram and other factors.
Abbreviations: eGFR, estimated glomerular filtration rate; Scr, serum creatinine.
The DCA curve of our predictive model (red line) was little higher than that of the eGFR curve alone (blue line) or the age + Scr curve (green line) models. The closer the DCA curve is to the upper right corner, the greater the benefit, so our model had better clinical value and potential net benefits than other two models.
Discussion
The present study developed a 3-year predictive model of CKD among community-dwelling elderly populations in the developing regions of China, aiming at providing simple and efficient tools for CKD screening among aging populations. CKD is an aging-related disease, but each specific subpopulation has different predictors. Using community-based cohort with 36-month follow-up, we developed a prediction model with the C-statistic of 0.742. A total of 9 predictors (age, SBP, BMI, exercise, hypertension, TG, FPG, HbAlc and Scr) were included in the model.
In our study, most of our predictors were significantly associated with incident CKD, supporting the findings of previous studies and indicating our model´s reliability. Except for HbAlc, FPG was added as a new significant predictor to the model. High glucose increased glomerular permeability, expression of fibrinogenesis markers and circulating levels of inflammatory cytokines [Citation21], specifically, the inability of endothelial cells to down-regulate their glucose transport in response to high glucose levels leads to an overwhelming flux of intracellular glucose, then trigger the generation of pathogenetic indicators that contribute to the development of CKD [Citation22]. TG levels is confirmed to be related to the occurrence of CKD in our study as same as the other studies [Citation23,Citation24]. Dyslipidemia is hypothesized to mediate CKD and play an important role in renal failure [Citation25]. In the nephrotic syndrome, the lipid profile was highly atherogenic, with increased TC and TG [Citation26]. Scr, a small molecule substance, can be filtered through the glomeruli and almost completely excreted through urine. Therefore, an increase in Scr indicates damage to renal function [Citation27].
Physical activity was a protective predictor in our model, which is consistent with our research results [Citation28]. Regular exercise can improve inflammatory biomarkers, based on shifting toward a less inflammatory monocyte and T cell profile, enhancing activity of the NRF2 pathway and reducing monocyte infiltration into adipose tissue [Citation29–33]; exercise can improve lipid and glucose metabolism abnormalities in CKD patients by reducing TG levels and improving insulin signaling [Citation34–36]. A regular prescription of some degree of physical activity could be a treatment strategy for non-dialysis CKD patients that will have significant social benefits [Citation37].
Hypertension is often used as a predict factor [Citation38–41] because hypertension can transmit systemic pressure to the glomeruli, leading to and accelerating kidney damage, resulting in glomerulosclerosis [Citation42,Citation43]. Obesity could drive CKD progression by leading to renal structural damage including glomerulomegaly, glomerulosclerosis, podocyte injury, tubulointerstitial fibrosis, and so on and its mechanisms include hemodynamic changes, inflammation, oxidative stress, and activation of the renin-angiotensin-aldosterone system (RAAS) [Citation44], therefore, BMI is often included in the model [Citation9, Citation41].
Therefore, we suggest that the elderly population in the community should control their blood pressure, blood sugar, and blood lipids at appropriate levels, avoid obesity, actively exercise, and adhere to a low-purine and low-salt diet.
The results of the DCA curve in our study showed that our model is more clinically beneficial and has better application value in clinical practice than the model built using eGFR alone or age and serum creatinine levels. The results of validation in different populations demonstrate that our model has good predictive power, which enables physicians to identify individuals at high risk of CKD when they do not have it.
The implementation of existing CKD prediction models is largely published in the form of mathematical equations, which may not be suitable for application in various environments, especially by busy clinical doctors who may not be familiar with complex formulas [Citation45]. We obtained a scoring table using the nomogram, which is a simple tool for clinical application. In addition, owing to the predictive factors routinely collected in clinical care and without complex biomarkers, doctors can calculate the total score of individuals by the scoring table (Supplementary Table S6), which can quickly predict the 3-year risk of CKD (Supplementary Table S5) of elderly people in the community and provide corresponding prevention suggestions.
This study presents a predictive model for the elderly population in Chinese communities. The sample size was large and there were different groups for external validation. Through different aspects of validation, it is proven that the proposed model has good predictive power and has good clinical applications. In addition, we used a nomogram chart to obtain a score table of influencing factors, which is convenient for clinicians to identify high-risk patients with CKD and provide scientific and reasonable suggestions for practical applications.
This study had some limitations. Firstly, we analyzed all known covariates, but it is possible that some residual variables such as proteinuria, urinary nitrogen and urinary albumin to creatinine ratio (UACR) may remain especially in a secondary analysis; secondly, the smoking and drinking status in our study were not clearly defined, so they were not included in the analysis. Thirdly, the participants in our study are elderly individuals who may be more susceptible to traditional risk factors than young patients, thereby affecting the predictive ability of the model to some extent.
Due to given the progressive nature of CKD, we hope that the follow-up period could be extended in further studies to evaluate the performance of the model over a longer period of time. In addition, results from the sixth China chronic disease and risk factor surveillance showed that a higher incidence of CKD was observed among non-Han ethnicity Chinese, rural or north and central parts of China residents, those with lower education levels or incomes [Citation46]. Therefore, further prospective and detailed population-based studies are also needed to address this socioeconomic status in the future.
Conclusions
We developed a nomogram including nine predictors, which is a simple and reliable tool to predict the 3-year occurrence of CKD in the elderly Chinese community. External validation showed that our model had a predictive power. However, further prospective population-based studies are needed before clinical generalizations can be made.
Authors’ contributions
All authors made a significant contribution to the work reported, whether that is in the conception, study design, execution, acquisition of data, analysis, and interpretation, or in all these areas, took part in drafting, revising, or critically reviewing the article; gave final approval of the version to be published; have agreed on the journal to which the article has been submitted; and agree to be accountable for all aspects of the work.
Supplemental Material
Download Zip (2 MB)Acknowledgments
We thank all the participants for their dedication to the study.
Disclosure statement
The authors declare no potential conflicts of interest with respect to the research, authorship, or publication of this article.
Additional information
Funding
References
- KDIGO 2012 clinical practice guideline for the evaluation and management of chronic kidney disease. Kidney Int Suppl (2011). 2013;3(1):1–10. doi: 10.1038/kisup.2012.77.
- Hill NR, Fatoba ST, Oke JL, et al. Global prevalence of chronic kidney Disease - A systematic review and Meta-Analysis. PLoS One. 2016;11(7):e0158765. doi: 10.1371/journal.pone.0158765.
- Luyckx VA, Al-Aly Z, Bello AK, et al. Sustainable development goals relevant to kidney health: an update on progress. Nat Rev Nephrol. 2021;17(1):15–32. doi: 10.1038/s41581-020-00363-6.
- Zhang L, Wang F, Wang L, et al. Prevalence of chronic kidney disease in China: a cross-sectional survey. Lancet. 2012;379(9818):815–822. doi: 10.1016/s0140-6736(12)60033-6.
- Ritz E, McClellan WM. Overview: increased cardiovascular risk in patients with minor renal dysfunction: an emerging issue with Far-Reaching consequences. J Am Soc Nephrol. 2004;15(3):513–516. doi: 10.1097/01.Asn.0000115398.92270.30.
- Go AS, Chertow GM, Fan D, et al. Chronic kidney disease and the risks of death, cardiovascular events, and hospitalization. N Engl J Med. 2004;351(13):1296–1305. doi: 10.1056/NEJMoa041031.
- James MT, Hemmelgarn BR, Tonelli M. Early recognition and prevention of chronic kidney disease. Lancet. 2010;375(9722):1296–1309. doi: 10.1016/s0140-6736(09)62004-3.
- Boulware LE, Jaar BG, Tarver-Carr ME, et al. Screening for proteinuria in US adults: a cost-effectiveness analysis. Jama. 2003;290(23):3101–3114. doi: 10.1001/jama.290.23.3101.
- Chien KL, Lin HJ, Lee BC, et al. A prediction model for the risk of incident chronic kidney disease. Am J Med. 2010;123(9):836–846.e2. doi: 10.1016/j.amjmed.2010.05.010.
- Sun F, Yu K, Tao QM, et al. Estimated risks on developing chronic kidney disease within 5 years for adults aged 35-74 based on Taiwan MJ health-checkup database. Chin Prev Med. 2013;14(1):47–52. doi: 10.16506/j.1009-6639.2013.01.006.
- Wen J, Hao J, Zhang Y, et al. Risk scores for predicting incident chronic kidney disease among rural chinese people: a village-based cohort study. BMC Nephrol. 2020;21(1):120. doi: 10.1186/s12882-020-01787-9.
- Yu Y, Zhao Q, Jiang Y, et al. Prediction models and nomograms of 3-year risk of chronic kidney disease in China: a study from the shanghai suburban adult cohort and biobank (2016-2020). Ann Transl Med. 2021;9(22):1690–1690. doi: 10.21037/atm-21-5647.
- Levey AS, Stevens LA, Schmid CH, et al. A new equation to estimate glomerular filtration rate. Ann Intern Med. 2009;150(9):604–612. doi: 10.7326/0003-4819-150-9-200905050-00006.
- Writing Group of 2018 Chinese Guidelines for the Management of Hypertension CHL, Chinese Society of Cardiology, Chinese Medical Doctor Association Hypertension Committee, Hypertension Branch of China International Exchange and Promotive Association for Medical and Health Care, Hypertension Branch of Chinese Geriatric Medical Association. 2018 Chinese guidelines for the management of hypertension. Chin J Cardiovasc Med. 2019;24(01):24–56. doi: 10.3969/j.issn.1007-5410.2019.01.002.
- Society CD. Guideline for the prevention and treatment of type 2 diabetes mellitus in China (2020 edition). Chinese Journal of Practical Internal Medicine. 2021;41(08):668–695. doi: 10.19538/j.nk2021080106.
- Ren L, Gao Y, Jiang Y, et al. Association between blood pressure indicators and stroke in aged population: a community-based nested Case-Control study. Clin Interv Aging. 2021;16:997–1005. doi: 10.2147/cia.S304847.
- adults JciCgftmodi. 2016 Chinese guideline for the management of dyslipidemia in adults. Chinese Circulation Journal. 2016;31(10):937–953. doi: 10.3969/j.issn.1000-3614.2016.10.001.
- EGoKCQCCi S. Guidelines for early screening, diagnosis, prevention and treatment of chronic kidney disease (2022 edition). Chinese Journal of Nephrology. 2022;38(5):453–464. doi: 10.3760/cma.j.cn441217-20210819-00067.
- Reference range of commonly used clinical biochemical test items, N.H.a.F.P.C.o.t.P.s.R.o. China, Editor. 2015.
- Kerr KF, Brown MD, Zhu K, et al. Assessing the clinical impact of risk prediction models with decision curves: guidance for correct interpretation and appropriate use. J Clin Oncol. 2016;34(21):2534–2540. doi: 10.1200/jco.2015.65.5654.
- Lee MY, Huang JC, Chen SC, et al. Association of HbA variability and renal progression in patients with type 2 diabetes with chronic kidney disease stages 3-4. IJMS. 2018;19(12):4116. doi: ARTN 4116 doi: 10.3390/ijms19124116.
- Thomas MC, Brownlee M, Susztak K, et al. Diabetic kidney disease. Nat Rev Dis Primers. 2015;1:15018. doi: 10.1038/nrdp.2015.18.
- Mikolasevic I, Žutelija M, Mavrinac V, et al. Dyslipidemia in patients with chronic kidney disease: etiology and management. Int J Nephrol Renovasc Dis. 2017;10:35–45. doi: 10.2147/ijnrd.S101808.
- Iseki K. The Okinawa screening program. J Am Soc Nephrol. 2003;14(7 Suppl 2):S127–S30. doi: 10.1097/01.asn.0000070153.91733.09.
- Moorhead JF, Chan MK, El-Nahas M, et al. Lipid nephrotoxicity in chronic progressive glomerular and tubulo-interstitial disease. Lancet. 1982;2(8311):1309–1311. doi: 10.1016/s0140-6736(82)91513-6.
- Cases A, Coll E. Dyslipidemia and the progression of renal disease in chronic renal failure patients. Kidney Int Suppl. 2005;68(99):S87–S93. doi: 10.1111/j.1523-1755.2005.09916.x.
- Pasala S, Carmody JB. How to use… serum creatinine, cystatin C and GFR. Arch Dis Child Educ Pract Ed. 2017;102(1):37–43. doi: 10.1136/archdischild-2016-311062.
- Kelly JT, Su G, Zhang L, et al. Modifiable lifestyle factors for primary prevention of CKD: a systematic review and Meta-Analysis. J Am Soc Nephrol. 2021;32(1):239–253. doi: 10.1681/asn.2020030384.
- Viana JL, Kosmadakis GC, Watson EL, et al. Evidence for anti-inflammatory effects of exercise in CKD. J Am Soc Nephrol. 2014;25(9):2121–2130. doi: 10.1681/asn.2013070702.
- Dungey M, Young HML, Churchward DR, et al. Regular exercise during haemodialysis promotes an anti-inflammatory leucocyte profile. Clin Kidney J. 2017;10(6):813–821. doi: 10.1093/ckj/sfx015.
- Hale KK, Smith CG, Baker SL, et al. Multifunctional regulation of the biological effects of TNF-alpha by the soluble type I and type II TNF receptors. Cytokine. 1995;7(1):26–38. doi: 10.1006/cyto.1995.1004.
- Muras-Szwedziak K, Masajtis-Zagajewska A, Pawłowicz E, et al. Effects of a structured physical activity program on serum adipokines and markers of inflammation and volume overload in kidney transplant recipients. Ann Transplant. 2019;24:569–575. doi: 10.12659/aot.917047.
- Shantsila E, Wrigley B, Tapp L, et al. Immunophenotypic characterization of human monocyte subsets: possible implications for cardiovascular disease pathophysiology. J Thromb Haemost. 2011;9(5):1056–1066. doi: 10.1111/j.1538-7836.2011.04244.x.
- Goldberg AP, Geltman EM, Gavin JR, 3rd, et al. Exercise training reduces coronary risk and effectively rehabilitates hemodialysis patients. Nephron. 1986;42(4):311–316. doi: 10.1159/000183694.
- Bailey JL. Insulin resistance and muscle metabolism in chronic kidney disease. ISRN Endocrinol. 2013;2013:329606–329614. doi: 10.1155/2013/329606.
- Bowlby W, Zelnick LR, Henry C, et al. Physical activity and metabolic health in chronic kidney disease: a cross-sectional study. BMC Nephrol. 2016;17(1):187. doi: 10.1186/s12882-016-0400-x.
- Mallamaci F, Pisano A, Tripepi G. Physical activity in chronic kidney disease and the EXerCise introduction to enhance trial. Nephrol Dial Transplant. 2020;35(Suppl 2):ii18–ii22. doi: 10.1093/ndt/gfaa012.
- Inaguma D, Kitagawa A, Yanagiya R, et al. Increasing tendency of urine protein is a risk factor for rapid eGFR decline in patients with CKD: a machine learning-based prediction model by using a big database. PLoS One. 2020;15(9):e0239262. doi: 10.1371/journal.pone.0239262.
- Low S, Lim SC, Zhang X, et al. Development and validation of a predictive model for chronic kidney disease progression in type 2 diabetes mellitus based on a 13-year study in Singapore. Diabetes Res Clin Pract. 2017;123:49–54. doi: 10.1016/j.diabres.2016.11.008.
- Yang XL, So WY, Kong AP, et al. End-stage renal disease risk equations for Hong Kong chinese patients with type 2 diabetes: hong Kong diabetes registry. Diabetologia. 2006;49(10):2299–2308. doi: 10.1007/s00125-006-0376-3.
- Nelson RG, Grams ME, Ballew SH, et al. Development of risk prediction equations for incident chronic kidney disease. Jama. 2019;322(21):2104–2114. doi: 10.1001/jama.2019.17379.
- Bidani AK, Polichnowski AJ, Loutzenhiser R, et al. Renal microvascular dysfunction, hypertension and CKD progression. Curr Opin Nephrol Hypertens. 2013;22(1):1–9. doi: 10.1097/MNH.0b013e32835b36c1.
- Hamrahian SM, Falkner B. Hypertension in chronic kidney disease. Adv Exp Med Biol. 2017;956:307–325. doi: 10.1007/5584_2016_84.
- Jiang Z, Wang Y, Zhao X, et al. Obesity and chronic kidney disease. Am J Physiol Endocrinol Metab. 2023;324(1):E24–e41. doi: 10.1152/ajpendo.00179.2022.
- Echouffo-Tcheugui JB, Kengne AP. Risk models to predict chronic kidney disease and its progression: a systematic review. PLoS Med. 2012;9(11):e1001344. doi: 10.1371/journal.pmed.1001344.
- Wang L, Xu X, Zhang M, et al. Prevalence of chronic kidney disease in China: results from the sixth China chronic disease and risk factor surveillance. JAMA Intern Med. 2023;183(4):298–310. doi: 10.1001/jamainternmed.2022.6817.