
Abstract
Background
The International IgA Nephropathy (IgAN) Network developed and validated two prognostic prediction models for IgAN, one incorporating a race parameter. These models could anticipate the risk of a 50% reduction in estimated glomerular filtration rate (eGFR) or progression to end-stage renal disease (ESRD) subsequent to an IgAN diagnosis via renal biopsy. This investigation aimed to validate the International IgA Nephropathy Prediction Tool (IIgANPT) within a contemporary Chinese cohort.
Methods
Within this study,185 patients diagnosed with IgAN via renal biopsy at the Center for Kidney Disease, Second Affiliated Hospital of Nanjing Medical University, between January 2012 and December 2021, were encompassed. Each patient’s risk of progression was assessed utilizing the IIgANPT formula. The primary outcome, a 50% decline in eGFR or progression to ESRD, was examined. Two predictive models, one inclusive and the other exclusive of a race parameter, underwent evaluation via receiver-operating characteristic (ROC) curves, subgroup survival analyses, calibration plots, and decision curve analyses.
Results
The median follow-up duration within our cohort spanned 5.1 years, during which 18 patients encountered the primary outcome. The subgroup survival curves exhibited distinct separations, and the comparison of clinical and histological characteristics among the risk subgroups revealed significant differences. Both models demonstrated outstanding discrimination, evidenced by the areas under the ROC curve at five years: 0.882 and 0.878. Whether incorporating the race parameter or not, both prediction models exhibited acceptable calibration. Decision curve analysis affirmed the favorable clinical utility of both models.
Conclusions
Both prognostic risk evaluation models for IgAN exhibited remarkable discrimination, sound calibration, and acceptable clinical utility.
Introduction
IgAN stands as the most prevalent glomerulonephritis globally and represents a significant cause of chronic kidney disease (CKD) and ESRD [Citation1–3]. It impacts an estimated 200,000–350,000 individual worldwide annually [Citation4]. The prevalence of IgAN exhibits considerable variation across regions and accounts for 40% of glomerulonephritis cases in Asia. The variation in prevalence across regions may stem partially from racial and genetic factors [Citation5]. The clinical course of IgAN spans from persistent asymptomatic microscopic hematuria to rapid progression to renal failure. The risk of progressive decline in renal function varies considerably, with the incidence of ESRD ranging from 5% to 60% within 10 years post-diagnosis [Citation6,Citation7].
It is of great importance for clinicians to promptly identify high-risk patient using reliable risk assessment and stratification tools, which may enable timely interventions to delay disease progression and minimize unnecessary use of immunosuppressants in low-risk patients. The IIgANPT comprises two comprehensive prognostic prediction models, one integrating a race parameter. Developed by the International IgAN Network, it draws from a pooled cohort encompassing Chinese, Japanese, Caucasian, and Other race. These two models offer risk predictions for a 50% decline in eGFR or progression to ESRD within 80 months post-renal biopsy among IgAN patients, facilitating effective risk stratification in this population [Citation8]. Unlike other prediction models for IgAN, the IIgANPT integrates clinical parameters including eGFR, proteinuria, and blood pressure at biopsy, with pathological indicators including Oxford MEST histologic score. These factors are recognized as pivotal and routinely available clinical prognostic predictors [Citation9]. The diagnosis of IgAN predominantly relies on renal biopsy. The Oxford histologic score has been internationally validated with high reproducibility and extensively employed in IgAN pathology reports. Importantly, it stands independently associated with kidney prognosis [Citation10–12].
Transparent reporting of a multivariable prediction model for individual prognosis or diagnosis (TRIPOD) underscores the imperative for extensive external validation before any risk prediction model can attain broad application in clinical practice [Citation13]. While the IIgANPT has undergone external validation in cohorts from central and northern China, the median follow-up duration in both cohorts remains notably shorter than that in the original study, potentially impacting the precision of model validation. Additionally, the IIgANPT without race parameter consistently underestimates predicted risks in both Chinese cohorts and the external validation outcomes across both cohorts display inconsistency in determining the superior performance between the two models [Citation14,Citation15]. Moreover, the establishment of the IIgANPT relies on an ancient retrospective cohort [Citation8]. These concerns contribute to the limited utilization of the prediction models in clinical practice. Further validation studies are urgently warranted to ascertain the reproducibility and generalizability of the prediction models to novel and diverse patient populations [Citation16].
Therefore, this study aimed to externally validate the IIgANPT with and without the race parameter in a contemporary Chinese cohort.
Methods
Study population
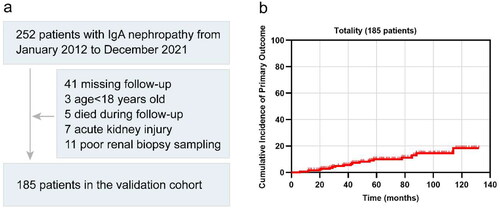
A total of 185 patients diagnosed with IgAN via renal biopsy between January 2012 and December 2021 at the Center for Kidney Disease, Second Affiliated Hospital of Nanjing Medical University, were included in this study (). These patients had available Oxford histologic scores documented in their pathological reports and underwent long-term follow-up post-renal biopsy. Exclusion criteria encompassed individuals under 18 years old, those with acute kidney injury, or those who deceased during the follow-up period. This study received approval from the Ethics Committee of the Second Affiliated Hospital of Nanjing Medical University (Ethical number: [2023]-KY-012-01).
Figure 1. (a) Flowchart of patient inclusion and (b) cumulative incidence of the primary outcome. In original cohort of 252 patients with IgA nephropathy, 185 patients were enrolled in the final validation cohort.
Predictors and definitions
The collected data for each patient comprised clinical information, laboratory examination results, pathological characteristics from renal biopsy, and medication records of eligible research subjects at the time of biopsy. This included parameters, such as age, sex, blood pressure, eGFR, 24-h urine protein, Oxford histological score, and the use of renin-angiotensin system blockers (RASB) and immunosuppressants. Data retrieval occurred through the electronic medical records system or paper medical records, ensuring complete datasets without any missing information. We computed the eGFR using the CKD Epidemiology Collaboration formula [Citation17]. Mean arterial pressure (MAP) was derived as diastolic blood pressure plus one-third of the pulse pressure. RASB encompassed angiotensin-converting enzyme inhibitor and angiotensin receptor blocker. Immunosuppressants included glucocorticoid and tripterygium glycoside. The primary outcome involved a 50% decline in eGFR or ESRD, defined as an eGFR less than 15 mL/min/1.73 m2, requiring dialysis, or undergoing transplantation. The follow-up concluded in December 2022.
Calculation of predicted risk and delineation of risk subgroups
The coefficients of the variables in the IIgANPT with race parameter and without race parameter were different. Utilizing the formulas from the original IIgANPT study’s supplementary material [Citation8], we calculated the linear predictors and the risk of developing the primary outcome for each patient. Based on the percentiles of linear predictors derived from the prediction models including or not including race parameter, we used a same method as in the original study to categorize patients with IgAN into four distinct risk subgroups: <16th percentile, low risk; 16th–50th percentile, intermediate risk; 50th–84th percentile, higher risk; and >84th percentile, highest risk [Citation8].
Statistical analysis
The results are expressed as mean ± standard deviation, median (interquartile range), or frequency (percentage). We employed the student’s t-test for comparing normally distributed quantitative data, the Mann–Whitney test for non-normally distributed quantitative data comparison, and the chi-square test for comparing rates.
The IIgANPT underwent evaluation based on discrimination, calibration, and clinical utility. Specifically, discrimination was assessed using the area under the ROC curve and subgroup survival curve. Calibration was measured through a time-specific calibration diagram, comparing predicted and observed risks of the primary outcome. Clinical utility was reported through decision curve analysis, elucidating the models’ suitability for clinical decision-making. The external validation results were presented following the risk prediction model TRIPOD guideline [Citation18].
We conducted statistical analyses using R version 4.2.2 (R Core Team, Vienna, Austria) and employed GraphPad Prism version 9.4.0 (GraphPad Software, Inc, La Jolla, CA) for graphic drawing. Statistical significance was defined as p < 0.05.
Results
Study population baseline characteristics
The patient enrollment flowchart is depicted in , and a comparison of baseline characteristics among our external validation cohort, the original derivation cohort, and the original validation cohort is presented in . The final validation analysis included a total of 185 patients. As anticipated, variations in patient characteristics were observed among the three cohorts. Our validation cohort was more contemporary compared to the two original cohorts, with median biopsy years recorded as 2017, 2006, and 1998, respectively. Three cohorts shared similar follow-up durations, with median follow-up times of 5.1, 4.8, and 5.8 years, correspondingly. The median age of patients in our cohort was 41 years, with 42.7% being male. Distribution across CKD stages at renal biopsies revealed 90 patients in CKD Stage 1, 44 in CKD Stage 2, 42 in CKD Stage 3, and 9 in CKD Stage 4. The distribution of patients across CKD stages resembled that of the original cohorts. The median average arterial pressure at biopsy in our cohort was higher than that observed in the original cohorts, recording values of 97.0, 96.7, and 93.3 mmHg, respectively. Our cohort exhibited a lower median 24-h urine protein and a higher proportion of S1 score compared to the original cohorts, with proteinuria levels at 0.8, 1.2, and 1.3 g/d, and proportions of S1 score at 85.4%, 77.0%, and 79.6%, respectively. Regarding crescents, our cohort showed an intermediate proportion between the two original cohorts, presenting figures of 40.0%, 34.3%, and 56.1%, respectively. Additionally, the rates of RASB application stood at 86.7% and 66.4% at or prior to biopsy in the original cohort, but 80.5% in our cohort. The utilization of immunosuppressant in our cohort exceeded that in the original cohorts, noted at 44.9%, 43.5%, and 31.3%, respectively. Specifically, 49 patients underwent glucocorticoid treatment, 23 received tripterygium glycoside, and 11 utilized both. The incidence of primary outcomes in our cohort was significantly lower than that observed in the two original cohorts, standing at 9.7%, 28.5%, and 31.8%, respectively.
Table 1. Comparison of baseline characteristics among the external validation cohort, original derivation cohort, and original validation cohort.
Comparison of risk subgroups
The 5-year cumulative incidence of the primary outcome in our external validation cohort was 18.5% (), surpassing those observed in the original derivation and validation cohorts [Citation8]. Patients with IgAN were stratified into four risk subgroups based on the percentiles of linear predictors from the IIgANPT (<16th, low risk; 16–50th, intermediate risk; 50–84th, higher risk; >84th, highest-risk). Notably, the survival curves of these risk subgroups exhibited clear distinctions, particularly evident in the higher- and highest-risk groups, irrespective of the inclusion of the race variable in the prediction model (). Moreover, comparison across the clinical and histological characteristics among the four risk subgroups revealed significant statistical differences. These disparities were noted in blood pressure, eGFR, 24-h urinary protein, as well as M, S, and T scores in Oxford histological scores at biopsy. Generally, as the risk escalated within each stratification, both the clinical indicators and pathological lesions showed deteriorating trends, regardless of whether the stratification was based on models with or without race ( and ).
Figure 2. Survival curves across four risk subgroups determined by the percentile of linear predictors from (a) model including race parameter or (b) model excluding race parameter. The risk subgroups were categorized as <16th, low risk; 16–50th, intermediate risk; 50–84th, higher risk; >84th, highest risk.
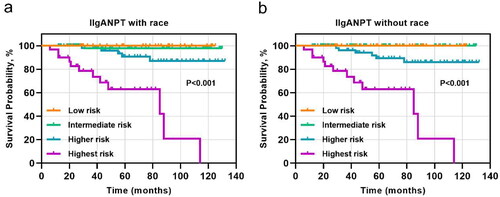
Table 2a. Comparison of clinical and histological characteristics among four risk subgroups based on the model including race parameter.
Table 2b. Comparison of clinical and histological characteristics among four risk subgroups based on the model excluding race parameter.
Measures of discrimination
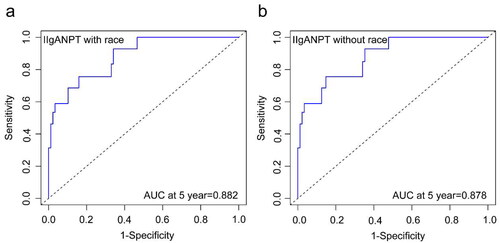
Both prediction models exhibited excellent discrimination when applied to our cohort (). The areas under the ROC curve at 5 years were 0.882 and 0.878, respectively, surpassing those in the original cohort.
Figure 3. ROC curve at 5 years for (a) model including race parameter or (b) model excluding race parameter.
Model calibration
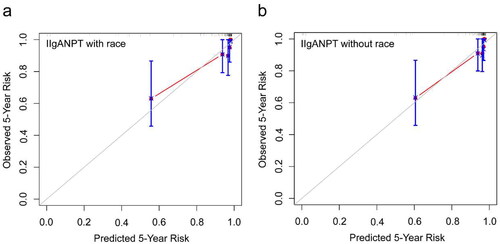
The calibration curve () for the predicted and observed 5-year risk of the primary outcome by applying the models in our IgAN patient cohort revealed that both models achieved acceptable fit. Notably, the prediction model without race variables appeared to demonstrate superior calibration compared to the model containing the race variable.
Figure 4. Calibration plots for 5-year predicted risk depicted that both (a) model including race parameter and (b) model excluding race parameter achieved sound calibration.
Clinical utility
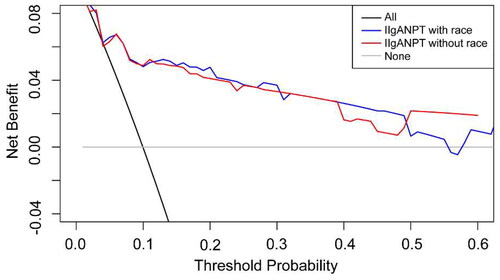
The decision curve analysis for the 5-year predicted risk is illustrated in . Both models exhibited a positive net benefit, and the decision curves positioned above the none line and the All line across a considerable threshold range. The observed clinical utility of these two models is acceptable.
Figure 5. Decision curve analysis employing 5-year predicted risk demonstrated that both models exhibited a positive net benefit and the decision curves positioned above the None line and the All line across a broad threshold range.
Discussion
In this study, we evaluated the efficacy of the IIgANPT utilizing an external cohort comprising 185 IgAN patients from the Center for Kidney Disease, Second Affiliated Hospital of Nanjing Medical University. Both prediction models exhibited substantial discrimination and were well-calibrated for predicting the primary outcome’s risk. The area under the ROC curve exceeded 0.82, and the survival curves for the subgroups displayed distinct separation. Moreover, the decision curve analysis of the models showcased an acceptable clinical utility for these models.
It is essential to use a dependable prediction model to accurately assess the risk of IgAN progression due to the considerable heterogeneity of risk among diverse ethnic groups [Citation7,Citation19]. Apart from the IIgANPT, several prognostic prediction models for IgAN have emerged. However, these models present some limitations, such as excluding pathological variables, including pathological variables that are not extensively recognized, or lacking external validation across diverse ethnicities [Citation20–24]. The IIgANPT was developed based on an international multicenter and multi-ethnic cohort, incorporating widely recognized, routinely available clinical and histological risk factors. This is of great value for patient-specific risk stratification, treatment decisions, clinical trial recruitment, and biomarker verification [Citation8]. Nevertheless, its widespread adoption in specific patient groups mandates extensive external validation as a consequence of the heterogeneous progressive risk for IgAN and outdated original study population [Citation8,Citation25]. The external validation of the IIgANPT in our cohort may improve subsequent treatment strategies for patients with IgAN, particularly within the Center for Kidney Disease of the Second Affiliated Hospital of Nanjing Medical University. While appreciating the IIgANPT’s superiority in assessing prognostic risk in the IgAN population, it’s imperative to acknowledge that it may not be perfect like all predictive models. Primarily, IIgANPT can only provide predictions of the risk of a 50% decrease in eGFR or progression to ESRD within 80 months post-renal biopsy among IgAN patients, a rather short period in a mostly slow-progressing disease like IgAN. Further, it fails to predict outcomes for patients with few symptoms or findings in the early stages of the disease course, even though many might experience kidney function deterioration decades later [Citation26]. Additionally, the evolution of IgAN-targeted therapies, while improving IgAN outcomes, could potentially affect the predictive accuracy of the IIgANPT model. Hence, it is probable that the model will require periodic updates or validations over time [Citation27]. Moreover, the IIgANPT model stems from a retrospective cohort and lacks validation in a prospective cohort to date, nor are there studies testing whether treatment guided by predicted risk improves outcomes in clinical practice.
The performance of the clinical prediction model depends, to a certain extent, on the variability of patient characteristics in the model validation dataset. Both International IgAN Prognosis Prediction models, with and without the inclusion of a race parameter, exhibited prominent discrimination, with the areas under the 5-year ROC curve of 0.882 and 0.878. The Kaplan–Meier curves for risk subgroups were remarkably separated, and there were significant differences in clinical and histological characteristics among the four risk groups stratified by the percentiles of linear predictor from these prediction models. The discrimination of the model incorporating the race parameter marginally surpassed that of the model without race parameter. It is insufficient to use discrimination alone to evaluate the performance of the models. Therefore, we plotted calibration curves to assess the goodness of fit for both models and utilized decision curve analysis to determine whether the models could benefit clinical decisions. The calibration of the model lacking the race parameter appeared superior to the model incorporating it, aligning with the validation in northern China cohort [Citation15]. Yet, the decision curve analysis revealed comparable clinical applicability for both models.
Certainly, this study has several limitations. Primarily, it was a single-center retrospective study with a relatively modest sample size. The limited sample size might influence the model’s fit. However, our external validation results still demonstrated commendable discrimination and satisfactory calibration of the IIgANPT, aligning well with outcomes observed in analogous Chinese cohorts. Furthermore, the condition of patients in our cohort might be comparatively milder in contrast to all individuals diagnosed with IgAN in our hospital. It could be attributed to patients with end-stage nephropathy who often discontinue follow-up, contributing to the lower proportion of primary outcome noted in our cohort compared to the original cohorts. Additionally, noteworthy is that a limited number of patients in our cohort received tripterygium glycoside treatment. Published meta-analysis have indicated its potential efficacy and safety in improving remission rates, lowering urinary protein, and preserving renal function in individuals with IgAN [Citation28,Citation29]. A proposed mechanism involves triptolide’s ability to inhibit mesangial cell proliferation by promoting autophagy [Citation30]. Nevertheless, it is still controversial about the effect of tripterygium glycoside in IgA nephropathy currently, primarily due to the quality constraints of existing randomized controlled studies. Finally, further research is warranted to determine the optimal risk threshold for stratifying progressive and non-progressive IgAN or commencing immunosuppressive treatment.
In conclusion, we utilized cohorts with distinct clinical and pathological characteristics compared to the original study, particularly concerning the year of renal biopsy, to evaluate the IIgANPT. The exceptional discrimination, calibration, and clinical utility in the models for our IgAN patients were observed. Our data improved the efficacy of previous external validation results for the models and provided evidence supporting the reliability of the model for application in prognostic risk assessment and stratification for individuals with IgAN.
Author contributions
LH contributed to the data analysis and wrote the article. YF contributed to the study design and revised the manuscript. JH, JL, and LX contributed to data collection. WH conceived of and revised the manuscript. All authors have read and approved the final version submitted for publication.
Acknowledgments
The authors extend their sincere gratitude to all patients who participated in this clinical study.
Disclosure statement
No potential conflict of interest was reported by the author(s).
Additional information
Funding
References
- D’Amico G. The commonest glomerulonephritis in the world: IgA nephropathy. Q J Med. 1987;64(245):1–8.
- Wyatt RJ, Julian BA. IgA nephropathy. N Engl J Med. 2013;368(25):2402–2414. doi: 10.1056/NEJMra1206793.
- Barratt J, Feehally J. IgA nephropathy. J Am Soc Nephrol. 2005;16(7):2088–2097. doi: 10.1681/ASN.2005020134.
- Lai KN, Tang SC, Schena FP, et al. IgA nephropathy. Nat Rev Dis Primers. 2016;2(1):16001. doi: 10.1038/nrdp.2016.1.
- Sallustio F, Curci C, Di Leo V, et al. A new vision of IgA nephropathy: the missing link. Int J Mol Sci. 2019;21(1):189.
- Reich HN, Troyanov S, Scholey JW, et al. Remission of proteinuria improves prognosis in IgA nephropathy. J Am Soc Nephrol. 2007;18(12):3177–3183. doi: 10.1681/ASN.2007050526.
- Magistroni R, D’Agati VD, Appel GB, et al. New developments in the genetics, pathogenesis, and therapy of IgA nephropathy. Kidney Int. 2015;88(5):974–989. doi: 10.1038/ki.2015.252.
- Barbour SJ, Coppo R, Zhang H, et al. Evaluating a new international risk-prediction tool in IgA nephropathy. JAMA Intern Med. 2019;179(7):942–952. doi: 10.1001/jamainternmed.2019.0600.
- Barbour SJ, Reich HN. Risk stratification of patients with IgA nephropathy. Am J Kidney Dis. 2012;59(6):865–873. doi: 10.1053/j.ajkd.2012.02.326.
- Lv J, Shi S, Xu D, et al. Evaluation of the Oxford classification of IgA nephropathy: a systematic review and meta-analysis. Am J Kidney Dis. 2013;62(5):891–899. doi: 10.1053/j.ajkd.2013.04.021.
- Trimarchi H, Barratt J, Cattran DC, et al. Oxford classification of IgA nephropathy 2016: an update from the IgA nephropathy classification working group. Kidney Int. 2017;91(5):1014–1021. doi: 10.1016/j.kint.2017.02.003.
- Cattran DC, Coppo R, Cook HT, et al. The Oxford classification of IgA nephropathy: rationale, clinicopathological correlations, and classification. Kidney Int. 2009;76(5):534–545. doi: 10.1038/ki.2009.243.
- Collins GS, Reitsma JB, Altman DG, et al. Transparent reporting of a multivariable prediction model for individual prognosis or diagnosis (TRIPOD): the TRIPOD statement. BMJ. 2015;350(jan07 4):g7594–g7594. doi: 10.1136/bmj.g7594.
- Zhang J, Huang B, Liu Z, et al. External validation of the international IgA nephropathy prediction tool. Clin J Am Soc Nephrol. 2020;15(8):1112–1120. doi: 10.2215/CJN.16021219.
- Zhang Y, Guo L, Wang Z, et al. External validation of international risk-prediction models of IgA nephropathy in an Asian-Caucasian cohort. Kidney Int Rep. 2020;5(10):1753–1763. doi: 10.1016/j.ekir.2020.07.036.
- Ramspek CL, Jager KJ, Dekker FW, et al. External validation of prognostic models: what, why, how, when and where? Clin Kidney J. 2021;14(1):49–58. doi: 10.1093/ckj/sfaa188.
- Levey AS, Stevens LA, Schmid CH, et al. A new equation to estimate glomerular filtration rate. Ann Intern Med. 2009;150(9):604–612. doi: 10.7326/0003-4819-150-9-200905050-00006.
- Moons KG, Altman DG, Reitsma JB, et al. Transparent reporting of a multivariable prediction model for individual prognosis or diagnosis (TRIPOD): explanation and elaboration. Ann Intern Med. 2015;162(1):W1–73. doi: 10.7326/M14-0698.
- Rodrigues JC, Haas M, Reich HN. IgA nephropathy. Clin J Am Soc Nephrol. 2017;12(4):677–686. doi: 10.2215/CJN.07420716.
- Okonogi H, Utsunomiya Y, Miyazaki Y, et al. A predictive clinical grading system for immunoglobulin a nephropathy by combining proteinuria and estimated glomerular filtration rate. Nephron Clin Pract. 2011;118(3):c292–300. doi: 10.1159/000322613.
- Xie J, Kiryluk K, Wang W, et al. Predicting progression of IgA nephropathy: new clinical progression risk score. PLoS One. 2012;7(6):e38904. doi: 10.1371/journal.pone.0038904.
- Pesce F, Diciolla M, Binetti G, et al. Clinical decision support system for end-stage kidney disease risk estimation in IgA nephropathy patients. Nephrol Dial Transplant. 2016;31(1):80–86. doi: 10.1093/ndt/gfv232.
- Goto M, Kawamura T, Wakai K, et al. Risk stratification for progression of IgA nephropathy using a decision tree induction algorithm. Nephrol Dial Transplant. 2009;24(4):1242–1247. doi: 10.1093/ndt/gfn610.
- Chen T, Li X, Li Y, et al. Prediction and risk stratification of kidney outcomes in IgA nephropathy. Am J Kidney Dis. 2019;74(3):300–309. doi: 10.1053/j.ajkd.2019.02.016.
- Tripepi G, Heinze G, Jager KJ, et al. Risk prediction models. Nephrol Dial Transplant. 2013;28(8):1975–1980. doi: 10.1093/ndt/gft095.
- Knoop T, Vikse BE, Mwakimonga A, et al. Long-term outcome in 145 patients with assumed benign immunoglobulin a nephropathy. Nephrol Dial Transplant. 2017;32(11):1841–1850. doi: 10.1093/ndt/gfx242.
- Floege J, Wied S, Rauen T. Assessing prognosis in IgA nephropathy. Kidney Int. 2022;102(1):22–24. doi: 10.1016/j.kint.2022.04.018.
- Wang RX, Liao BQ, Chen W, et al. A meta-analysis of effects and safety of tripterygium wilfordii polyglycoside in the treatment of IgA nephropathy. Eur Rev Med Pharmacol Sci. 2022;26(23):8756–8770.
- Chen YZ, Gao Q, Zhao XZ, et al. Meta-analysis of tripterygium Wilfordii Hook F in the immunosuppressive treatment of IgA nephropathy. Intern Med. 2010;49(19):2049–2055. doi: 10.2169/internalmedicine.49.3704.
- Zhao L, Lan Z, Peng L, et al. Triptolide promotes autophagy to inhibit mesangial cell proliferation in IgA nephropathy via the CARD9/p38 MAPK pathway. Cell Prolif. 2022;55(9):e13278. doi: 10.1111/cpr.13278.