
Abstract
Background: Ascertaining the total body water (V), usually obtained by the Watson formula or bioimpedance spectroscopy (BIS), is crucial for the calculation of Kt/V in patients with peritoneal dialysis (PD). The aim of our study was to compare two different methods of determining V and explore which one is suitable for clinical application.
Methods: This was a retrospective observational study. V was determined using the Watson formula (Vwat) and BIS (Vbis). The differences between Vbis and Vwat and between Kt/Vbis and Kt/Vwat were assessed. The patients were allocated to different groups according to the Kt/Vwat and Kt/Vbis values. Clinical parameters were compared between these groups to investigate which method of obtaining the Kt/V value was more suitable.
Results: 150 patients on PD were included. Vwat was significantly higher than Vbis, apart from in female patients with volume overload. Consequently, weekly Kt/Vwat was lower than Kt/Vbis in these patients. A significant negative correlation between mean Vwat-Vbis and overhydration values was also found. Moreover, through uniform manifold approximation and projection analysis, a clustering tendency between patients in the adequate group with both Kt/Vwat and Kt/Vbis > =1.7 and patients in the inconsistent group with Kt/Vwat <1.7 and Kt/Vbis > =1.7 was identified, suggesting that their clinical features were similar.
Conclusion
There were significant differences between Vwat and Vbis and between Kt/Vwat and Kt/Vbis. Kt/Vwat may underestimate small-solute dialysis adequacy in most cases. Kt/Vbis instead of Kt/Vwat could be accounted for in creating individualized dialysis prescriptions if the patient has no obvious clinical symptoms.
Introduction
Adequacy of dialysis is an important factor influencing the quality of life and mortality of patients on peritoneal dialysis (PD). Recently, it has been proposed that the adequacy of dialysis should be interpreted clinically rather than by focusing only on solute removal [Citation1]. However, the current International Society for Peritoneal Dialysis (ISPD) guidelines still recommend that small-solute clearance should be routinely assessed to provide a quantitative measure of the amount of dialysis delivered [Citation1]. Weekly Kt/V is one measure employed to assess the solute clearance [Citation2]. In the Kt/V formula, both ‘K’ (urea clearance) and ‘t’ (dialysis time) are strictly objective data. ‘V’ is the distribution volume of urea and is equivalent to total body water (TBW) [Citation3].
The Watson equation, which accounts for age, gender, height, and weight, is commonly used to estimate TBW [Citation4]. Since the Watson formula was derived from a healthy population, it could be inaccurate when applied to uremic patients. In our clinical practice, we found that compared to female patients, male PD patients seemed to have difficulty reaching a Kt/V greater than 1.7 or even 1.5. Bioimpedance spectroscopy (BIS) is a noninvasive approach to obtain body composition and hydration status, can also be used to determine TBW in a theoretically objective manner [Citation5]. We found that TBW obtained from the Watson formula and BIS differed greatly in some PD patients. Therefore, the purpose of this study was to assess the difference in estimating the TBW by the Watson formula (Vwat) and BIS (Vbis). The influences of different TBW values on evaluating the efficacy of a PD unit were explored. Finally, which method could be applied more suitably to measure small-solute dialysis efficacy in PD patients was also investigated.
Methods
This was a single center retrospective study of patients with PD at Nanjing Drum Tower Hospital between September 2021 and September 2022. Patients on PD who routinely received assessments of dialysis adequacy and underwent bioimpedance measurements during hospitalization were eligible. All patients were clinically stable, without acute heart failure, malnourished, episodes of peritonitis or other apparent infections. Data collected from each patient included demographics, cause of CKD, dialysis vintage, blood pressure, peritoneal transport (4-h dialysate effluent to plasma creatinine ratio, D4/PCreat), laboratory parameters and questionnaire data (modified subjective global assessment (SGA), Functional Assessment of Chronic Illness Therapy–Fatigue (FACIT-F), Hospital Anxiety and Depression, short form (SF)-36).
In our center, BIS (Body Composition Monitor: Fresenius Medical Care) was performed routinely in the morning after fasting, without PD solution in the abdomen and with empty bladder in patients with residual renal function (RRF). Vbis, overhydration value (OH), and OH normalized to extracellular water (OH/ECW) were obtained from the BIS measurement. The V value was also calculated using the standard Watson formula (men: V = 2.447 − (0.09156 × age) + (0.1074 × height) + (0.3362 × weight); women: V = (0.1096 × height) + (0.2466 × weight) − 2.097). The ideal weight method (height-105) was used to calculate Vwat if the body mass index (BMI) was <18.5 or > =28. Routine blood, 24-h urine, and 24-h peritoneal effluent analysis was used to calculate the weekly Kt/V values (Kt/Vbis and Kt/Vwat) and creatinine clearance (CrCl).
Data were analyzed using R software. The results were expressed as proportions for categorical variables and as the means [±standard deviation (SD)] or median [interquartile range (IQR)] for continuous variables. Two-sided p values <0.05 were considered statistically significant. The Shapiro–Wilk test was applied to determine whether numeric variables were normally distributed. For comparison of means or frequencies between groups, Student’s t, Mann–Whitney U or Chi-square test was performed as appropriate. To determine whether there were any significant differences between the two matching samples, paired t or Wilcoxon signed rank sum tests were used. The Nemenyi test was used to assess differences between multiple groups. Correlations between mean differences in TBW measured by the two approaches and OH values were analyzed by linear regression analysis. In addition, to examine the agreement and visualize the differences between Kt/Vwat and Kt/Vbis, we used the Bland–Altman method [Citation6]. In the female patients with OH > =2 L and male patients, data were transformed into a log-10 scale to meet the Bland–Altman assumptions [Citation6]. Referring to previous studies [Citation7], we also categorized the patients into three groups according to the measured OH/ECW. The patients with OH/ECW <7% were considered to have normal hydration. The patients with OH/ECW between 7 and 15% were considered to have moderate overhydration. The patients with OH/ECW >15% were considered to have severe overhydration.
To explore which indicator (Kt/Vwat or Kt/Vbis) could be used more suitable to assess the dialysis efficacy, the clinical features were compared between groups divided by the Kt/Vwat and Kt/Vbis values. According to the ISPD guidelines and previous reports [Citation1,Citation8–11], we selected several clinical parameters that were usually assessed in PD patients or associated with RRF, including blood pressure, CrCl, nutritional and electrolyte parameters (albumin, prealbumin, calcium, phosphorus and potassium), anemia indices (hemoglobin, serum ferritin, transferrin saturation), serum parathormone (PTH), B-type natriuretic peptide (BNP), uric acid, homocysteine, serum β2-microglobulin (MG), cystatin C and procalcitonin. Subsequently, we compared the success rates of these clinical parameters between groups through the Chi-square test. The target values of uric acid, homocysteine, β2-MG, cystatin C and procalcitonin were set based on the first third of the study population. In addition, to visualize the similarity and clustering among high-dimensional data for the levels of these clinical parameters among groups in a two-dimensional map, we applied uniform manifold approximation and projection (UMAP) to reduce the dimensionality and produce embeddings in two dimensions [Citation12].
Results
During the study period, 150 PD patients who had received assessments of dialysis adequacy and BIS measurements were included. The baseline characteristics of the study population are shown in . The median age and dialysis vintage were 56 years (IQR 42–63) and 12.5 months (IQR 4–25.25), respectively.
Table 1. Descriptive characteristics of the study population.
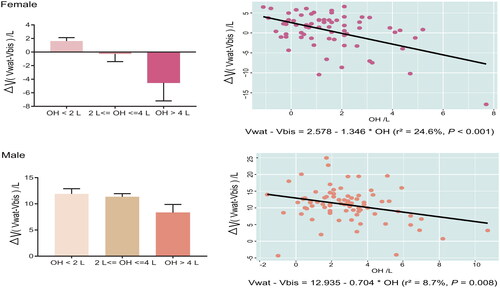
The median Vwat was 43.2 (IQR 29.1–48.9) L, while the median Vbis was 32.9 (IQR 27.8–38.6) L. There was a significant difference between the Vwat and Vbis (p < 0.001) (). Consequently, the weekly Kt/Vbis (median 1.89, IQR 1.59–2.18) was significantly higher than Kt/Vwat (median 1.57, IQR 1.29–1.99) (). The same remarkable results were also observed in both the male and female patients. When the male patients were categorized by OH/ECW values, the Vwat was still significantly higher than the Vbis in all the groups (). However, in female patients, there was a significant difference between Vwat and Vbis only in the normal hydration group (p < 0.05, ). No significant differences were found between them in the moderate and severe overhydration groups. The associations between mean Vwat-Vbis and OH values were investigated. There were significant correlations between mean Vwat-Vbis and OH values in both the female and male patients (). According to the linear regression model of the female patients (Vwat-Vbis= −1.346*OH + 2.578, r2=24.6%), when the OH value is greater than 1.92 L, Vwat is less than Vbis. In contrast, the linear regression model of male patients (Vwat-Vbis= −0.704*OH + 12.935, r2=8.7%) provided a larger intercept and a slope smaller than unity, indicating that Vwat is almost greater than Vbis in male patients during clinical practice unless the OH value can be greater than 18.37 L.
Figure 1. (A, B) There were significant differences between the Vwat and Vbis, Kt/Vwat and Kt/Vbis in the total study patients, female patients (F-Vwat and F-Vbis; F-Kt/Vwat and F-Kt/Vbis) and male patients (M-Vwat and M-Vbis; M-Kt/Vwat and M-Kt/Vbis); in male patients, Vwat was higher than Vbis in all the groups with different hydration statuses; consequently, the weekly Kt/Vwat was lower than Kt/Vbis; in female patients, the differences between Vwat and Vbis and between Kt/Vwat and Kt/Vbis were detected only in the group with normal hydration status; (C) Bland–altman method to assess agreement between Kt/Vwat and Kt/Vbis; the difference is plotted on the vertical axis, and their mean is plotted on the horizontal axis; despite the zero line, the Middle horizontal line represents the mean difference and the two horizontal dotted lines, one above and the other below, are the 95% limits of agreement of the intraobserver repeatability. *Indicates performance was significantly different by <0.05, **indicates significantly different by <0.01, and ***indicates significance <0.001.
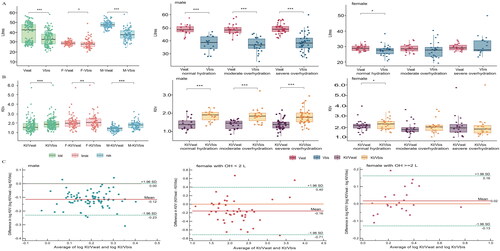
Figure 2. Correlations between mean differences in urea distribution volume (V) measured by the Watson formula (Vwat) versus bioimpedance spectroscopy (Vbis) in relation to overhydration values (OH).
To evaluate the consistency between Kt/Vwat and Kt/Vbis, Bland–Altman agreement analysis was employed (). The specific Bland–Altman statistics are shown in Supplementary Table 1. As shown in , the calculated mean of the differences between log Kt/Vwat and log Kt/Vbis in male patients was −0.12, and the limits of agreement (LOA) between them were 0.001 and −0.23. The mean of the differences significantly differed from zero, which was the predicted value if the two indicators were identical (p < 0.0001). The female patients were categorized into two groups according to OH values. In the female patients with OH <2 L (), the calculated mean of the differences between Kt/Vwat and Kt/Vbis was −0.16, and the LOA between them was 0.40 and −0.71. This means that the Kt/Vwat value may be 0.40 above or 0.71 below the Kt/Vbis value, which would be unacceptable for clinical purposes. Similarly, the mean of the differences was not significantly close to zero (p = 0.004). These results showed that the two indicators were not consistent with each other in female patients with OH <2 L and male patients. However, in the female patients with OH > =2 L (), the calculated mean of the differences between log Kt/Vwat and log Kt/Vbis was 0.02, and the 95% confidence interval (−0.02, 0.05) included zero (Supplementary Table 1). The mean of the differences was close to zero (p = 0.27), which suggested that the two indicators could be considered consistent in female patients with OH > =2 L.
A total weekly Kt/V of at least 1.7 [Citation13–15] was once defined as an adequate clearance of small uremic solutes. According to this, we divided the study population by the Kt/V values: group Wat-inadequate—patients with a Kt/Vwat value <1.7; group Wat-adequate—patients with a Kt/Vwat value > =1.7; group Bis-inadequate—patients with a Kt/Vbis value <1.7; and group Bis-adequate—patients with a Kt/Vbis value > =1.7. The laboratory characteristics and questionnaire data of the population are presented and compared between the Wat-inadequate and Wat-adequate groups and the Bis-inadequate and Bis-adequate groups (). Compared to the Wat-inadequate and Bis-inadequate groups, CrCl and serum calcium were higher in both the Wat-adequate and Bis-adequate groups, whereas cystatin C, homocysteine and procalcitonin were significantly lower. Albumin and serum potassium were significantly higher in the Wat-adequate group than in the Wat-inadequate group. The hemoglobin level in the Bis-adequate group was higher than that in the Bis-inadequate group. The serum phosphorus, PTH and β2-MG levels of patients in the Bis-adequate group were much lower than those in the Bis-inadequate group. Some PD patients were also routinely investigated by questionnaires during the assessments of dialysis adequacy in our center. We only found that the role-emotional (RE) score of the SF-36 was better in both the Wat-adequate and Bis-adequate groups than in the Wat-inadequate and Bis-inadequate groups. Moreover, the RE score was positively correlated with Kt/Vwat (r = 0.35, p = 0.01; Supplementary Figure 1(A)) and Kt/Vbis (r = 0.40, p = 0.003; Supplementary Figure 1(B)). The mental component summary score was also positively correlated with Kt/Vbis (r = 0.28, p = 0.04; Supplementary Figure 1(C)), but not with Kt/Vwat.
Table 2. The clinical parameters and questionnaire data of the study population and between groups.
There were 59 patients (39.33%) who were considered to have an adequate clearance of small solutes according to both the Kt/Vwat and Kt/Vbis > =1.7. Forty-two patients (28%) were inadequately dialyzed according to both the Kt/Vwat and Kt/V bis <1.7. Differences in dialysis adequacy were observed in 49 patients (32.67%). Among them, 46 patients were inadequately dialyzed according to Kt/Vwat but well dialyzed according to Kt/Vbis. Three patients showed adequate dialysis with Kt/Vwat but inadequate dialysis with Kt/Vbis. To explore which indicator could be used more suitably to reflect dialysis efficacy, the clinical features were compared. Since there were only 3 female patients presenting Kt/Vwat > =1.7 but Kt/Vbis <1.7, we only compared three groups: inadequate group (Kt/Vwat and Kt/Vbis <1.7), adequate group (Kt/Vwat and Kt/Vbis > =1.7), and inconsistent group (Kt/Vwat <1.7 and Kt/Vbis > =1.7) (). The clinical features and questionnaire data of the three groups are presented in the Supplementary Table 2. Comparison of the success rates of clinical features between groups revealed that the success rates of CrCl, cystatin C, serum β2-MG and procalcitonin in the adequate and inconsistent groups were not different but were significantly higher than those in the inadequate group ().
Table 3. Comparison of clinical parameters associated with dialysis and Kt/V differences.
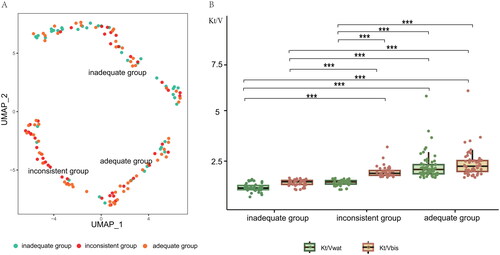
We next performed a UMAP analysis based on the dataset of clinical features from patients in the three groups (). UMAP analysis demonstrated that patients from the adequate group and inconsistent group tended to cluster together, suggesting that their clinical features were similar (). However, another cluster containing the majority of patients from the inadequate group was separated from the adequate group and inconsistent group, indicating an overall difference in the clinical features between the inadequate group and the other two groups (). Notably, the Kt/Vwat was significantly lower than the Kt/Vbis in the inconsistent group, and not different from the Kt/Vwat and Kt/Vbis in the inadequate group (). In addition, we also performed the UMAP analysis based on the clinical features that were statistically different between the groups. The results also indicated that patients from the adequate group were separated from the adequate group, and tended to cluster with inconsistent group (Supplementary Figure 3).
Figure 3. (A) Uniform manifold approximation and projection (UMAP) clusters for two-dimensional reduced representation of the clinical parameters; (B) the Kt/V measured by the Watson formula (Kt/Vwat) was significantly lower than by bioimpedance spectroscopy (Kt/Vbis) in the inconsistent group, and not different from Kt/Vwat and Kt/Vbis in the inadequate group. Inadequate group: PD patients with Kt/Vwat and Kt/Vbis <1.7; adequate group: PD patients with Kt/Vwat and Kt/Vbis > =1.7; Inconsistent group: PD patients with Kt/Vwat <1.7 and Kt/Vbis > =1.7. ***Indicates performance was significantly different by <0.001.
Discussion
Weekly Kt/V is frequently used to assess the clearance of small uremic solutes. However, the estimation of V makes the calculation of Kt/V less accurate. V usually can be determined by three approaches: dilution of isotopes of water, BIS and anthropometric equations, most commonly the Watson formula in adults. Isotopic methods are considered the gold standard but are not practical in the clinic [Citation16]. In recent years, the BIS technique has been widely used in PD centers. We compared the Watson formula and BIS in the present study to investigate which method could be more suitable for the calculation of Kt/V to assess the clearance of small uremic solutes more accurately.
In a previous observational study of 74 patients on PD, the volume was also 2.15 L higher measured by the Watson formula than with BIS [Citation17]. The difference between the measurements was associated with the presence of diabetes mellitus, hypertension, hypoalbuminemia, obesity, malnutrition, inflammation and the absence of residual diuresis [Citation17]. Davenport et al. conducted an investigation to determine whether ethnicity could affect estimates of PD adequacy [Citation16]. In the study, TBW was also calculated to be higher using the Watson formula than that measured by BIS for all ethnic groups apart from African/Afro-Caribbeans, with the greatest difference between Vwat and Vbis being 12.3 ± 0.6% for South Asians. The increased difference in the South Asian group was explained by the different body compositions, which are characterized by relatively more adipose tissue [Citation18,Citation19]. In our PD unit, we also observed that the TBW values obtained by the Watson formula overestimated patient volume compared with the BIS results. A negative correlation between OH values and mean Vwat-Vbis was also found. The Watson formula depends on body weight, but body weight cannot fully reflect the hydration status. In our study, the difference between Vwat and Vbis was relatively smaller in the female patients than in the male patients (Supplementary Figure 2). Vwat even tended to be lower than Vbis in female patients with OH values greater than 2 L. If the OH value could reach 18.37 L, Vwat might also be lower than Vbis in male patients. However, this extreme situation is rare in the clinic.
As a result of the differences in TBW measured by the two methods, the calculated Kt/V also varied. The Bland–Altman analysis indicated that the Kt/V values measured by the two methods in female patients with OH less than 2 L and male patients were in disagreement. A total of 30.67% of our patients had a Kt/Vwat lower than 1.7, whereas the Kt/Vbis values were greater than or equal to 1.7. In these patients, the inconsistency between the Kt/Vwat and Kt/Vbis made it difficult to assess the small-solute dialysis adequacy. Thus, we tried to determine which method was more accurate. Through UMAP analysis, we found that the clinical features of patients from the inconsistent group were similar to those of the adequate group and exhibited an overall difference from those of the inadequate group.
Additionally, the success rates of CrCl, cystatin C, serum β2-MG and procalcitonin in the inconsistent group were also found to be closer to those in the adequate group and significantly higher than those in the inadequate group. CrCl, serum cystatin C, β2-MG and procalcitonin have all been reported to be associated with the adequacy of PD [Citation8,Citation10,Citation11]. Cystatin C is a low molecular weight protein (13.2 kD) that should be easily dialyzable with high-flux hemodialysis and the peritoneum in PD patients [Citation11]. Serum cystatin C was shown to be a good marker for the estimation of RRF in PD patients [Citation20]. A cross-sectional study of cystatin C in anephric PD patients also showed a significant negative correlation between cystatin C and weekly Kt/V [Citation11]. Serum procalcitonin is also considered an indirect marker to evaluate the adequacy of dialysis [Citation8]. The serum levels of procalcitonin in PD patients were found to be significantly higher than the levels in healthy controls [Citation9] and negatively correlated with Kt/V and estimated glomerular filtration rate [Citation8]. Since a total weekly Kt/V of at least 1.7 was once defined as an adequate clearance of small uremic solutes, we also divided patients into adequate and inadequate groups based on the Kt/Vwat and Kt/Vbis values, respectively. We found compared to the Wat-inadequate and Bis-inadequate groups, the CrCl, serum cystatin C and procalcitonin were better in both the Wat-adequate and Bis-adequate groups. However, only when grouped according to the Kt/Vbis values, the levels of serum phosphorus, β2-MG, hemoglobin and PTH were significantly improved in the adequate group than those in the inadequate group. Based on these results, we considered that the Kt/Vbis might be more suitable to assess the adequacy of PD, especially in the situation in which patients have no obvious clinical symptoms but have a Kt/Vwat <1.7 and Kt/Vbis > =1.7. The use of Vwat might cause a patient to receive an excessive dialysis dose in some cases.
Several limitations of our study should be mentioned. This single center design limits external generalizability, as our study only included Chinese PD individuals. However, a previous study demonstrated that the difference between Vwat and Vbis varied among different races. Therefore, the results of our study may only be applied to East Asians. In addition, most of the PD patients we included had a normal volume or moderate overhydration. The sample size of patients with severe overhydration was relatively small, so further studies with a higher number of PD patients with severe overhydration are needed to validate our results. Moreover, to discern whether the Vbis is more suitable than Vwat to calculate the Kt/V, a large prospective cohort is needed to demonstrate the association of Kt/Vbis and Kt/Vwat with the clinical outcomes of PD patients, such as comorbid illness and patient survival.
In conclusion, Vwat is generally significantly higher than Vbis in our population, and the differences between Vwat and Vbis are associated with hydration status. The Kt/V calculated by the Vwat may underestimate small solute-clearance dialysis adequacy. We suggest that if PD patients have no obvious uremic symptoms, Kt/Vbis might be more suitable to be accounted for in creating individualized dialysis prescriptions. Future prospective studies are needed that analyze the relationship of Kt/Vwat and Kt/Vbis with long-term clinical outcomes in PD patients.
Ethical approval
The study was conducted according to the guidelines of the Declaration of Helsinki and approved by the Ethical Committee of Nanjing Drum Tower Hospital (no. 2022-042-01).
Author contributions
Sixiu Liu, Yuan Feng and Chunming Jiang designed the study. Sixiu Liu and Yuan Feng collected the clinical data of patients and drafted the manuscript. Sixiu Liu performed statistical analyses. Jian Lu, Nan Li and Ying Liu checked and revised the article. All authors read and approved the final manuscript.
Supplemental Material
Download PDF (1 MB)Acknowledgements
We are grateful to all participants and the nurses of the PD center for their efforts and contributions to this research.
Disclosure statement
No potential conflict of interest was reported by the author(s).
Data availability statement
Data underlying this article will be shared on reasonable request to the corresponding author.
Additional information
Funding
References
- Brown EA, Blake PG, Boudville N, et al. International society for peritoneal dialysis practice recommendations: prescribing high-quality goal-directed peritoneal dialysis. Perit Dial Int. 2020;40(3):1–8. doi: 10.1177/0896860819895364.
- Hansson JH, Watnick S. Update on peritoneal dialysis: core curriculum 2016. Am J Kidney Dis. 2016;67(1):151–164. doi: 10.1053/j.ajkd.2015.06.031.
- Daugirdas JT. Simplified equations for monitoring Kt/V, PCRn, eKt/V, and ePCRn. Adv Ren Replace Ther. 1995;2(4):295–304. doi: 10.1016/s1073-4449(12)80028-8.
- Watson PE, Watson ID, Batt RD. Total body water volumes for adult males and females estimated from simple anthropometric measurements. Am J Clin Nutr. 1980;33(1):27–39. doi: 10.1093/ajcn/33.1.27.
- Earthman C, Traughber D, Dobratz J, et al. Bioimpedance spectroscopy for clinical assessment of fluid distribution and body cell mass. Nutr Clin Pract. 2007;22(4):389–405. doi: 10.1177/0115426507022004389.
- Myles PS, Cui J. Using the Bland-Altman method to measure agreement with repeated measures. Br J Anaesth. 2007;99(3):309–311. doi: 10.1093/bja/aem214.
- Morais JG, Pecoits-Filho R, Canziani MEF, et al. Fluid overload is associated with use of a higher number of antihypertensive drugs in hemodialysis patients. Hemodial Int. 2020;24(3):397–405. doi: 10.1111/hdi.12829.
- Wang B, Gao C, Chen Q, et al. The relationship between serum procalcitonin and dialysis adequacy in peritoneal dialysis patients. Iran J Public Health. 2021;50(3):502–509.
- Opatrná S, Klaboch J, Opatrný K, Jr., et al. Procalcitonin levels in peritoneal dialysis patients. Perit Dial Int. 2005;25(5):470–472. doi: 10.1177/089686080502500511.
- Amici G, Virga G, Da Rin G, et al. Serum beta-2-microglobulin level and residual renal function in peritoneal dialysis. Nephron. 1993;65(3):469–471. doi: 10.1159/000187533.
- Al-Malki N, Heidenheim PA, Filler G, et al. Cystatin C levels in functionally anephric patients undergoing dialysis: the effect of different methods and intensities. Clin J Am Soc Nephrol. 2009;4(10):1606–1610. doi: 10.2215/CJN.02910509.
- McInnes L, Healy J. UMAP: Uniform Manifold Approximation and Projection for Dimension Reduction. J Open Source Softw. 2018;3(29):861.
- Paniagua R, Amato D, Vonesh E, et al. Effects of increased peritoneal clearances on mortality rates in peritoneal dialysis: ADEMEX, a prospective, randomized, controlled trial. J Am Soc Nephrol. 2002;13(5):1307–1320. doi: 10.1681/ASN.V1351307.
- Lo WK, Bargman JM, Burkart J, et al. Guideline on targets for solute and fluid removal in adult patients on chronic peritoneal dialysis. Perit Dial Int. 2006;26(5):520–522. doi: 10.1177/089686080602600502.
- Lo WK, Ho YW, Li CS, et al. Effect of Kt/V on survival and clinical outcome in CAPD patients in a randomized prospective study. Kidney Int. 2003;64(2):649–656. doi: 10.1046/j.1523-1755.2003.00098.x.
- Davenport A, Hussain Sayed R, Fan S. The effect of racial origin on total body water volume in peritoneal dialysis patients. Clin J Am Soc Nephrol. 2011;6(10):2492–2498. doi: 10.2215/CJN.04130511.
- Martínez Fernández G, Ortega Cerrato A, de la Vara Iniesta L, et al. Comparison of bioimpedance spectroscopy and the watson formula for measuring body volume in patients on peritoneal dialysis. Nefrologia. 2016;36(1):57–62. doi: 10.1016/j.nefroe.2016.02.002.
- Whincup PH, Nightingale CM, Owen CG, et al. Early emergence of ethnic differences in type 2 diabetes precursors in the UK: the child heart and health study in England (CHASE study). PLoS Med. 2010;7(4):e1000263. doi: 10.1371/journal.pmed.1000263.
- Spalding EM, Chandna SM, Davenport A, et al. Kt/V underestimates the hemodialysis dose in women and small men. Kidney Int. 2008;74(3):348–355. doi: 10.1038/ki.2008.185.
- Yang Q, Li R, Zhong Z, et al. Is cystatin C a better marker than creatinine for evaluating residual renal function in patients on continuous ambulatory peritoneal dialysis? Nephrol Dial Transplant. 2011;26(10):3358–3365. doi: 10.1093/ndt/gfr045.