
Abstract
Background
The effect of tacrolimus (TAC) on oxidative stress after kidney transplantation (KT) is unclear. This study aimed to evaluate the influence of TAC trough levels of oxidative stress status in Tunisian KT patients during the post-transplantation period (PTP).
Methods
A prospective study including 90 KT patients was performed. TAC whole-blood concentrations were measured by the microparticle enzyme immunoassay method and adjusted according to the target range. Plasma levels of oxidants (malondialdehyde (MDA) and advanced oxidation protein products (AOPP)) and antioxidants (ascorbic acid, glutathione (GSH), glutathione peroxidase (GPx), and superoxide dismutase (SOD)) were measured using spectrophotometry. The subjects were subdivided according to PTP into three groups: patients with early, intermediate, and late PT. According to the TAC level, they were subdivided into LL-TAC, NL-TAC, and HL-TAC groups.
Results
A decrease in MDA levels, SOD activity, and an increase in GSH levels and GPx activity were observed in patients with late PT compared to those with early and intermediate PT (p < 0.05). Patients with LL-TAC had lower MDA levels and higher GSH levels and GPx activity compared with the NL-TAC and HL-TAC groups (p < 0.05).
Conclusion
Our results have shown that in KT patients, despite the recovery of kidney function, the TAC reduced but did not normalize oxidative stress levels in long-term therapy, and the TAC effect significantly depends on the concentration used.
Introduction
Kidney transplant (KT) is the preferred therapeutic choice for patients with severe chronic kidney disease [Citation1]. This discipline has evolved tremendously over the past 50 years. Moreover, compared to maintenance dialysis, KT confers a potential advantage regarding the quality of life, the chances of survival rate of the patients, and even cost reduction [Citation2]. Various immuno suppressive drugs are used in solid organ transplantation to help prevent rejection [Citation3]. OPTN/SRTR data showed that the vast majority of KT recipients (approximately 95%) are treated with tacrolimus (TAC) as maintenance immunosuppressive regimens in clinical practice today [Citation4].
TAC (FK-506) is a macrocyclic lactone extracted from the fermentation broth of Streptomyces tsukubaensis. It is also called a calcineurin inhibitor [Citation5]. The clinical use of TAC is complicated due to its narrow therapeutic range and significant pharmacokinetics variability on both the inter- and intra-patient [Citation6]. Hence, an individual dose adjustment is necessary to achieve an early and stable therapeutic trough level within the target range to maximize efficiency while limiting drug-associated toxicity [Citation6]. A sub-therapeutic level during the early post-transplantation period (PTP) increases the risk of rejection, while a supra-therapeutic level is linked to some complications such as nephrotoxicity, neurotoxicity, kidney arteriolar hyalinosis, vasoconstriction and ischemia, interstitial fibrosis and tubular atrophy, apoptosis, and atrophy [Citation7, Citation8].
TAC-induced toxicity involves a variety of mechanisms. The oxidative stress inducted by TAC on kidney cells is suggested as a common mechanism [Citation9]. As we well know, oxidative stress is an outcome of an imbalance between the excessive generation of oxidative products and antioxidant status. This imbalance is the primary event that affects not only the early phase post-KT but even the kidney graft and long-term patient outcomes [Citation10]. Oxidative stress contributes to elevated cardiovascular damage and nephropathy chronic allograft, which are characterized by progressive loss in kidney function [Citation11].
More crucially, current data about oxidative stress after KT is conflicting, and the prooxidant effect of TAC after KT is not clearly understood. Some investigations demonstrate that TAC has a beneficial impact on oxidative stress levels as antioxidant properties [Citation12–16]. However, others have incriminated the prooxidant effect of this calcineurin inhibitor and showed a higher oxidative status after TAC treatment [Citation17–19].
The present study aims to examine the effect of TAC on oxidative stress status in Tunisian KT patients with stable kidney function. For this purpose, oxidation damage markers were investigated according to (i) the post-transplantation period (PTP) to investigate the effect of long-term TAC use on oxidative status and (ii) TAC trough level to study the effect of TAC trough level on oxidative stress.
Materials and methods
Participants
A prospective, observational, single-centre analysis was performed between March 2020 and March 2021 on Tunisian KT patients. The study included patients who (1) were at least 18 years old, (2) had undergone KT for at least three months, and (3) received a TAC oral dose (Prograf) every day. This dose was adjusted to the trough level according to target ranges [Citation20]. Yet, patients with hypersensitivity to TAC and pregnant or breastfeeding women were excluded from the study.
The experimental protocol was approved according to the ethical standards established by the Declaration of Helsinki. All subjects provided written informed consent to participate in this study.
Data collection
Sociodemographic (age, gender, and weight) and clinical (daily TAC dose, duration of therapy, time of blood collection, drugs administered with TAC, pathological antecedents, and period after KT) characteristics of the KT patients, were collected from the hospital data system.
The PTP is estimated by the difference between the KT date and the blood draw date. Early PT is defined as PTP ˂ 1 year. Intermediate PT is defined as PTP between 1–5 years. Late PT is defined as PTP > 5 years.
Collection and storage of blood
For each patient, two blood samples were collected in heparinized tubes at a steady state (at least 48 h after the start of treatment) and before the morning TAC dose: one was used for the determination of the TAC trough level, and the other was centrifuged at 4042 g for 10 min. Then, the plasma was stored at −80 °C in a small aliquot till the analysis of oxidative stress parameters.
Measurement of tacrolimus trough level
TAC whole-blood concentrations were measured by the microparticle enzyme immunoassay method based on the INDIKO® (thermo scientific) analyzer. The therapeutic target ranges were: 10–15 ng/ml in the first six months after KT and 7–10 ng/ml beyond. Accordingly, patients were divided into low-level TAC (LL-TAC), normal-level TAC (NL-TAC) and high-level TAC (HL-TAC) groups.
Measurement of oxidant levels
The MDA level, a by-product of lipid peroxidation, was estimated in plasma by the TBARS method [Citation21]. MDA reacts with Thiobarbituric Acid (TBA) under acidic conditions, producing a pink-colored complex measurable spectrophotometrically at 532 nm. The plasmatic MDA level was expressed as nmol MDA/mg of protein.
The level of protein oxidation index, known as AOPP, was determined at 340 nm using the method described by Kayali et al. [Citation22]. The concentration of AOPP in plasma was expressed as nmol AOPP/mg of protein using a molar extinction coefficient of 261 mM−1cm−1.
Measurement of antioxidant levels
The ascorbic acid (vitamin C) level, a potent reducing agent, was determined based on the Jacota and Dani’s method [Citation23]. It reacts with the Folin reagent to create a blue-colored complex, which can be measured spectrophotometrically at 769 nm. The amount of ascorbic acid in plasma was expressed as ng of ascorbic acid per mg of protein.
The GSH level was determined at 412 nm using Ellman’s reagent (DTNB) [Citation24]. Plasmatic GSH level was expressed as nmol GSH/mg protein.
Plasmatic GPx activity was assayed using the Flohé and Günzler method [Citation25]. GPx oxidizes GSH in the presence of DTNB, and the activity was expressed as nmol of GSH consumed/min/mg protein at 412 nm.
The activity of SOD was indirectly measured using the Beauchamp and Fridovich method [Citation26]. The blue-colored formazan, the result of nitroblue tetrazolium (NBT) photoreduction by superoxide anion (O2•−), was tracked at 580 nm. One unit of SOD activity caused a 50% inhibition of the rate of NBT photoreduction. The activity of plasmatic SOD was expressed as µmol O2•− consumed/min/mg of protein.
Statistical analysis
The analysis was performed using the IBM SPSS program (version 23). Figures were plotted using GraphPad Prism (version 6.01). Qualitative variables were presented as a number with frequency. Quantitative variables were displayed as mean ± standard error mean (SEM). All statistical comparisons were performed using Tukey’s test. The Pearson correlation coefficient was used to determine the relationship between the two variables. p < 0.05 indicated significance.
Results
Study population characteristics
In our study, we included 141 TAC assays performed on 90 KT patients. The mean age of KT patients was 39.92 ± 0.91 years; the mean weight was 61.16 ± 0.89 kg. There were 46 females and 44 males (sex ratio = 0.95). The TAC posology was 3.46 ± 0.19 mg/day; the PTP was 5.17 ± 0.40 years. Sixteen patients had a prior history of cardiovascular diseases, while eight had a history of infectious diseases. Drugs associated with TAC are as follows: immunosuppressants (azathioprine, mycophenolate mofetil (MMF), prednisolone) in 87 patients; systemic antibiotics (isoniazid, rifampicin, cotrimoxazole, clarithromycin, azithromycin) in 20 patients; antihypertensive (amlodipine, captopril, enalapril, aspirin) in 14 patients; drug metabolism (metformin, glimepiride, levothyroxine) in 12 patients; antiepileptic (sodium valproate, carbamazepine) in three patients; and antiulcer (esomeprazole, omeprazole) in two patients, each.
Tacrolimus trough level
The average number of TAC trough level measurements per patient was 1.56, with a mean concentration of 7.023 ± 0.37 ng/ml (range: 1–28).
Sociodemographic and clinical variables in KT patients according to PTP are presented in . There were no statistically significant differences in age, sex, weight, and TAC Posology.
Table 1. Sociodemographic and clinical characteristics in kidney transplant patients.
For 141 TAC trough level values, 25, 54, and 62 were analyzed during early, intermediate, and late PT, respectively. Only 25.27% of the KT patients have NL-TAC (33.33%, 36.36%, and 13.95% during early, intermediate, and late PT phase, respectively) ().
Oxidative stress profile and post kidney transplantation period
The results showed significantly increased MDA levels in patients with early and intermediate PT compared to patients with late PT (p = 0.001, p < 0.001, respectively; ). In contrast, no significant differences were observed between sub-groups concerning AOPP and ascorbic acid levels ( and , respectively).
Figure 1. Oxidant and anti-oxidant plasma levels in kidney transplant patients based on post-transplantation period. Comparison between patients with early PT (PTP ˂ 1 year), intermediate PT (PTP between 1–5 years), and late PT (PTP > 5 years). (A) Comparison with MDA level. (B) Comparison with AOPP level. (C) Comparison with ascorbic acid level. (D) Comparison with GSH level. (E) Comparison with GPx activity. (F) Comparison with SOD activity. Tukey’s test applied for the comparisons. Each column represents mean ± SEM. *p<0.05, compared patients with early PT to patients with late PT. #p<0.05, compared patients with intermediate PT to patients with late PT.
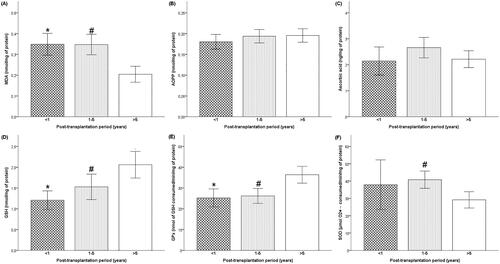
Compared to patients with late PT, GSH level, and GPx activity were more significantly decreased in patients with early than intermediate PT ( and , respectively). Furthermore, the SOD activity was higher in intermediate PT patients’ plasma compared to late PT patients (p = 0.019; ).
Oxidative stress profile and tacrolimus trough levels
Plasmatic MDA level was significantly reduced in the LL-TAC group compared with NL-TAC and HL-TAC groups (p< 0.001, p = 0.005, respectively), while it only disclosed a downward trend in the NL-TAC group than that in HL-TAC group (p = 0.978) (). However, AOPP and ascorbic acid levels varied insignificantly in KT patients accordingly to TAC trough level (, respectively).
Figure 2. Oxidant and anti-oxidant plasma levels in kidney transplant patients based on tacrolimus trough levels. Comparison between low-level TAC (LL-TAC), normal-level TAC (NL-TAC) and high-level TAC (HL-TAC) groups. (A) Comparison with MDA level. (B) Comparison with AOPP level. (C) Comparison with ascorbic acid level. (D) Comparison with GSH level. (E) Comparison with GPx activity. (F) Comparison with SOD activity. Tukey’s test applied for the comparisons. Each column represents mean ± SEM. *p<0.05, compared the low-level TAC group to the high-level TAC group. #p<0.05, compared the normal-level TAC group to the high-level TAC group.
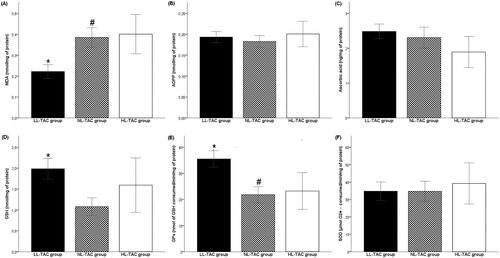
Concerning GSH and GPx antioxidants, patients with LL-TAC had higher GSH levels and GPx activity compared with the NL-TAC group (p< 0.001) (). Moreover, compared with the HL-TAC group, the LL-TAC group had significantly elevated GPx activity (p = 0.011) (). However, SOD activity did not differ between TAC trough-level variability groups (). The comparison of SOD activity between LL-TAC and NL-TAC groups demonstrated similar means.
Correlation studies
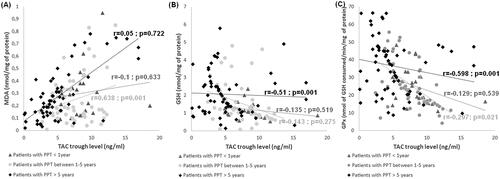
The correlation study was conducted between oxidative stress markers and TAC trough level according to PTP. TAC trough level was significantly linked with plasma MDA level and GPx activity in patients with intermediate PT (r = 0.638, p = 0.001; r=-0.297, p = 0.021, respectively; , respectively). Besides, TAC trough level was significantly associated with GSH level and GPx activity in patients with late PT (r=−0.51, p = 0.001; r=−0.589, p = 0.001, respectively; , respectively). For patients with early PT no significant correlations were found between TAC trough level and parameters of oxidative stress ().
Figure 3. Correlations analyses between oxidative stress markers and tacrolimus trough levels according to post-transplantation period. (A) Correlation between MDA level and tacrolimus trough level. (B) Correlation between GSH level and tacrolimus trough level. (C) Correlation between GPx activity and tacrolimus trough level.
Discussion
After KT, TAC is commonly used as a cornerstone immunosuppressive treatment [Citation4]. However, its use in medicine is complicated due to the narrow therapeutic index and large intra- and interindividual pharmacokinetic variability [Citation6]. Even when levels of TAC are within the therapeutic range, some patients undergo rejection or toxicity. The mechanisms underlying TAC toxicity are still not well understood. Some reports have indicated that the influence of TAC on antioxidant enzyme activities in kidneys may be involved in TAC toxicity [Citation9, Citation27]. The role of TAC in oxidative stress is not entirely clear [Citation12–19]. Moreover, uncertainty exists concerning oxidative status determination in patients with KT. Decreasing complications related to TAC without affecting efficacy is the goal of post-KT management. Furthermore, the effect of TAC on oxidative status in KT patients is currently the object of research [Citation28]. The present study shows an increase in oxidative stress during the early postoperative period after KT, thereafter probably decreasing later. Indeed, we found that five years after KT, plasmatic MDA levels and SOD activity were significantly lower compared to those before. However, we observed an increase in the AOPP rates even in the early phase post-KT, but no significant. On the other side, marked increases in GSH level and GPx activity were observed in patients with PTP > 5 years. The higher AOPP value during the post-KT period can potentially serve as an indirect marker for long-term stress on the organism caused by reactive oxygen species (ROS). AOPP, as a sensitive biomarker of macromolecule damage mediated by ROS, reflects the long-term situation in the body in contrast to MDA [Citation29]. The oxidant marker inhibits vasodilation by nitric oxide (NO), promotes lipid peroxidation, and elevates levels of inflammatory molecules and cytokines [Citation30]. Besides, the low SOD activity after the 5th year of KT indicates a persistent source of ROS production. SOD is a key antioxidant enzyme that can be used as a therapeutic agent to treat ROS-mediated diseases [Citation31]. Indeed, the low SOD activity was opted for its inhibition by the high level of ROS [Citation32]. It is to be favorably mentioning that this is the first Tunisian research to measure the variation of oxidative stress markers in patients with KT. Studies on oxidative status after KT mainly involved a shorter period than our trial. For instance, 28-day research described lipid peroxidation products (TBARS) decreased, and SOD and GPx activities increased in the post-KT period [Citation33]. Another study reported elevated serum TBARS immediately after KT (5 days), which decreased one year after KT [Citation34]. Likewise, findings of de Cal M et al. show a decrease in AOPP level at 48 h after KT, achieving values similar to controls; thereafter, it increased and returned to nearly the value before KT 3 months after KT [Citation35]. J Vostálová et al. observed a decrease in MDA and AOPP levels and SOD activity and an increase in GSH level and CAT activity over one year after KT [Citation29].
According to our results, we assume that long-term TAC therapy likely contributes to enhanced ROS formation even if the graft function is normal. The increased oxidative stress in KT patients has a double reason. First, there is a reduction of uremic toxins concentration during transplantation, which is a factor of inflammation per se [Citation27, Citation36]. Second, the infiltration of inflammatory cells and the production of proinflammatory cytokines induced by TAC therapy [Citation27, Citation36].
To investigate the relationship between disturbed oxidative profiles in KT patients and the trough levels of TAC, the oxidant/antioxidant statuses were comparatively analyzed in low, high, and normal TCA level groups. For this purpose, we revealed that TAC had an offensive effect on oxidative stress markers in KT patients; this effect was more marked in the HL-TAC and NL-TAC groups than in the LL-TAC group. Interestingly, decreased MDA levels, increased GSH levels, and GPx activity were observed in the LL-TAC group compared with the HL-TAC and NL-TAC groups. This result was confirmed by the positive correlation between the TAC trough level and MDA level and by the negative link between the TAC trough level and GSH, level as well as GPx activity, in patients with KT for more than one year. Our findings are in coherence with the study by Ferjani H et al. that showed oxidative damage in HCT116 cells treated with TAC and MMF at high concentrations (25 µM and 330 µM, respectively) [Citation37]. On the other hand, they found that TAC at low concentration (5 µM) presents a cytoprotective effect against MMF (330 µM) toxicity [Citation37]. The observed protective effect of TAC at low concentrations seems to agree with earlier reports in other cell lines [Citation12–16]. S Kato et al. found that TAC prevents indomethacin-induced small intestinal ulcers in rats by decreasing myeloperoxidase activity and MDA levels [Citation12]. Furthermore, Gabryel et al. revealed the neuroprotective impact of TAC against oxidative stress on the nervous tissue after ischemia, accompanied by increased GSH levels and decreased MDA levels on ischemically injured glial cells [Citation14]. Also, TAC has a cardioprotective effect on myocardial damage induced by ischemia-reperfusion, with a reduction of superoxide radical formation [Citation16].
In light of our data, we have found that in KT patients, despite the recovery of kidney function, the TAC reduced but did not normalize oxidative stress levels in long-term therapy. In addition, we have shown that the TAC effect significantly depends on the concentration used. Nevertheless, oxidative stress is a major contributor to TAC toxicity at high concentrations. However, cellular mechanisms of the cytoprotective effect of TAC are poorly understood. A study on human neuroblastoma cell lines reported that the protective effect of TAC against oxidative damage is associated with ceramide release reduction and c-Jun activation [Citation38]. Other analyses have indicated that TAC inhibits a rise of the intracellular Ca2+ level and can prevent DNA fragmentation, release of cytochrome c, and caspase-3 activation [Citation39–41].
Conclusion
In conclusion, our single-center analysis shows that TAC has a significant impact on the oxidative stress levels of KT patients, particularly at higher concentrations and during early treatment. Monitoring the levels of oxidative stress markers can be used as a potential therapeutic approach for controlling KT disease or as a preventive measure. Further research on a larger scale is necessary to confirm these findings and to compare oxidative markers in pre- and post-KT patients.
Authors’ contributions
All authors contributed to the design and implementation of the research, the analysis of the results, and the writing of the manuscript.
Disclosure statement
The authors declare that they have no conflict of interest.
Additional information
Funding
References
- Ghojogh MG, Salarilak S, Afshari AT, et al. Impact of type of donor on graft and patient survival rate in kidney transplanted patients in Iran. J Renal Inj Prev. 2018;7(4):1–7. doi: 10.15171/jrip.2018.59.
- Chaudhry D, Chaudhry A, Peracha J, et al. Survival for waitlisted kidney failure patients receiving transplantation versus remaining on waiting list: systematic review and meta-analysis. BMJ. 2022;376:e068769. doi: 10.1136/bmj-2021-068769.
- Tönshoff B. Immunosuppressants in organ transplantation. Handb Exp Pharmacol. 2020;261:441–469.
- Lentine KL, Smith JM, Hart A, et al. OPTN/SRTR 2020 annual data report: kidney. Am J Transplant. 2022;22 Suppl 2(2):21–136. doi: 10.1111/ajt.16982.
- Dheer, D, Gupta, PN, Shankar, R, et al. Tacrolimus: an updated review on delivering strategies for multifarious diseases. Eur J Pharm Sci. 2018;114:217–227. doi: 10.1016/j.ejps.2017.12.017.
- Degraeve AL, Moudio S, Haufroid V, et al. Predictors of tacrolimus pharmacokinetic variability: current evidences and future perspectives. Expert Opin Drug Metab Toxicol. 2020;16(9):769–782. doi: 10.1080/17425255.2020.1803277.
- Nguyen TVA, Nguyen HD, Nguyen TLH, et al. Higher tacrolimus trough levels and time in the therapeutic range are associated with the risk of acute rejection in the first month after renal transplantation. BMC Nephrol. 2023;24(1):131. doi: 10.1186/s12882-023-03188-0.
- Ferjani H, El Arem A, Bouraoui A, et al. Protective effect of mycophenolate mofetil against nephrotoxicity and hepatotoxicity induced by tacrolimus in wistar rats. J Physiol Biochem. 2016;72(2):133–144.
- Gyurászová M, Gurecká R, Bábíčková J, et al. Oxidative stress in the pathophysiology of kidney disease: implications for noninvasive monitoring and identification of biomarkers. Oxid Med Cell Longev. 2020;2020:5478708–5478711. doi: 10.1155/2020/5478708.
- Ruiz MC, Medina A, Moreno JM, et al. Relationship between oxidative stress parameters and atherosclerotic signs in the carotid artery of stable renal transplant patients. Transplant Proc. 2005;37(9):3796–3798. doi: 10.1016/j.transproceed.2005.10.057.
- Nafar M, Sahraei Z, Salamzadeh J, et al. Oxidative stress in kidney transplantation: causes, consequences, and potential treatment. Iran J Kidney Dis. 2011;5(6):357–372.
- Kato S, Nishio H, Ogura M, et al. Tacrolimus (FK506), an immunosuppressive agent, prevents indomethacin-induced small intestinal ulceration in the rat: inhibition of inducible nitric oxide synthase expression. J Pharmacol Sci. 2007;103(1):40–47. doi: 10.1254/jphs.fp0061181.
- Sahin S, Ozakpinar OB, Ak K, et al. The protective effects of tacrolimus on rat uteri exposed to ischemia-reperfusion injury: a biochemical and histopathologic evaluation. Fertil Steril. 2014;101(4):1176–1182. doi: 10.1016/j.fertnstert.2013.12.044.
- Gabryel B, Toborek T, Małecki A. Immunosuppressive immunophilin ligands attenuate damage in cultured rat astrocytes depleted of glutathione and exposed to simulated ischemia in vitro. Comparison with N-acetylcysteine. Neurotoxicology. 2005;26(3):373–384. doi: 10.1016/j.neuro.2005.03.004.
- Ko MS, Choi YH, Jung SH, et al. Tacrolimus therapy causes hepatotoxicity in patients with a history of liver disease. Int J Clin Pharmacol Ther. 2015;53(5):363–371. doi: 10.5414/CP202226.
- Li X, Bilali A, Qiao R, et al. Association of the PPARγ/PI3K/akt pathway with the cardioprotective effects of tacrolimus in myocardial ischemic/reperfusion injury. Mol Med Rep. 2018;17:6759–6767.
- Sacher VY, Bejarano PA, Pham SM. Tacrolimus induced hepatotoxicity in a patient with bilateral lung transplant. Transpl Int. 2012;25(10):e111-112–e112. doi: 10.1111/j.1432-2277.2012.01546.x.
- Tuñón MJ, Sánchez-Campos S, Gutiérrez B, et al. Effects of FK506 and rapamycin on generation of reactive oxygen species, nitric oxide production and nuclear factor kappa B activation in rat hepatocytes. Biochem Pharmacol. 2003;66(3):439–445. doi: 10.1016/s0006-2952(03)00288-0.
- Perrea DN, Moulakakis KG, Poulakou MV, et al. Correlation between oxidative stress and immunosuppressive therapy in renal transplant recipients with an uneventful postoperative course and stable renal function. Int Urol Nephrol. 2006;38(2):343–348. doi: 10.1007/s11255-006-0054-x.
- Thishya K, Vattam KK, Naushad SM, et al. Artificial neural network model for predicting the bioavailability of tacrolimus in patients with renal transplantation. PLoS One. 2018;13(4):e0191921. doi: 10.1371/journal.pone.0191921.
- Buege JA, Aust SD. Microsomal lipid peroxidation. Methods Enzymol. 1972;51:302–310.
- Kayali R, Cakatay U, Akçay T, et al. Effect of alpha-lipoic acid supplementation on markers of protein oxidation in post-mitotic tissues of ageing rat. Cell Biochem Funct. 2006;24(1):79–85. doi: 10.1002/cbf.1190.
- Jagota SK, Dani HM. A new colorimetric technique for estimation of vitamin C using folin phenol reagent. Anal Biochem. 1982;127(1):178–182. doi: 10.1016/0003-2697(82)90162-2.
- Weckbecker G, Cory JG. Ribonucleotide reductase activity and growth of glutathione depended mouse leukaemia L 1210 cells in vitro. Cancer Lett. 1988;40(3):257–264. doi: 10.1016/0304-3835(88)90084-5.
- Flohe L, Gunzler WA. Analysis of glutathione peroxidase. Methods Enzymol. 1984;105:114–121.
- Beauchamp C, Fridovich I. Superoxide dismutase: improved as-says and an assay applicable to acrylamide gels. Anal Biochem. 1971;44(1):276–287. doi: 10.1016/0003-2697(71)90370-8.
- Lim SW, Jin L, Piao SG, et al. Inhibition of dipeptidyl peptidase IV protects tacrolimus-induced kidney injury. Lab Invest. 2015;95(10):1174–1185. doi: 10.1038/labinvest.2015.93.
- Simmons EM, Langone A, Sezer MT, et al. Effect of renal transplantation on biomarkers of inflammation and oxidative stress in end-stage renal disease patients. Transplantation. 2005;79(8):914–919. doi: 10.1097/01.tp.0000157773.96534.29.
- Vostálová J, Galandáková A, Svobodová AR, et al. Stabilization of oxidative stress 1 year after kidney transplantation: effect of calcineurin immunosuppressives. Ren Fail. 2012;34(8):952–959. doi: 10.3109/0886022X.2012.699874.
- Witko-Sarsat V, Friedlander M, Capeillere-Blandin C, et al. Advanced oxidation protein products as a novel marker of oxidative stress in uremia. Kidney Int. 1996;49(5):1304–1313. doi: 10.1038/ki.1996.186.
- Younus H. Therapeutic potentials of superoxide dismutase. Int J Health Sci (Qassim). 2018;12(3):88–93.
- Yang W, Li J, Hekimi S. A measurable increase in oxidative damage due to reduction in superoxide detoxification fails to shorten the life span of long-lived mitochondrial mutants of Caenorhabditis elegans. Genetics. 2007;177(4):2063–2074. doi: 10.1534/genetics.107.080788.
- Vural A, Yilmaz MI, Caglar K, et al. Assessment of oxidative stress in the early posttransplant period: comparison of cyclosporine a and tacrolimus-based regimens. Am J Nephrol. 2005;25(3):250–255. doi: 10.1159/000086079.
- Joo DJ, Huh KH, Cho Y, et al. Change in serum lipid peroxide as an oxidative stress marker and its effects on kidney function after successful kidney transplantation. Transplant Proc. 2010;42(3):729–732. doi: 10.1016/j.transproceed.2010.02.033.
- de Cal M, Silva S, Cruz D, et al. Oxidative stress and ‘monocyte reprogramming’ after kidney transplant: a longitudinal study. Blood Purif. 2008;26(1):105–110. doi: 10.1159/000110575.
- Kim HS, Lim SW, Jin L, et al. The protective effect of febuxostat on chronic tacrolimus-induced nephrotoxicity in rats. Nephron. 2017;135(1):61–71. doi: 10.1159/000449289.
- Ferjani H, Achour A, Bacha H, et al. Tacrolimus and mycophenolate mofetil associations: induction of oxidative stress or antioxidant effect? Hum Exp Toxicol. 2015;34(11):1119–1132. doi: 10.1177/0960327115569812.
- Herr I, Martin-Villalba A, Kurz E, et al. FK506 prevents stroke-induced generation of ceramide and apoptosis signaling. Brain Res. 1999;826(2):210–219. doi: 10.1016/s0006-8993(99)01288-3.
- Li P, Nijhawan D, Budihardjo I, et al. Cytochrome c and dATP-dependent formation of apaf-1/caspase-9 complex initiates an apoptotic protease Cascade. Cell. 1997;91(4):479–489. doi: 10.1016/s0092-8674(00)80434-1.
- Kahraman S, Bambrick LL, Fiskum G. Effects of FK506 and cyclosporin a on calcium ionophore-induced mitochondrial depolarization and cytosolic calcium in astrocytes and neurons. J Neurosci Res. 2011;89(12):1973–1978. doi: 10.1002/jnr.22709.
- Cardoso SM, Oliveira CR. The role of calcineurin in amyloid-beta-peptides-mediated cell death. Brain Res. 2005;1050(1–2):1–7. doi: 10.1016/j.brainres.2005.04.078.