
Abstract
Background
Arteriovenous fistula (AVF) is currently the preferred vascular access for hemodialysis patients. However, the low maturation rate of AVF severely affects its use in patients. A more comprehensive understanding and study of the mechanisms of AVF maturation is urgently needed.
Methods and results
In this study, we downloaded the publicly available datasets (GSE119296 and GSE220796) from the Gene Expression Omnibus (GEO) and merged them for subsequent analysis. We screened 84 differentially expressed genes (DEGs) and performed the functional enrichment analysis. Next, we integrated the results obtained from the degree algorithm provided by the Cytohubba plug-in, Molecular complex detection (MCODE) plug-in, weighted gene correlation network analysis (WGCNA), and Least absolute shrinkage and selection operator (LASSO) logistic regression. This integration allowed us to identify CTSG as a hub gene associated with AVF maturation. Through the literature search and Pearson’s correlation analysis, the genes matrix metalloproteinase 2 (MMP2) and MMP9 were identified as potential downstream effectors of CTSG. We then collected three immature clinical AVF vein samples and three mature samples and validated the expression of CTSG using immunohistochemistry (IHC) and double-immunofluorescence staining. The IHC results demonstrated a significant decrease in CTSG expression levels in the immature AVF vein samples compared to the mature samples. The results of double-immunofluorescence staining revealed that CTSG was expressed in both the intima and media of AVF veins. Moreover, the expression of CTSG in vascular smooth muscle cells (VSMCs) was significantly higher in the mature samples compared to the immature samples. The results of Masson’s trichrome and collagen I IHC staining demonstrated a higher extent of collagen deposition in the media of immature AVF veins compared to the mature. By constructing an in vitro CTSG overexpression model in VSMCs, we found that CTSG upregulated the expression of MMP2 and MMP9 while downregulating the expression of collagen I and collagen III. Furthermore, CTSG was found to inhibit VSMC migration.
Conclusions
CTSG may promote AVF maturation by stimulating the secretion of MMP2 and MMP9 from VSMCs and reducing the extent of medial fibrosis in AVF veins by inhibiting the secretion of collagen I and collagen III.
1. Introduction
Vascular access is the lifeline of patients undergoing hemodialysis and is also the Achilles’ heel. Compared to central venous catheters and arteriovenous grafts, the arteriovenous fistula (AVF) is currently the preferred choice for establishing vascular access in hemodialysis patients because of its lower risk of infection and mortality [Citation1,Citation2]. Unfortunately, due to the lack of vascular maturation or spontaneous thrombosis, numerous AVFs fail to develop adequately before being used for hemodialysis, which makes them unsuitable for dialysis [Citation3–6].
AVF maturation depends on the ability of the venous outflow tract to adapt to the increased blood flow caused by AVF creation and thrombosis prevention [Citation7,Citation8]. In a mature AVF, the effect of arteriovenous anastomosis on blood flow results in a structural vascular remodeling response in the vascular wall, such as outward expansion and thickening, which helps maintain blood flow and pressure [Citation9]. The failure of outward remodeling due to medial fibrosis and intimal hyperplasia (IH) in the veins after AVF creation is an important risk factor for immature AVFs [Citation10–12]. However, the specific cellular mechanisms and molecular pathways that cause these pathological changes remain unknown. Uncovering these mechanisms may help develop clinical strategies to facilitate AVF maturation.
In this study, we used bioinformatic analysis to identify differentially expressed genes (DEGs) and found that the gene CTSG was significantly downregulated in immature AVF veins compared to mature AVF veins. We then investigated the underlying mechanisms of CTSG involved in AVF maturation.
2. Materials and methods
2.1. Bioinformatic analysis
Detailed methods are provided in the Supplementary Materials.
The GSE119296 [Citation13] and GSE220796 [Citation14] datasets were downloaded from the Gene Expression Omnibus (GEO; http://www.ncbi.nlm.nih.gov/geo) to select the required samples. By merging the two datasets, we obtained a total of 23 anatomically mature AVF samples and 17 immature AVF samples. Anatomically mature samples were used as normal controls. Ensembl IDs were converted into the corresponding official gene names to annotate the expression matrix. For genes with multiple probe matches, the average expression levels of those probes were calculated to determine the expression level of the gene.
2.2. Human AVF sample collection and processing
The mature and immature AVF tissue samples were collected at the Department of Nephrology of Guangzhou First People’s Hospital. The sample of the juxta-anastomotic outflow vein segments of both mature and immature AVFs collected during the two-stage surgical revision or salvage procedure. We considered AVF veins that could not be used within three months after AVF creation as immature AVF tissue samples and AVF veins that had been used for hemodialysis after AVF creation as mature AVF tissue samples. The basic information of these patients is included in the Supplementary Table S1. The study protocols were approved by the ethics committee of our institution and informed consent was obtained from all participants. The tissues were fixed in 4% formaldehyde and embedded in paraffin.
2.3. Cell culture and transfection
Vascular smooth muscle cells (VSMCs) were cultured in a cell culture medium supplemented with 2% FBS, 1% smooth muscle cell growth supplement, and 1% penicillin/streptomycin solution and incubated at 37 °C in a humidified 5% CO2 incubator. The CTSG overexpression plasmid or corresponding empty plasmid was transfected using Lipofectamine 3000, according to the manufacturer’s instructions, to evaluate the effect of CTSG on cultured VSMCs. Briefly, cells were seeded at a confluency of 60–70%. The plasmids were mixed with Lipofectamine 3000, diluted in Opti-MEM (without antibiotics and FBS), and incubated for 24 h. The complete culture medium was replaced, and the cells were cultured for 24 h. Transfection efficiency was measured by real-time quantitative PCR (RT-qPCR; 24 h after transfection) and western blotting (48 h after transfection).
2.4. RNA isolation and RT-qPCR
RNA extraction was performed using the EZ-press RNA Purification Kit, and the RNA was reverse-transcribed to cDNA using the Reverse Transcription Master Mix. RT-qPCR experiments were conducted using Color SYBR Green qPCR Mix on an ROCHE LightCycler 96, with 45 cycles per sample. All procedures were performed according to the manufacturer’s instructions. Relative gene expression levels were determined using the 2−ΔΔCt method and were normalized to GAPDH expression levels. The specificity of the primer sequence was confirmed using agarose gel electrophoresis and melting curve analysis. All RT-qPCR primer sequences are listed in Supplementary Table S2.
2.5. Western blot
Total cellular protein content was determined by lysing the cells with RIPA buffer, and the protein concentration was determined using a BCA kit. Approximately, 30 μg of protein was separated by SDS-PAGE, followed by membrane transfer treatment, and nonspecific antigens were blocked using 4% BSA. Immunoblots were detected separately with various primary antibodies, and HRP-labelled secondary antibodies were used for detection using the ChemiDoc System (Bio-Rad, Inc., Hercules, CA).
2.6. Histopathology and immunohistochemistry
Paraffin-embedded tissues were cut into 2.5 μm-thick sections, deparaffinized, and dehydrated in a graded ethanol series. Masson’s trichrome staining was performed according to the manufacturer’s instructions. According to the manufacturer’s protocols, Immunohistochemistry (IHC) was performed using the UltraSensitiveTM SP IHC Kit and DAB reagent kit. Briefly, the sections were subjected to antigen retrieval, removal of endogenous peroxidase activity, and antigen blocking. Sections were subsequently incubated overnight with a primary antibody (CTSG, 1:400; collagen I, 1:400) at 4 °C, followed by incubation with a horseradish peroxidase-labeled secondary antibody. DAB was used for color visualization. The sections were counterstained with hematoxylin. The following primary antibodies were used for double-immunofluorescence staining of sections: rabbit anti-CTSG antibody (1:400) and SMA-α-FITC (1:500). Alexa Fluor 555 anti-rabbit antibody was used as the secondary antibody. We used 4′,6-diamidino-2-phenylindole (DAPI) for counterstaining. Pictures were recorded using a Nikon Eclipse Ti2-E fluorescence microscope. Images (× 400) from each section were analyzed blindly and quantified using ImageJ software.
2.7. Scratch assay
A scratch assay was performed on VSMCs as previously described [Citation15]. VSMCs were seeded at a density of 15 × 104 cells per well in a 12-well plate and transfected with plasmids the next day. A scratch was introduced 48 h after transfection using a 200-μL pipette tip. The cells were then incubated at 37 °C and observed after 0, 12, 24, and 48 h. A difference in scratch filling was observed to determine the ability of the cells to migrate.
2.8. Statistics
All data are expressed as the mean ± SD. Statistical tests included the two-sided unpaired Student’s t-test and two-way ANOVA; p < 0.05 was considered statistically significant.
3. Results
3.1. Differentially expressed genes between immature and mature AVF group
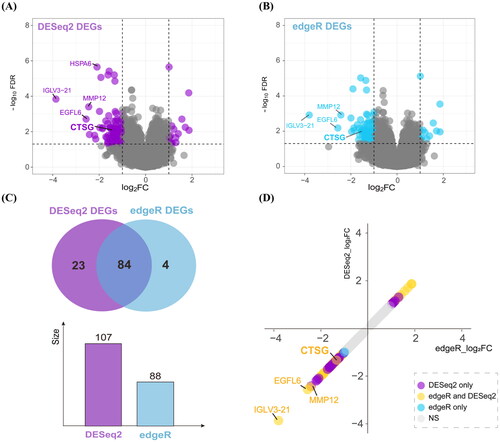
We performed differential expression analysis of immature and mature AVFs. After adjusting for sex-related differences, 107 and 88 DEGs were identified using DESeq2 and edgeR, respectively (). The intersection of DEGs consisted of 84 genes screened using DESeq2 and edgeR (). The significant fold-changes genes observed using DESeq2, edgeR, and both methods are highlighted in .
Figure 1. Differentially expressed analysis in the immature AVFs compared to the mature. (A and B) Volcano plots of DEGs using DESeq2 (A) and edgeR (B) method. (C) Venn diagram summarizing the differential and overlapping DEGs. (D) Plot of fold changes of significant DEGs in DESeq2, edgeR, and both methods. DEGs: differentially expressed genes; AVF: arteriovenous fistula.
3.2. The results of functional enrichment analysis and protein–protein interaction network construction
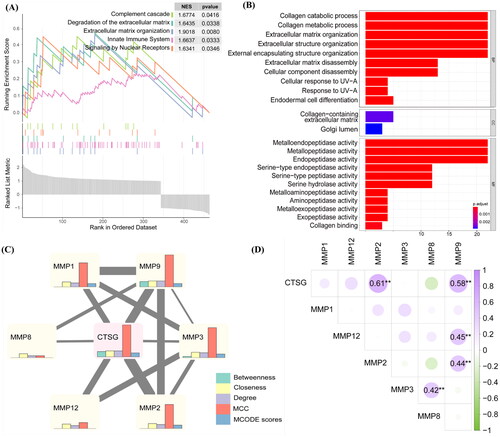
Gene ontology (GO) and Kyoto Encyclopedia of Genes and Genomes (KEGG) enrichment analysis and Gene set enrichment analysis (GSEA) were performed to identify pathways associated with DEGs. The GO enrichment results () showed that the DEGs were related to cellular components (CCs), including collagen-containing extracellular matrix (ECM; e.g., CTSG and FRAS1) and blood microparticle (e.g., C4A). As for molecular functions (MFs), the DEGs were mainly involved in receptor-ligand activity (e.g., HBEGF) and metalloendopeptidase activity (e.g., ECEL1). They participated in biological processes (BPs) related to ECM organization (e.g., CTSG) and extracellular structure organization (e.g., ADAMTS14 and CTSG). The KEGG enrichment results showed that the DEGs were related to cytokine-cytokine receptor interactions (e.g., CCL8 and IL10) (). As for GSEA (), apart from the immune response, the results revealed enrichment in SLC-mediated transmembrane transport (e.g., SLC14A1) and vesicle-mediated transport (e.g., IGLV3-21).
Figure 2. Function enrichment analysis and PPI network. (A) Barplot of GO enrichment analysis. Results were categorized into biological process (BP), cellular component (CC), and molecular function (MF). (B) Barplot of KEGG pathway enrichment analysis. (C) The results of GSEA. (D) PPI network of candidate genes. Nodes whose degree greater than 5 were as the candidate genes, the more central, the greater the degree values. The size and gradient color of each node represents its degree and log2FC. (E) PPI network of the genes in cluster 1. The size and gradient color of each node represents its scores and log2FC. PPI: protein–protein interaction; GO: gene ontology; KEGG: Kyoto Encyclopedia of Genes and Genomes; GSEA: gene set enrichment analysis.
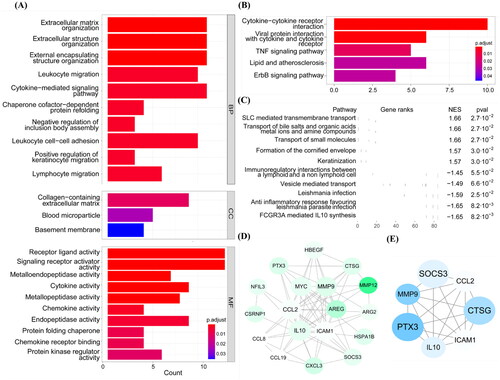
We then constructed a protein–protein interaction (PPI) network and calculated the degree of each node using Cytohubba plug-in to explore important genes in the network. Eighteen genes with a degree of connectivity ≥ 5 were considered candidate genes associated with AVF non-maturation (). Subsequently, using MCODE plug-in, we obtained four sub-clusters among the DEGs (Supplementary Table S3). We visualized the interaction between the genes in Cluster 1 and their scores ( and Supplementary Table S4).
3.3. Trait-related gene module obtained by WGCNA and ssGSEA analysis
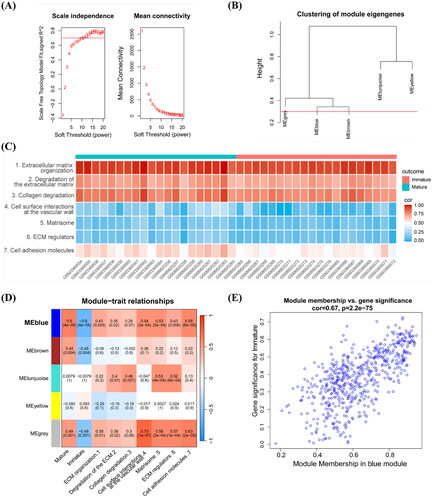
Weighted gene correlation network analysis (WGCNA) was conducted to identify a gene group with the same expression pattern and to determine the association between modules and sample phenotypes. First, a power of β = 11 (scale-free R2 = 0.7) was selected as a soft threshold value for establishing a scale-free network (). Five gene modules were obtained from the co-expression network and retained when dynamic pruning method was used (). The single-sample gene set enrichment analysis (ssGSEA) was performed to calculate the score of each sample for ECM-related pathways and identify the correlation between values (). Pathways were input as new traits during WGCNA. Coefficients and corresponding statistical significance between module eigengenes and clinical traits were calculated and visualized, as shown in . The blue module was the most negatively associated with non-maturation outcome and positively associated with ECM-related traits, which were negatively related to the non-maturation of AVF progression. In conclusion, the blue module was highly related to AVF progression-related non-maturation, with a correlation coefficient of 0.67 and a p value of 2.2e-75 ().
Figure 3. WGCNA analysis combined with ssGSEA. (A) Scale independence and mean connectivity with soft threshold. (B) Clustering of modules. (C) ssGSEA enrichment scores of seven ECM-related pathways in each sample. (D) Each cell contained the corresponding correlation and p values. Mature, immature, and the 1, 2, 7 refer to AVFs are anatomic maturation or nonmaturation, and the pathways in (C). (E) Scatter plot of genes in the blue module. The horizonal axis represents MM, the vertical axis represents the importance of genes for the failure outcome. Pearson correlation coefficients of MM and gene significance and the P-values are listed at the top of the plot. WGCNA: weighted gene correlation network analysis; ssGSEA: single sample gene set enrichment analysis; ECM: extracellular matrix; MM: module membership.
3.4. Identified CTSG as hub gene associated with the AVF non-maturation
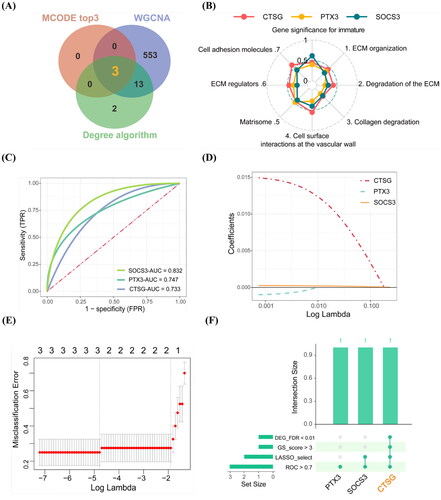
Combining with the results of candidate genes in Cytohubba, the top 3 genes in MCODE scores in cluster 1 and blue module in WGCNA, CTSG, PTX3, and SOCS3 were identified as candidate hub genes (). The gene significance (GS) for traits of the three candidate hub genes were calculated and visualized, as shown in . To explore further the more important gene associated with AVF non-maturation, we conducted ROC diagnostic prediction analysis of the three candidate hub genes to evaluate their predictive effect on AVF outcomes. The AUC values of all genes were more than 0.7 (). Using the lasso regression model, CTSG and SOCS3 were selected (). Combined with the above results, we found that gene CTSG had a more significant differential expression (FDR < 0.01), higher trait-related scores, and a more important value in LASSO model ( and Supplementary Tables S4 and S5). Thus, CTSG is considered a hub gene involved in AVF non-maturation for subsequent analysis. We further explored whether the expression differences of CTSG existed preoperatively by delving into datasets GSE119296 and GSE220796. We performed differential expression analysis in native veins that remained immature versus veins that matured after AVF creation. After adjusting for sex-related differences, the DEGs were identified using DESeq2 and edgeR, respectively. The results indicated no significant differential expression of CTSG in native veins (Supplementary Figure S1).
Figure 4. Screening the hub gene associated with the AVF non-maturation. (A) Results of the degree algorithm, MCODE plug-in, and WGCNA analysis screening were intersected to obtain candidate hub genes. (B) Radar chart of the three candidate hub genes with gene significance for trait scores. (C) ROC prediction analysis of the three hub candidate genes in AVFs. AUC value is on the lower right. (D,E) Lasso regression analysis. The expression levels of three candidate hub genes were used as input values for lasso selection and 10-fold cross-validation for the penalty parameters-lambda selection in the model, two variables were reserved when the lambda.min was selected. (F) Upset plot of the results in above analysis for candidate hub genes. **FDR < 0.01 indicated significant differences.
3.5. Downstream biological pathways and effectors affected by CTSG during ECM regulation
The function enrichment analysis results () highlighted a significant enrichment of pathways linked to the ECM, with CTSG also playing a role within these pathways. To explore how CTSG affects ECM organization in immature AVFs, GSEA was performed according to the expression level of CTSG (). We found that degradation of the ECM (e.g., MMP9 and CMA1) and ECM organization (e.g., ADAMTS14 and TPSAB1) were highly correlated with CTSG. Next, we attempted to determine the specific effector regulated by CTSG. Using the Reactome database, we found that CTSG participates in matrix metalloproteinases (MMP) pathway activation, which in turn activates proMMP1, proMMP8 and proMMP9 [Citation16–19] (Supplementary Figure S2). GO and enrichment analysis were then performed to identify BP and pathways related to the DEGs of MMPs. The results showed that MMPs play a role in regulating metalloendopeptidase activity (e.g., MMP1 and MMP9), mainly in collagen-containing ECM (e.g., MMP2 and MMP9), which participates in processes such as collagen degradation (e.g., MMP8 and MMP9) and ECM organization (e.g., MMP3 and MMP12) (). Next, we constructed the CTSG-MMP PPI network. We used the betweenness, closeness, MCC, degree, and MCODE scores to evaluate important nodes in the network. MMP8 and MMP12 did not occur in the MCODE module in which CTSG participated, and MMP9 and MMP3 had better performance in the five algorithms (). However, only MMP2 (cor = 0.61, p value = 4.19E-05) and MMP9 (cor = 0.58, p value = 1.17E-04) were significantly correlated with CTSG and the correlation with MMP3 (cor = 0.025, p value = 0.88) was not statistically significant (). Overall, MMP2 and MMP9 were considered as potential downstream effectors of CTSG during the subsequent verification process.
Figure 5. Downstream effector of CTSG and its gene family function. (A) GSEA was carried out according to the expression level of CTSG. (B) Barplot of GO enrichment analysis of DEGs which belong to MMP gene family. Results were categorized into biological process (BP), cellular component (CC), and molecular function (MF). (C) PPI network of CTSG and MMPs. The different color barplot represent five algorithms and the thickness of each edge represents correlation. (D) Heatmap of correlation coefficient between CTSG and MMPs. **p < 0.01 indicated significant differences. DEGs: differentially expressed genes; PPI: protein–protein interaction; GO: gene ontology; GSEA: gene set enrichment analysis.
3.6. Expression levels of CTSG were decreased in immature AVFs compared to mature AVFs
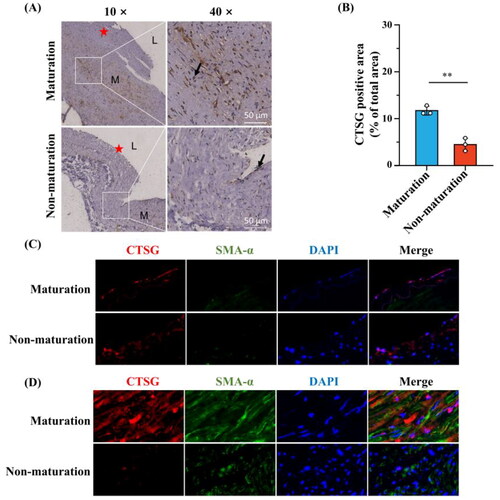
To further confirm the rationality of the previous analysis, six human AVF specimens were collected to detect CTSG expression using IHC analysis. IHC results showed that CTSG expression was significantly decreased in the outflow veins of immature AVFs compared to mature AVFs (). Next, we sought to elucidate the role of the CTSGs in AVF maturation. Double-immunofluorescence analyses were performed on mature and immature AVF tissue samples. Both mature and immature AVFs showed CTSG expression in the intima, which indicated a lack of co-expression of α-smooth muscle actin (α-SMA), a VSMC marker (). However, in the media, CTSG colocalized with α-SMA and was expressed at significantly higher levels in the mature group than in the immature group ().
Figure 6. The expression of CTSG was decreased in immature AVF removed from patients compared to mature AVF. (A and B) Representative images of CTSG immunohistochemistry staining (A) and the positive-staining areas were statistically analyzed (B). The black arrows indicated areas of positive CTSG staining, (★) intima, (L) Lumen, and (M) media. **p < 0.01 versus maturation group. (C and D) Double-immunostaining of CTSG (red) and SMA-a (green) in the intima (C) and media (D) of AVF sample tissue. (Magnification, × 400). AVF: arteriovenous fistula.
3.7. Correlation between CTSG and medial fibrosis
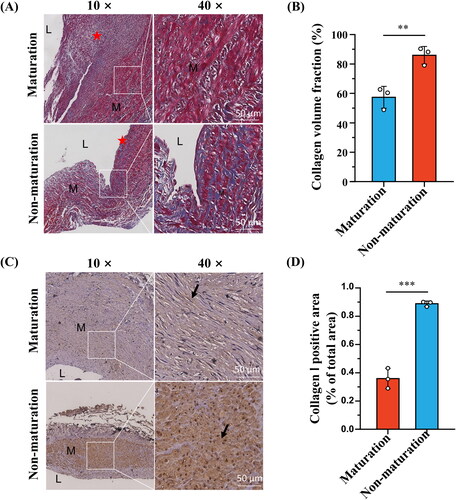
To further explore the role of CTSG in the media, we performed Masson’s trichrome staining. The results showed that the degree of medial fibrosis was significantly lower in mature AVFs than in immature AVFs (). Furthermore, IHC analysis of collagen I was performed, and the collagen I expression level was higher in the immature group than in the mature group ()). We previously showed that CTSG correlated with ECM generation, collagen degradation, and MMP expression via correlation analysis (). These results suggest that CTSG may promote AVF maturation by decreasing medial collagen deposition in AVF vein. Therefore, we hypothesized that CTSG promotes AVF maturation by stimulating MMP secretion and inhibiting ECM secretion.
Figure 7. Medial fibrosis was more significant in the immature AVFs compared to mature AVFs. (A and B) Representative images of masson’s trichrome staining (A) and collagen volume fraction were statistically analyzed (B). (C and D) Representative images of collagen l immunohistochemistry staining (C) and the positive-staining areas were statistically analyzed (D). The black arrows indicated areas of positive collagen l staining, (★) intima, (L) Lumen, and (M) media. **p < 0.01, ***p < 0.001. AVF: arteriovenous fistula.
To test this hypothesis, we constructed an in vitro CTSG overexpression model using VSMCs. Both RT-qPCR and western blotting results demonstrated that the plasmid significantly upregulated the expression level of CTSG in VSMCs (). We found that CTSG overexpression in VSMCs increased the intracellular expression of MMP2 and MMP9 (). Further examination of the altered mRNA expression levels of collagen I and collagen III in VSMCs revealed that the expression levels of both collagen I and collagen III were significantly decreased in the pcDNA-CTSG group (). These results suggested that CTSG may promote AVF maturation by inhibiting the secretion of collagen in VSMCs and promoting the expression and secretion of MMP, thereby reducing the degree of medial fibrosis.
Figure 8. Effects of CTSG overexpression on VSMCs. (A) RT-qPCR validation of CTSG overexpression in VSMCs. (B) Validation of CTSG overexpression by western blotting. (C) mRNA levels of MMP2, MMP9, collagen I, and collagen III were evaluated by RT-qPCR. (D) Wound healing scratch test was performed at VSMCs. *p < 0.05, ***p < 0.001, and ****p < 0.0001. VSMCs: vascular smooth muscle cells; MMP: matrix metalloproteinase.
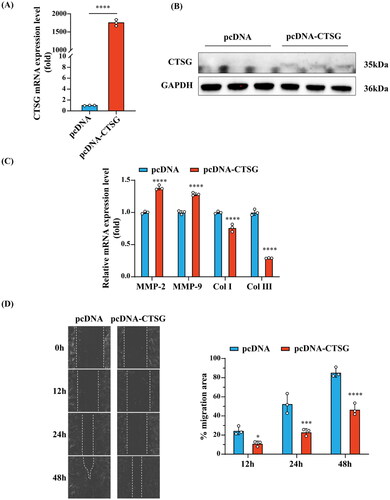
Notably, we found that VSMCs transfected with the CTSG overexpression plasmid showed a significant decrease in migration ability ().
4. Discussion
The global increase in the incidence of end-stage renal disease has led to an increase in AVF placement. However, the low maturation rate of AVFs results in patients being unable to undergo hemodialysis treatment after AVF creation, which significantly increases the financial and psychological burdens on patients [Citation9,Citation20–22]. Therefore, there is an urgent need to improve the maturation of AVFs.
We analyzed the GSE119296 and GSE220796 datasets and identified 17 upregulated and 94 downregulated significant DEGs. The GO, KEGG, and GSEA enrichment analysis were performed. The results showed that the inflammatory response was the most enhanced, consistent with most current findings. Inflammatory response regulates vascular remodeling [Citation23,Citation24]. Local inflammation caused by AVF formation promotes macrophage and lymphocyte infiltration and upregulates inflammatory factor expression, which promotes the further accumulation of inflammatory cells in the intima, eventually leading to IH. On the other hand, local inflammation also promotes local thrombosis, which leads to AVF dysfunction. The GO enrichment analysis results suggest that ECM tissue is also involved in the development of AVF, which is consistent with the present findings. During AVF maturation, the ECM of the venous vascular wall is altered in three main phases, that is, the disassembly, reorganization, and reconstruction phases, and incorrect alterations in any of these phases would affect AVF maturation [Citation22].
Thus, the results of the degree algorithm provided by the Cytohubba plug-in, MCODE plug-in, WGCNA, and LASSO logistic regression showed that CTSG might be a hub gene involved in AVF maturation. To verify whether CTSG was associated with AVF maturation, we collected tissue specimens with clinically mature and immature AVFs and verified these specimens via IHC analysis. The expression of CTSG in the immature group was significantly lower than that in the mature group; these results were consistent with the results of bioinformatics analysis. The results of the double-immunofluorescence analysis suggested that CTSG was expressed in the intima of the venous vessel wall in both the mature and immature groups. Interestingly, the CTSG expression level was significantly lower in the intima of the immature group than in the mature group, especially in VSMCs. This suggests that CTSG may promote AVF maturation by regulating the biological function of VSMCs.
Cathepsin G (CTSG), a member of the serine protease family, was first identified and named in the azurophilic granules of neutrophil leukocytes in 1976 [Citation25]. It is mainly secreted by neutrophils of leukocytes and is involved in the killing and elimination of pathogens and remodeling of connective tissue at the site of inflammation [Citation26]. The David database suggested that CTSG is located in the nucleus, cell membrane, and extracellular space, which is consistent with our IHC and double-immunofluorescence analysis results [Citation27]. CTSG has been found to play a role in cancer, acute myeloid leukemia, and inflammatory bowel disease [Citation28–30]. However, the main focus has been on its function in immune infiltration and induction of inflammatory responses [Citation31]. CTSG acts as a degradative enzyme that breaks down ECM components at sites of inflammation, thereby promoting neutrophil aggregation [Citation32]. In addition, it increases CTSG expression levels in healthy human fibroblasts. CTSG expression in fibroblasts induces the conversion of proMMP1 to active MMP1 [Citation33]. We performed downstream biological pathway and effector analysis of CTSG, and the results suggested that CTSG activates proMMP1, proMMP8, and proMMP9, and that CTSG expression levels were positively correlated with MMP2 and MMP9 expression levels. Thus, we constructed a CTSG overexpression model on VSMCs and found that CTSG not only upregulated the expression of MMP2 and MMP9 in VMSCs, but also downregulated the expression of collagen I and collagen III. These results suggest that VSMCs can promote ECM degradation and inhibit ECM synthesis through the secretion of CTSG. This may be the primary mechanism by which CTSG plays a role in AVF maturation.
The exact mechanism of AVF maturation failure is unknown, but IH and inadequate outward remodeling are thought to be the main causes [Citation11]. After AVF creation, the veins need to dilate to adapt to changes in blood flow, thus facilitating AVF maturation. The net result of the degree of outward remodeling and extent of endothelial proliferation determines the caliber of the venous lumen [Citation11]. Most studies have focused on the pathogenesis of IH and have neglected the contribution of inadequate outward remodeling of vessels. Martinez et al. found that excessive fibrotic remodeling of veins after AVF creation is an important risk factor for inadequate outward remodeling of the vessel and that the degree of fibrosis is positively correlated with AVF non-maturation [Citation10]. Fibrosis of the AVF vessel wall can be attributed to the excessive synthesis of ECM by activated smooth muscle cells and myofibroblasts and/or inadequate degradation of ECM by MMPs, which can lead to vessel stiffness, thereby limiting the expansion of the vessel wall and ultimately inhibiting outward remodeling of the vessel [Citation34]. One study found that treatment of rabbit AVF with recombinant elastase PRT-201 promoted outward remodeling of vessels after AVF creation [Citation34,Citation35]. In addition, investigators found that atorvastatin significantly reduced fibrin deposition and macrophage accumulation, and was found to promote structurally effective venous limb outward remodeling [Citation36]. Moreover, Masson staining results for our AVF tissue samples and IHC results of collagen I also showed significantly higher medical fibrosis in the immature AVF group than in the mature AVF group. These findings suggest that suppressing venous wall fibrosis after AVF creation could promote outward remodeling of the vessel wall. An experimental model showed that vascular outward remodeling highly depends on effective ECM reorganization [Citation31]. At the biological level, the reorganization of these ECMs mainly depends on the upregulation of proteases, such as MMPs and histones [Citation37]. Therefore, we selected ECM-related modules to screen for key genes during WGCNA. We found that CTSG not only upregulated the expression of MMP2 and MMP9 in VMSCs but also downregulated the expression of collagen I and collagen III to reduce ECM further. These results suggest that CTSG may degrade ECM in the media by promoting the secretion of MMP2 and MMP9 in VSMCs and inhibiting the secretion of collagen from VSMCs, thus reducing the extent of medial fibrosis and promoting the outward remodeling of AVF vessels.
There are several limitations in this study. First, the RNA-Seq method detects the expression of all RNA within a sample and does not localize to specific cells, which might introduce biases. Secondly, numerous other factors, such as medications, abnormal shear stress on the vessel wall, and other abnormal mechanical forces, have the potential to influence the development of AVF, and these influences were not corrected in our study. Third, the sample size was small, and samples were collected solely from a single center.
Despite these limitations, our work charts a new path for understanding the mechanism underlying AVF non-maturation. Moreover, previous studies on GSE119296 [Citation13] primarily compared preoperative samples between mature and immature AVF veins, with no statistically significant differences found in postoperative AVF veins samples. The study integrating the GSE220796 and GSE119296 datasets focused on analyzing transcriptomic changes during the vein to AVF transformation in AVFs that remained immature compared with those that matured [Citation14]. Our research integrated samples from both datasets and focused on the expression variances between postoperative mature and immature AVF samples. We then integrated multiple approaches to screen for critical molecules associated with AVF non-maturation. We further validated the expression of gene in human AVF samples and explored the underlying mechanism of the gene CTSG in in vitro experiment. Our data highlight the potential role of CTSG as a novel ECM regulatory factor in postoperative venous remodeling. Targeting CTSG for perivascular intervention during AVF creation may be a feasible strategy to improve venous outward remodeling in AVFs.
In summary, in this study, we analyzed the DEGs between mature and immature AVFs using the GEO publicly datasets to determine their biological functions and screened them for the hub gene CTSG. Finally, we constructed a CTSG overexpression model in VSMCs. We found that CTSG upregulated the expression of MMP2 and MMP9 in VMSCs and downregulated the expression of collagen I and collagen III, thus facilitating further degradation of ECM. In addition, CTSG expression inhibits VSMC migration. This study provides evidence for a mechanism to reduce the non-maturation rate of AVFs, thereby increasing the rate of AVFs maturation. However, the deeper mechanisms of action of CTSG require further exploration. Future research will concentrate on understanding the role of CTSG by silencing its expression with lentivirus therapies or knockout models.
Statement of ethics
The study protocol was reviewed and approved by the Ethics Committee of Guangzhou First People’s Hospital and was in accordance with the principles of the Declaration of Helsinki [approval number: K-2022-011-01]. Written informed consent was obtained from all the participants.
Author contributions
Ming Liang, Quhuan Li, Lemei Hu, and Changqing Zheng conceived and designed the study. Lemei Hu designed and performed experiments. Lemei Hu and Changqing Zheng analyzed the data and drafted the manuscript. Ming Liang, Quhuan Li, Lemei Hu, and Changqing Zheng reviewed and edited the manuscript. Lemei Hu, Fengzhang Huang, and Zhigang Zhu contributed to data collection. Ying Kong and Zhiqing Luo provided guidance on data analysis. All the authors have read and agreed to the published version of the manuscript.
Supplemental Material
Download PDF (320.1 KB)Acknowledgments
Not applicable.
Disclosure statement
The authors declared that they have no conflict of interest.
Data availability statement
All data generated or analyzed during this study are included in this article. Further inquiries can be directed to the corresponding authors.
Additional information
Funding
References
- Lok CE, Huber TS, Lee T, et al. KDOQI clinical practice guideline for vascular access: 2019 update. Am J Kidney Dis. 2020;75(2):1–15. doi: 10.1053/j.ajkd.2019.12.001.
- Dixon BS, Novak L, Fangman J. Hemodialysis vascular access survival: upper-arm native arteriovenous fistula. Am J Kidney Dis. 2002;39(1):92–101. doi: 10.1053/ajkd.2002.29886.
- Iyem H. Early follow-up results of arteriovenous fistulae created for hemodialysis. Vasc Health Risk Manag. 2011;7:321–325. doi: 10.2147/VHRM.S14277.
- Dember LM, Beck GJ, Allon M, et al. Effect of clopidogrel on early failure of arteriovenous fistulas for hemodialysis: a randomized controlled trial. JAMA. 2008;299(18):2164–2171. doi: 10.1001/jama.299.18.2164.
- Robbin ML, Chamberlain NE, Lockhart ME, et al. Hemodialysis arteriovenous fistula maturity: US evaluation. Radiology. 2002;225(1):59–64. doi: 10.1148/radiol.2251011367.
- Asif A, Cherla G, Merrill D, et al. Conversion of tunneled hemodialysis Catheter-Consigned patients to arteriovenous fistula. Kidney Int. 2005;67(6):2399–2406. doi: 10.1111/j.1523-1755.2005.00347.x.
- Laboyrie SL, de Vries MR, de Jong A, et al. Von Willebrand factor: a central regulator of arteriovenous fistula maturation through smooth muscle cell proliferation and outward remodeling. J Am Heart Assoc. 2022;11(16):e024581. doi: 10.1161/JAHA.121.024581.
- Siddiqui MA, Ashraff S, Santos D, et al. An overview of AVF maturation and endothelial dysfunction in an advanced renal failure. Ren Replace Ther. 2017;3(1):42. doi: 10.1186/s41100-017-0123-x.
- Asif A, Roy-Chaudhury P, Beathard GA. Early arteriovenous fistula failure: a logical proposal for when and how to intervene. Clin J Am Soc Nephrol. 2006;1(2):332–339. doi: 10.2215/CJN.00850805.
- Martinez L, Duque JC, Tabbara M, et al. Fibrotic venous remodeling and nonmaturation of arteriovenous fistulas. J Am Soc Nephrol. 2018;29(3):1030–1040. doi: 10.1681/ASN.2017050559.
- Rothuizen TC, Wong C, Quax PHA, et al. Arteriovenous access failure: more than just intimal hyperplasia? Nephrol Dial Transplant. 2013;28(5):1085–1092. doi: 10.1093/ndt/gft068.
- Allon M, Litovsky S, Young CJ, et al. Medial fibrosis, vascular calcification, intimal hyperplasia, and arteriovenous fistula maturation. Am J Kidney Dis. 2011;58(3):437–443. doi: 10.1053/j.ajkd.2011.04.018.
- Martinez L, Tabbara M, Duque JC, et al. Transcriptomics of human arteriovenous fistula failure: genes associated with nonmaturation. Am J Kidney Dis. 2019;74(1):73–81. doi: 10.1053/j.ajkd.2018.12.035.
- Martinez L, Rojas MG, Tabbara M, et al. The transcriptomics of the human vein transformation after arteriovenous fistula anastomosis uncovers Layer-Specific remodeling and hallmarks of maturation failure. Kidney Int Rep. 2023;8(4):837–850. doi: 10.1016/j.ekir.2023.01.008.
- Song A, Yin X, Gao P, et al. Inhibition of MAD2B alleviates venous neointimal formation by suppressing VSMCs proliferation and migration. Faseb J. 2021;35(11):e21959. doi: 10.1096/fj.202100584RR.
- Murphy G, Bretz U, Baggiolini M, et al. The latent collagenase and gelatinase of human polymorphonuclear neutrophil leucocytes. Biochem J. 1980;192(2):517–525. doi: 10.1042/bj1920517.
- Saunders WB, Bayless KJ, Davis GE. MMP-1 activation by serine proteases and MMP-10 induces human capillary tubular network collapse and regression in 3D collagen matrices. J Cell Sci. 2005;118(Pt 10):2325–2340. doi: 10.1242/jcs.02360.
- Knäuper V, Krämer S, Reinke H, et al. Characterization and activation of procollagenase from human polymorphonuclear leucocytes. N-Terminal sequence determination of the proenzyme and various proteolytically activated forms. Eur J Biochem. 1990;189(2):295–300. doi: 10.1111/j.1432-1033.1990.tb15489.x.
- Capodici C, Muthukumaran G, Amoruso MA, et al. Activation of neutrophil collagenase by cathepsin G. Inflammation. 1989;13(3):245–258. doi: 10.1007/BF00914392.
- Woodside KJ, Bell S, Mukhopadhyay P, et al. Arteriovenous fistula maturation in prevalent hemodialysis patients in the United States: a national study. Am J Kidney Dis. 2018;71(6):793–801. doi: 10.1053/j.ajkd.2017.11.020.
- Huber TS, Berceli SA, Scali ST, et al. Arteriovenous fistula maturation, functional patency, and intervention rates. JAMA Surg. 2021;156(12):1111–1118. doi: 10.1001/jamasurg.2021.4527.
- Gorecka J, Fereydooni A, Gonzalez L, et al. Molecular targets for improving arteriovenous fistula maturation and patency. Vasc Investig Ther. 2019;2(2):33–41. doi: 10.4103/VIT.VIT_9_19.
- Kuwahara G, Hashimoto T, Tsuneki M, et al. CD44 promotes inflammation and extracellular matrix production during arteriovenous fistula maturation. Arterioscler Thromb Vasc Biol. 2017;37(6):1147–1156. doi: 10.1161/ATVBAHA.117.309385.
- Liu Q, Ba YG. Progress in pathologic mechanism of autogenous arteriovenous fistula dysfunction. ACM. 2022;12(06):5968–5973.
- Starkey PM, Barrett AJ. Human cathepsin G. Catalytic and immunological properties. Biochem J. 1976;155(2):273–278. doi: 10.1042/bj1550273.
- Stelzer G, Rosen N, Plaschkes I, et al. The GeneCards suite: from gene data mining to disease genome sequence analyses. Curr Protoc Bioinformatics. 2016;54(1):1.30.1–1.30.33. doi: 10.1002/cpbi.5.
- Xiong L, Cao J, Qiu Y, et al. Exploring the mechanism of aspirin in the treatment of Kawasaki disease based on molecular docking and molecular dynamics. Evid Based Complement Alternat Med. 2022;2022:9828518–9828511. doi: 10.1155/2022/9828518.
- Jin W, Wu K, Li YZ, et al. AML1-ETO targets and suppresses cathepsin G, a serine protease, which is able to degrade AML1-ETO in t(8;21) acute myeloid leukemia. Oncogene. 2013;32(15):1978–1987. doi: 10.1038/onc.2012.204.
- Chan S, Wang X, Wang Z, et al. CTSG suppresses colorectal cancer progression through negative regulation of Akt/MTOR/Bcl2 signaling pathway. Int J Biol Sci. 2023;19(7):2220–2233. doi: 10.7150/ijbs.82000.
- Roweth HG, Malloy MW, Goreczny GJ, et al. Pro-inflammatory megakaryocyte gene expression in murine models of breast cancer. Sci Adv. 2022;8(41):eabo5224. doi: 10.1126/sciadv.abo5224.
- Aghdassi AA, John DS, Sendler M, et al. Absence of the neutrophil serine protease cathepsin G decreases neutrophil granulocyte infiltration but does not change the severity of acute pancreatitis. Sci Rep. 2019;9(1):16774. doi: 10.1038/s41598-019-53293-0.
- Pham CTN. Neutrophil serine proteases: specific regulators of inflammation. Nat Rev Immunol. 2006;6(7):541–550. doi: 10.1038/nri1841.
- Son ED, Kim H, Choi H, et al. Cathepsin G increases MMP expression in normal human fibroblasts through fibronectin fragmentation, and induces the conversion of ProMMP-1 to active MMP-1. J Dermatol Sci. 2009;53(2):150–152. doi: 10.1016/j.jdermsci.2008.08.006.
- Dwivedi AJ, Roy-Chaudhury P, Peden EK, et al. Application of human type I pancreatic elastase (PRT-201) to the venous anastomosis of arteriovenous grafts in patients with chronic kidney disease. J Vasc Access. 2014;15(5):376–384. doi: 10.5301/jva.5000235.
- Vascular access for dialysis 1. NDT. 2007;22(6):vi149–vi158.
- Cui J, Kessinger CW, Jhajj HS, et al. Atorvastatin reduces in vivo fibrin deposition and macrophage accumulation, and improves primary patency duration and maturation of murine arteriovenous fistula. J Am Soc Nephrol. 2020;31(5):931–945. doi: 10.1681/ASN.2019060612.
- Chan CY, Chen YS, Ma MC, et al. Remodeling of experimental arteriovenous fistula with increased matrix metalloproteinase expression in rats. J Vasc Surg. 2007;45(4):804–811. doi: 10.1016/j.jvs.2006.12.063.
- Tirelli G, Nicastro L, Gatto A, et al. Stretching stenoses of the external auditory canal: a report of four cases and brief review of the literature. Acta Otorhinolaryngol Ital. 2015;35(1):34–38.