
Abstract
The prevalence of diabetic kidney disease (DKD) is increasing annually. Damage to and loss of podocytes occur early in DKD. tRNA-derived fragments (tRFs), originating from tRNA precursors or mature tRNAs, are associated with various illnesses. In this study, tRFs were identified, and their roles in podocyte injury induced by high-glucose (HG) treatment were explored. High-throughput sequencing of podocytes treated with HG was performed to identify differentially expressed tRFs. Gene Ontology (GO) and Kyoto Encyclopedia of Genes and Genomes (KEGG) analyses were performed. The expression levels of nephrin, podocin, and desmin were measured in podocytes after overexpression of tRF-1:24-Glu-CTC-1-M2 (tRF-1:24) and concomitant HG treatment. A total of 647 tRFs were identified, and 89 differentially expressed tRFs (|log2FC| ≥ 0.585; p ≤ .05) were identified in the HG group, of which 53 tRFs were downregulated and 36 tRFs were upregulated. The 10 tRFs with the highest differential expression were detected by real-time quantitative polymerase chain reaction (RT-qPCR), and these results were consistent with the sequencing results. GO analysis revealed that the biological process, cellular component, and molecular function terms in which the tRFs were the most enriched were cellular processes, cellular anatomical entities, and binding. KEGG pathway analysis revealed that tRFs may be involved in signaling pathways related to growth hormones, phospholipase D, the regulation of stem cell pluripotency, and T-/B-cell receptors. Overexpression of tRF-1:24, one of the most differentially expressed tRFs, attenuated podocyte injury induced by HG. Thus, tRFs might be potential biomarkers for podocyte injury in DKD.
Introduction
Approximately, 20–40% of people with diabetes mellitus (DM) also have diabetic kidney disease (DKD) [Citation1]. The number of people with DM is expected to increase to 643 million by 2030 [Citation2], and it is predicted that approximately 200 million people with DM will develop DKD. DKD is characterized by albuminuria and/or a decreased glomerular filtration rate. Podocytes are located outside the glomerular basement membrane and are the final barrier to glomerular filtration. A reduction in the density and number of podocytes leads to proteinuria, and the two are positively correlated to a degree [Citation3]. A reduction in number of podocytes was confirmed in renal samples taken by biopsy from patients with DKD [Citation4]. Podocyte injury is an important factor in the progression of DKD. Therefore, it is crucial to study podocyte injury when considering treatments for DKD. Nephrin and podocin are major components of the podocyte slit diaphragm. Desmin is an intermediate filament protein in the cytoskeleton. When podocytes are injured, the cytoskeleton is rearranged, podocin and nephrin expression decreases, and desmin expression increases [Citation5–7].
tRNA-derived fragments (tRFs) containing 10–40 nucleotides are products of tRNA precursors or mature tRNAs and, owing to the diverse and specific cleavage sites on precursors and mature tRNAs, are categorized into five types: tRF-1, tRF-2, tRF-3, tRF-5, and itRF [Citation8,Citation9]. An increasing number of tRFs are being identified, and their biological functions include the regulation of cellular stress [Citation10], translation repression [Citation11], cell proliferation [Citation12], modulation of DNA damage [Citation13], and epigenetic modification regulation [Citation14]. A wide range of experiments have confirmed that tRFs contribute to various human diseases, including kidney diseases [Citation15–17]. Previous studies by our team showed that tRFs affect podocyte differentiation and podocyte injury in patients with idiopathic nephrotic syndrome [Citation18,Citation19]. The expression profiles of renal tubular epithelial cells induced by high glucose (HG) were also explored [Citation20]. Thus, these previous studies initially demonstrated the promising clinical applications of tRFs.
In this study, tRFs differentially expressed in HG-induced podocytes and podocytes cultured in medium with normal glucose concentrations were identified using high-throughput sequencing technology, and bioinformatics analysis was performed. Thus, we aimed to explore the pathogenesis of DKD from the novel perspective of tRF effects on podocyte injury and to identify new therapeutic targets in DKD.
Materials and methods
Cell culture
We performed in vitro experiments with a mouse podocyte cell line (the MPC5 cell line), which was a gift from the Department of Nephrology, the Second Affiliated Hospital of Nanjing Medical University. Podocytes were incubated in RPMI 1640 medium, 10% fetal bovine serum, 1% penicillin and streptomycin (all from Gibco, Carlsbad, CA), and 50 U/L interferon-gamma (IFN-γ; PeproTech, Cranbury, NJ) at 33 °C with 5% CO2 to induce their proliferation, or podocytes were cultured in the same medium without IFN-γ at 37 °C for 10–14 days to induce their differentiation. The differentiated podocytes were inoculated in six-well plates and stimulated with normal concentrations of glucose (control, 5.5 mM), HG (30 mM) or glucose and mannitol (5.5 mM glucose + 24.5 mM mannitol), and the cells were collected after 24 h in culture for use in subsequent experiments.
High-throughput sequencing
Total RNA samples were preprocessed using a rtStar tRF and tiRNA Pretreatment Kit (Arraystar, Inc., Rockville, MD) to remove redundant modifications. The preprocessed RNA was joined to the 3′ and 5′ miRNA splice sites in the sequence. Proprietary primers were used to synthesize and amplify the cDNA. The required fragments were obtained from the gel and purified. The libraries were quantified and analyzed using an Agilent 2100 Bioanalyzer (Agilent Technologies, Inc., Santa Clara, CA). Finally, the quantified libraries were mounted with a NextSeq 500/550 V2 kit (Illumina, Inc., San Diego, CA) and sequenced using an Illumina NextSeq 500 system (Illumina, Inc., San Diego, CA). Valid sequences were obtained after counting and used for expression profiling.
RNA extraction and real-time quantitative polymerase chain reaction (RT-qPCR)
Total RNA was extracted from each sample using TRIzol (Invitrogen, Carlsbad, CA), followed by DNA removal from the genome and reverse transcription using an equal mass of RNA per sample according to the manufacturer’s instructions (Vazyme, Nanjing, China). The reaction system was added to a 384-well plate, and RT-qPCR was performed using a LightCycler 480 PCR instrument. The relative expression was calculated using the 2–ΔΔCt method. β-Actin (Realgene, Nanjing, China) and U6 (RiboBio, Guangzhou, China) were used as internal references for mRNA (Realgene, Shanghai, China) and tRF assays, respectively. The mRNA sequences of the primers used are presented in . tRF forward primer sequences and universal reverse primer sequences are unavailable because of RiboBio patents.
Table 1. Primer sequences used for RT-qPCR.
Western blotting
Proteins were extracted with lysate buffer (Beyotime, Nantong, China), and the concentration of the extracted proteins was quantified using the bicinchoninic acid method. The loading solution was established such that the protein concentration and volume of the loaded samples were similar. The proteins were separated by electrophoresis, transferred onto a polyvinylidene fluoride membrane (Millipore, Billerica, MA) activated with methanol, blocked with 5% skim milk for 2 h, and incubated with primary antibodies against nephrin (ab58968, Abcam, Cambridge, UK), podocin (ab50339, Abcam, Cambridge, UK), desmin (AF5334, Affinity, Changzhou, China), and β-tubulin (DF7967, Affinity, Changzhou, China) at 4 °C overnight. The following day, the membrane was rinsed and incubated with a secondary antibody labeled with horseradish peroxidase (goat anti-rabbit IgG; A21020, Abbkine, Wuhan, China) for 2 h. After rinsing again, the membrane was exposed to enhanced chemiluminescence reagents (Biosharp, Shanghai, China), and the grayscale values of the bands were determined using ImageJ software (Bethesda, MD).
Gene Ontology (GO) and Kyoto Encyclopedia of Genes and Genomes (KEGG) analysis
The potential functions of tRFs were explored by analyzing the target genes predicted for differentially expressed tRFs (|log2FC| ≥ 0.585; p ≤ .05). The DAVID website (David.ncifcrf.gov/) was used for GO and KEGG analyses.
Cell transfection
The tRF-1:24-Glu-CTC-1-M2 (tRF-1:24) mimic (TCCCTGGTGGTCTAGTGGTTAGGA), corresponding negative control (NC) (GUGGCCCGAUUUGUUCGGUGAGAU), buffer (10×), and transfection reagent were purchased from RiboBio and used according to the manufacturer’s instructions. First, 10× buffer was diluted with PBS, and tRF-1:24 mimic and tRF-1:24 NC were added to 1× buffer, gently mixed, and incubated for 5 min. The reagents were then added, gently mixed, and incubated for 10 min. Finally, medium was added, and the transfection mixture was prepared. When the density of differentiated podocytes reached 50%, they were transfected as described in the manufacturer’s protocol with transfection reagent at a final concentration of 20 nM. Finally, the cells were collected after 24 h, and RNA or protein was extracted for analysis.
Statistical analysis
All experiments were performed in triplicate. Statistical analysis was performed using GraphPad Prism 8 software (GraphPad Software, Inc., La Jolla, CA). Comparisons between two groups were made using unpaired Student’s t-tests, and comparisons between multiple groups were analyzed by one-way analysis of variance (ANOVA), with p < .05 indicating a statistically significant difference.
Results
Construction of the podocyte injury model
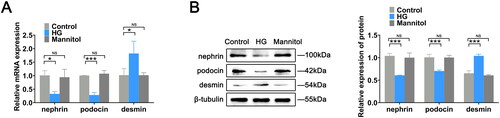
To evaluate whether the podocyte injury model was successfully constructed and to exclude the effects of high osmolarity on podocytes, we examined the expression of nephrin, podocin, and desmin in the control, HG, and mannitol groups. The expression of nephrin and podocin in the podocytes of the HG group was reduced compared with that in the control group. In contrast, desmin expression was higher in the HG group than in the control group. These results indicated that HG successfully induced podocyte injury. There were no statistically significant differences in the expression of nephrin, podocin, and desmin between the mannitol and control groups, excluding the effect of high osmolarity on podocytes ().
Figure 1. Construction of the podocyte injury model. (A) RT-qPCR was used to measure the mRNA expression levels of nephrin, podocin and desmin in mouse podocytes in the control, HG, and mannitol groups. (B) Protein expression levels of related indexes in cells were assessed by western blotting. The data are expressed as the mean ± SD. *p < .05, ***p < .001 vs. the control group. NS: not significant; HG: high glucose; RT-qPCR: real-time quantitative polymerase chain reaction.
Expression profile of tRFs in podocytes in the HG and control groups
High-throughput sequencing was performed to obtain insights into the differential expression of tRFs in the podocytes of the HG and control groups. Sequencing results revealed 647 tRFs in the two groups, including 89 differentially expressed tRFs (|log2FC| ≥ 0.585; p ≤ .05), of which 53 were downregulated and 36 were upregulated in the HG group, as shown in the hierarchical clustering heatmap and volcano plot (). The number of identical and expression-specific tRFs is shown in the Venn diagram (). The distribution of tRF subclasses is detailed in . All differentially expressed tRFs in the two groups are displayed in .
Figure 2. Expression profile of tRFs in podocytes of the HG group and control group. (A) Clustered heatmap of all tRFs in the HG and control groups. (B) Volcano plots of tRFs in the HG group compared to the control group. (C) tRFs commonly expressed and specifically expressed in the two groups. (D) Distribution of tRF subtypes in the two groups. (E) Distribution of tRFs in different tRNAs in the two groups. HG: high glucose; tRFs: tRNA-derived fragments.
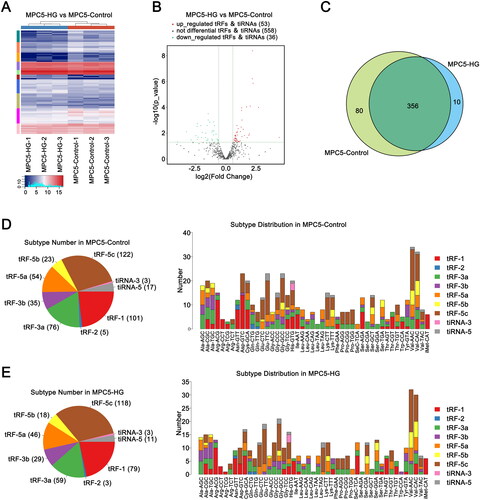
Table 2. Differentially expressed tRFs.
Validation of the expression levels of differentially expressed tRFs
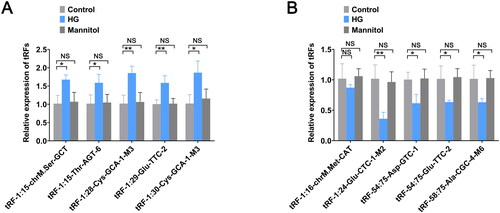
To validate the reliability of the sequencing results, we selected the 10 tRFs with the greatest expression differences (tRF-1:15-chrM.Ser-GCT, tRF-1:15-Thr-AGT-6, tRF-1:28-Cys-GCA-1-M3, tRF-1:29-Glu-TTC-2, tRF-1:30-Cys-GCA-1-M3, tRF-1:16-chrM.Met-CAT, tRF-1:24, tRF-54:75-Asp-GTC-1, tRF-54:75-Glu-TTC-2, and tRF-58:75-Ala-CGC-4-M6) and measured their expression. In the HG group, the expression levels of tRF-1:15-chrM.Ser-GCT, tRF-1:15-Thr-AGT-6, tRF-1:28-Cys-GCA-1-M3, tRF-1:29-Glu-TTC-2, and tRF-1:30-Cys-GCA-1-M3 were significantly upregulated (). The expression levels of tRF-1:24, tRF-54:75-Asp-GTC-1, tRF-54:75-Glu-TTC-2, and tRF-58:75-Ala-CGC-4-M6 were significantly downregulated, and the expression of tRF-1:16-chrM.Met-CAT was not significantly different between the two groups but was decreased in the HG group (). There was no significant difference in the expression levels of all tRFs in the mannitol group compared to the control group. All of these results were consistent with those obtained through our high-throughput sequencing analysis.
Figure 3. Validation of the expression levels of selected tRFs. (A) The expression levels of tRF-1:15-chrM.Ser-GCT, tRF-1:15-Thr-AGT-6, tRF-1:28-Cys-GCA-1-M3, tRF-1:29-Glu-TTC-2, and tRF-1:30-Cys-GCA-1-M3 were measured by RT-qPCR. (B) The expression levels of tRF-1:16-chrM. Met-CAT, tRF-1:24-Glu-CTC-M2, tRF-54:75-Asp-GTC-1, tRF-54:75-Glu-TTC-2, and tRF-58:75-Ala-CGC-4-M6 were measured by RT-qPCR. The data are expressed as the mean ± SD. *p < .05, **p < .01 vs. control group. NS: not significant; HG: high glucose; tRFs: tRNA-derived fragments; RT-qPCR: real-time quantitative polymerase chain reaction.
Prediction of target genes
To analyze the function of tRFs, target genes correlated to the 10 most differentially expressed tRFs were predicted using miRanda and TargetScan. tRF-1:15-chrM.Ser-GCT, tRF-1:15-Thr-AGT-6, tRF-1:28-Cys-GCA-1-M3, tRF-1:29-Glu-TTC-2, and tRF-1:30-Cys-GCA-1-M3 were associated with 604, 2249, 1562, 1416, and 1714 target genes, respectively; the numbers of target genes associated with tRF-1:16-chrM.Met-CAT, tRF-1:24, tRF-54:75-Asp-GTC-1, tRF-54:75-Glu-TTC-2, and tRF-58:75-Ala-CGC-4-M6 were 742, 3175, 251, 391, and 548, respectively. The 20 target genes with the highest tRF scores are listed in .
Table 3. Target genes in top 20.
GO and KEGG pathway analysis of target genes
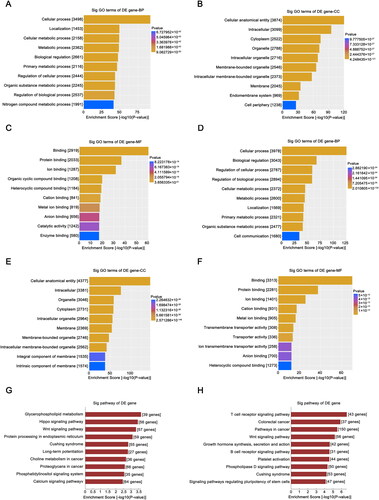
To further explore the potential functions of the tRFs, GO and KEGG analyses of the relevant target genes were performed. In this study, target genes corresponding to the five most upregulated tRFs and five most downregulated tRFs in the HG group identified and described above were predicted. GO analysis was first performed to predict the underlying functions of the target genes of the downregulated tRFs. In terms of biological process (BP), the main terms were ‘cellular processes’, ‘localization’, and ‘cellular metabolic processes’ (). The primary cellular component (CC) and molecular function (MF) terms are shown in . The potential functions of the upregulated tRF target genes were similar to those of the downregulated tRF target genes (). The results of KEGG pathway analysis of the upregulated and downregulated tRFs are listed separately in .
Figure 4. GO and KEGG analysis of target genes. GO analysis of target genes of downregulated tRFs; BP (A), CC (B), and MF (C) terms are included in the analysis. GO analysis of the target genes of upregulated tRFs, including BP (D), CC (E), and MF (F) terms. (G, H) KEGG pathway analysis of the target genes of selected differentially expressed tRFs. GO: Gene Ontology; KEGG: Kyoto Encyclopedia of Genes and Genomes; tRFs: tRNA-derived fragments; BP: biological process; CC: cellular component; MF: molecular function; Sig: significant.
Effect of tRF-1:24 overexpression on podocyte injury
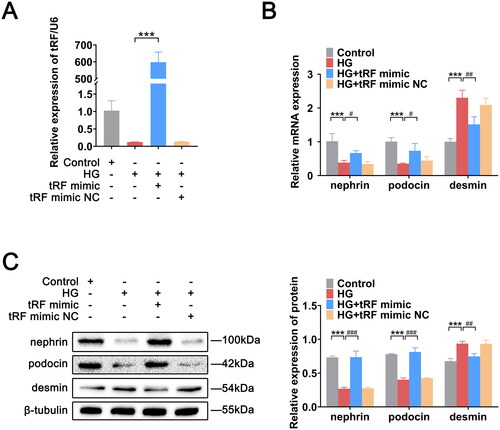
To explore the effect of tRFs on podocyte injury, we examined the expression levels of nephrin, podocin, and desmin after overexpressing tRF-1:24, which was the tRF with the most markedly high expression difference. The RT-qPCR results demonstrated that tRF-1:24 expression was significantly decreased in the HG group, whereas its expression was significantly increased after overexpression, indicating that the overexpression was successful (). Nephrin and podocin expression decreased and desmin expression increased in HG-induced podocytes; however, after tRF-1:24 was overexpressed, the nephrin and podocin expression levels increased, and the desmin expression levels decreased ().
Figure 5. Overexpression of tRF-1:24-Glu-CTC-1-M2 contributes to podocyte injury mitigation. (A) Successful transfection of tRF-1:24-Glu-CTC-1-M2 in podocytes. (B) Expression levels of nephrin, podocin, and desmin mRNAs. (C) Expression levels of nephrin, podocin, and desmin proteins. The data are expressed as the mean ± SD. ***p < .001, #p < .05, ##p < .01, and ###p < .001 vs. the indicated group. HG: high glucose; tRFs: tRNA-derived fragments.
Discussion
DKD is a common cause of end-stage renal diseases. When early diagnosis and intervention are provided to patients, the onset and progression of DKD is expected to be reduced or delayed. Some studies have confirmed a decrease in the number of podocytes early in DKD progression [Citation21], and highly differentiated podocytes are difficult to regenerate when damaged. Therefore, studying podocyte injury is particularly important.
A study by Mishima et al. presented exciting new insights into constitutive changes in tRNAs, which is an indicator of early acute cellular injury [Citation22]. tRFs have gradually become clinical biomarkers for some diseases [Citation23]. In this study, we successfully established a podocyte injury model in response to HG intervention and investigated the role of tRFs in podocyte injury induced by HG. We found 89 differentially expressed tRFs in the HG group compared to the control group, with 53 tRFs showing increased expression and 36 tRFs showing decreased expression. Our high-throughput sequencing results also showed the involvement of various types of tRFs, with tRF-5s accounting for the highest proportion. This result was similar to the sequencing result for HG-treated renal tubular epithelial cells observed in our previous study [Citation20]. It is hypothesized that tRF-5s play a particularly important role in DKD, and this supposition needs to be tested via further study in the future.
New tRFs are constantly being discovered, and their functions are being explored by researchers. Because of their sequence complementarity of tRFs, some biogenesis functional studies of tRFs have focused on whether they are similar to miRNAs. A meta-analysis by Kumar et al. showed that tRF-1 did not bind to any of the four argonaute (AGO) proteins, whereas tRF-3s and tRF-5s bound AGO1, AGO3, and AGO4 [Citation24]. tRFs may also exert regulatory effects by linking to RNA-binding proteins [Citation25]. Green et al. reported that the interaction between Y-box-binding protein 1 (YBX1), tRF-GlyTCC, and runt-related transcription factor 2 (RUNX2) led to the identification of new therapeutics [Citation26]. For some tRFs, ribosomes are direct cellular targets [Citation27,Citation28]; a few tRFs directly interfere with the translation initiation complex [Citation29]; and others directly target mRNA [Citation30].
To further explore the association of tRFs with podocyte injury and its possible underlying mechanisms, we selected 10 candidates based on sequencing results. For example, tRF-1:24 likely targets Akt serine/threonine kinase 2 (AKT2), indicating that it is involved in maintaining the viability and function of podocytes [Citation31], and tRF-1:29-Glu-TTC-2 is predicted to target semaphorin 3A (SEMA3A), which can protect podocytes against injury [Citation32,Citation33]. Urinary SEMA3A has been shown to be an early- and late-onset predictive biomarker of acute kidney injury [Citation34]. Jiang et al. proved that SEMA3A knockout alleviated HG-induced podocyte injury [Citation35]. tRF-1:15-Thr-AGT-6 may target transforming growth factor-β receptor-associated binding protein 1 (TGFBRAP1)/transforming growth factor beta 1 (TGFB1). Integrins are membrane glycoproteins that regulate a variety of biological functions, such as cell adhesion, migration, and differentiation [Citation36,Citation37]. Chen et al. found that TGFB1 regulates the expression of integrin-β1 and integrin-β3 through mitogen-activated protein kinases (MAPKs) and/or small mothers against decapentaplegic (Smad) pathways, thereby modulating podocyte adhesion and migration [Citation38]. Considering the GO enrichment analysis results, we gained an in-depth perspective of the functions of target genes and tRFs at three levels: MF, BP, and CC levels.
KEGG pathway analysis indicated that the predicted target genes were primarily abundant in the wingless-type MMTV integration site family member (Wnt) signaling pathway; the phospholipase D signaling pathway; signaling pathways related to the synthesis, secretion, and action of growth hormone (GH); the T-cell receptor pathway; and pathway regulating stem cell pluripotency. Persistent Wnt signaling promotes podocyte injury and proteinuria [Citation39,Citation40]. Phospholipase D produces phosphatidic acid, which is an essential activator of mammalian target of rapamycin (mTOR) signaling [Citation41,Citation42]. Excessive mobilization of mTOR complex 1 can cause podocyte dysfunction and injury and contribute to the progression of DKD [Citation43]. Reddy et al. identified podocytes as the targets of GH [Citation44]. Mukhi et al. observed that GH triggered TGFB1 expression in podocytes, leading to DKD [Citation45]. Stem cells, which are capable of differentiating into any cell in an organism, have potential applications in regenerative medicine. Studying the signaling pathways that regulate the pluripotency of stem cells is an excellent way to achieve success in regenerative medicine development. tRFs involved in signaling pathways that regulate stem cell pluripotency, as well as their targeted genes, may be the focus of research in the regenerative medicine field. Therefore, it is speculated that tRFs are potentially related to the aforementioned pathways and may be therapeutic targets for podocyte injury and DKD.
The expression of tRFs and the role of differentially expressed tRFs in podocytes with HG-induced injury have not been reported. tRF-1:24, which showed the greatest level of downregulation, was selected for analysis in our study. To date, there are no published reports on the role of tRF-1:24 in HG-induced podocyte injury. Therefore, focus of this study is novel. Nevertheless, there are still shortcomings in our study, the expression level of tRF-1:24 in vivo and discern related mechanisms need to be further explored.
In summary, our study revealed differentially expressed tRFs in podocytes with HG-induced injury, and they may function in signaling pathways related to Wnt, phospholipase D, and GH, regulating the pluripotency of stem cells and T-cell receptors by targeting genes. Podocyte injury was ameliorated after the successful overexpression of tRF-1:24, suggesting that tRF-1:24 may attenuate HG-induced podocyte injury. tRFs have the potential to be developed for the treatment of DKD; however, their mechanism of action in podocyte injury is unclear, and further studies are needed. In future experiments, we will investigate the expression of tRFs in animal models as well as in patients suffering from DKD and study the mechanism of action of tRFs in vitro and in animal models.
Author contributions
W.G. and A.Z. conceptualized the study and confirmed the authenticity of the original data. Z.Z. performed experiments and wrote the manuscript. Y.Q. assisted in the preparation of the figures and tables and participated in the data analysis. J.J. helped with editing the manuscript and graphical abstract. C.H. and H.S. performed sequencing. All the authors have read and approved the final manuscript.
Disclosure statement
No potential conflict of interest was reported by the author(s).
Data availability statement
The study data are available from the corresponding authors upon reasonable request.
Additional information
Funding
References
- American Diabetes Association. 11. Microvascular complications and foot care: standards of medical care in diabetes-2021. Diabetes Care. 2021;44(Suppl. 1):1–11. doi:10.2337/dc21-S011.
- International Diabetes Federation Atlas 10th Edition; 2021 [cited 2022 Aug 1]. Available from: https://diabetesatlas.org/atlas/tenth-edition/
- Mohandes S, Doke T, Hu H, et al. Molecular pathways that drive diabetic kidney disease. J Clin Invest. 2023;133(4):e165654. doi:10.1172/JCI165654.
- Dalla Vestra M, Masiero A, Roiter AM, et al. Is podocyte injury relevant in diabetic nephropathy? Studies in patients with type 2 diabetes. Diabetes. 2003;52(4):1031–1035. doi:10.2337/diabetes.52.4.1031.
- Watts AJB, Keller KH, Lerner G, et al. Discovery of autoantibodies targeting nephrin in minimal change disease supports a novel autoimmune etiology. J Am Soc Nephrol. 2022;33(1):238–252. doi:10.1681/ASN.2021060794.
- Ozawa S, Matsubayashi M, Nanaura H, et al. Proteolytic cleavage of podocin by matriptase exacerbates podocyte injury. J Biol Chem. 2020;295(47):16002–16012. doi:10.1074/jbc.RA120.013721.
- Kakimoto T, Okada K, Hirohashi Y, et al. Automated image analysis of a glomerular injury marker desmin in spontaneously diabetic torii rats treated with losartan. J Endocrinol. 2014;222(1):43–51. doi:10.1530/JOE-14-0164.
- Chen Q, Zhang X, Shi J, et al. Origins and evolving functionalities of tRNA-derived small RNAs. Trends Biochem Sci. 2021;46(10):790–804. doi:10.1016/j.tibs.2021.05.001.
- Weng Q, Wang Y, Xie Y, et al. Extracellular vesicles-associated tRNA-derived fragments (tRFs): biogenesis, biological functions, and their role as potential biomarkers in human diseases. J Mol Med. 2022;100(5):679–695. doi:10.1007/s00109-022-02189-0.
- Thompson DM, Lu C, Green PJ, et al. tRNA cleavage is a conserved response to oxidative stress in eukaryotes. RNA. 2008;14(10):2095–2103. doi:10.1261/rna.1232808.
- Gebetsberger J, Wyss L, Mleczko AM, et al. A tRNA-derived fragment competes with mRNA for ribosome binding and regulates translation during stress. RNA Biol. 2017;14(10):1364–1373. doi:10.1080/15476286.2016.1257470.
- Honda S, Loher P, Shigematsu M, et al. Sex hormone-dependent tRNA halves enhance cell proliferation in breast and prostate cancers. Proc Natl Acad Sci U S A. 2015;112(29):E3816–E3825. doi:10.1073/pnas.1510077112.
- Maute RL, Schneider C, Sumazin P, et al. tRNA-derived microRNA modulates proliferation and the DNA damage response and is down-regulated in B cell lymphoma. Proc Natl Acad Sci U S A. 2013;110(4):1404–1409. doi:10.1073/pnas.1206761110.
- Guzzi N, Bellodi C. Novel insights into the emerging roles of tRNA-derived fragments in mammalian development. RNA Biol. 2020;17(8):1214–1222. doi:10.1080/15476286.2020.1732694.
- Fu M, Gu J, Wang M, et al. Emerging roles of tRNA-derived fragments in cancer. Mol Cancer. 2023;22(1):30. doi:10.1186/s12943-023-01739-5.
- Li D, Zhang H, Wu X, et al. Role of tRNA derived fragments in renal ischemia–reperfusion injury. Ren Fail. 2022;44(1):815–825. doi:10.1080/0886022X.2022.2072336.
- Pan Q, Han T, Li G. Novel insights into the roles of tRNA-derived small RNAs. RNA Biol. 2021;18(12):2157–2167. doi:10.1080/15476286.2021.1922009.
- Shi H, Yu M, Wu Y, et al. tRNA-derived fragments (tRFs) contribute to podocyte differentiation. Biochem Biophys Res Commun. 2020;521(1):1–8. doi:10.1016/j.bbrc.2019.09.009.
- Li S, Liu Y, He X, et al. tRNA-derived fragments in podocytes with adriamycin-induced injury reveal the potential mechanism of idiopathic nephrotic syndrome. Biomed Res Int. 2020;2020:7826763. doi:10.1155/2020/7826763.
- Ji J, Rong J, Zheng H, et al. Expression profiles of tRNA‑derived fragments in high glucose‑treated tubular epithelial cells. Exp Ther Med. 2022;25(1):26. doi:10.3892/etm.2022.11725.
- Shirato I, Hosser H, Kimura K, et al. The development of focal segmental glomerulosclerosis in Masugi nephritis is based on progressive podocyte damage. Virchows Arch. 1996;429(4–5):255–273. doi:10.1007/BF00198342.
- Mishima E, Inoue C, Saigusa D, et al. Conformational change in transfer RNA is an early indicator of acute cellular damage. J Am Soc Nephrol. 2014;25(10):2316–2326. doi:10.1681/ASN.2013091001.
- Jia Y, Tan W, Zhou Y. Transfer RNA-derived small RNAs: potential applications as novel biomarkers for disease diagnosis and prognosis. Ann Transl Med. 2020;8(17):1092–1092. doi:10.21037/atm-20-2797.
- Kumar P, Anaya J, Mudunuri SB, et al. Meta-analysis of tRNA derived RNA fragments reveals that they are evolutionarily conserved and associate with AGO proteins to recognize specific RNA targets. BMC Biol. 2014;12(1):78. doi:10.1186/s12915-014-0078-0.
- Han L, Lai H, Yang Y, et al. A 5′-tRNA halve, tiRNA-Gly promotes cell proliferation and migration via binding to RBM17 and inducing alternative splicing in papillary thyroid cancer. J Exp Clin Cancer Res. 2021;40(1):222. doi:10.1186/s13046-021-02024-3.
- Green D, Singh A, Tippett VL, et al. YBX1-interacting small RNAs and RUNX2 can be blocked in primary bone cancer using CADD522. J Bone Oncol. 2023;39:100474. doi:10.1016/j.jbo.2023.100474.
- Gebetsberger J, Zywicki M, Künzi A, et al. tRNA-derived fragments target the ribosome and function as regulatory non-coding RNA in Haloferax volcanii. Archaea. 2012;2012:260909–260911. doi:10.1155/2012/260909.
- Magee R, Rigoutsos I. On the expanding roles of tRNA fragments in modulating cell behavior. Nucleic Acids Res. 2020;48(17):9433–9448. doi:10.1093/nar/gkaa657.
- Ivanov P, Emara MM, Villen J, et al. Angiogenin-induced tRNA fragments inhibit translation initiation. Mol Cell. 2011;43(4):613–623. doi:10.1016/j.molcel.2011.06.022.
- Boskovic A, Bing XY, Kaymak E, et al. Control of noncoding RNA production and histone levels by a 5′ tRNA fragment. Genes Dev. 2020;34(1–2):118–131. doi:10.1101/gad.332783.119.
- Canaud G, Bienaimé F, Viau A, et al. AKT2 is essential to maintain podocyte viability and function during chronic kidney disease. Nat Med. 2013;19(10):1288–1296. doi:10.1038/nm.3313.
- Das F, Ghosh-Choudhury N, Lee DY, et al. Akt2 causes TGFβ-induced deptor downregulation facilitating mTOR to drive podocyte hypertrophy and matrix protein expression. PLOS One. 2018;13(11):e0207285. doi:10.1371/journal.pone.0207285.
- Fei B, Zhou H, He Z, et al. KCNQ1OT1 inhibition alleviates high glucose-induced podocyte injury by adsorbing miR-23b-3p and regulating Sema3A. Clin Exp Nephrol. 2022;26(5):385–397. doi:10.1007/s10157-021-02173-x.
- Doi K, Noiri E, Nangaku M, et al. Repulsive guidance cue semaphorin 3A in urine predicts the progression of acute kidney injury in adult patients from a mixed intensive care unit. Nephrol Dial Transplant. 2014;29(1):73–80. doi:10.1093/ndt/gft414.
- Jiang Z, Qian L, Yang R, et al. LncRNA TCF7 contributes to high glucose-induced damage in human podocytes by up-regulating SEMA3A via sponging miR-16-5p. J Diabetes Investig. 2023;14(2):193–204. doi:10.1111/jdi.13904.
- Salicioni AM, Gaultier A, Brownlee C, et al. Low density lipoprotein receptor-related protein-1 promotes beta1 integrin maturation and transport to the cell surface. J Biol Chem. 2004;279(11):10005–10012. doi:10.1074/jbc.M306625200.
- Kamranvar SA, Rani B, Johansson S. Cell cycle regulation by integrin-mediated adhesion. Cells. 2022;11(16):2521. doi:10.3390/cells11162521.
- Chen CA, Chang JM, Chang EE, et al. TGF-β1 modulates podocyte migration by regulating the expression of integrin-β1 and -β3 through different signaling pathways. Biomed Pharmacother. 2018;105:974–980. doi:10.1016/j.biopha.2018.06.054.
- Schunk SJ, Floege J, Fliser D, et al. WNT-β-catenin signalling – a versatile player in kidney injury and repair. Nat Rev Nephrol. 2021;17(3):172–184. doi:10.1038/s41581-020-00343-w.
- Bose M, Almas S, Prabhakar S. Wnt signaling and podocyte dysfunction in diabetic nephropathy. J Investig Med. 2017;65(8):1093–1101. doi:10.1136/jim-2017-000456.
- Mansfeld J, Ulbrich-Hofmann R. Modulation of phospholipase D activity in vitro. Biochim Biophys Acta. 2009;1791(9):913–926. doi:10.1016/j.bbalip.2009.03.003.
- Bernfeld E, Menon D, Vaghela V, et al. Phospholipase D-dependent mTOR complex 1 (mTORC1) activation by glutamine. J Biol Chem. 2018;293(42):16390–16401. doi:10.1074/jbc.RA118.004972.
- Huynh C, Ryu J, Lee J, et al. Nutrient-sensing mTORC1 and AMPK pathways in chronic kidney diseases. Nat Rev Nephrol. 2023;19(2):102–122. doi:10.1038/s41581-022-00648-y.
- Reddy GR, Pushpanathan MJ, Ransom RF, et al. Identification of the glomerular podocyte as a target for growth hormone action. Endocrinology. 2007;148(5):2045–2055. doi:10.1210/en.2006-1285.
- Mukhi D, Kolligundla LP, Maruvada S, et al. Growth hormone induces transforming growth factor-β1 in podocytes: implications in podocytopathy and proteinuria. Biochim Biophys Acta Mol Cell Res. 2023;1870(2):119391. doi:10.1016/j.bbamcr.2022.119391.