
Abstract
Background
Renal impairment has been previously linked to peripheral eosinophil count (PEC), prompting an investigation into its potential relationship with chronic kidney disease (CKD). This cross-sectional study utilized data from the National Health and Nutrition Examination Survey (NHANES 1999–2018) to comprehensively explore the association between PEC and CKD.
Methods
Survey-weighted generalized multivariate linear regression was employed to evaluate the associations between PEC, urinary albumin-to-creatinine ratio (UACR), and estimated glomerular filtration rate (eGFR), with meticulous adjustment for potential covariates. To assess non-linear correlations, a restricted cubic spline analysis was conducted. Sensitivity analysis was performed to test the stability of results.
Results
The study included a total of 9224 participants with non-dialysis CKD. In the multivariate linear regression model, after comprehensive adjustment for potential covariates, PEC showed a negative association with eGFR (β per 100 cells/uL increase in PEC, −0.71; 95% CI, −1.04, −0.37), while demonstrating a positive trend with UACR (β per 100 cells/uL increase in PEC, 10.21; 95% CI, 1.37, 19.06). The restrictive cubic spline curve analysis suggested that these associations occurred within the range of 0 to 400 cells/uL for PEC. Sensitivity analysis supported the stability of the observed results.
Conclusions
Circulating eosinophil levels are negatively correlated with eGFR and demonstrate a positive trend with UACR, when PEC falls within the range of less than 400 cells/uL among adults with CKD. Further research is warranted to validate these findings.
Introduction
Chronic kidney disease (CKD) has emerged as a significant global public health challenge, marked by a relatively unfavorable prognosis characterized by elevated mortality rates associated with cardiovascular death, infection, and stroke [Citation1]. The global all-age mortality rate attributable to CKD increased by 41.5% between 1990 and 2017 according to the Global Burden of Disease, Injuries, and Risk Factors Study [Citation2]. A key player in the occurrence, progression, and complications of CKD is chronic inflammation [Citation3], which can be preliminarily assessed through leukocyte and differential count analysis. Eosinophils, closely associated with inflammation and immune responses, have been linked to hypersensitivity reactions, allergic responses, and asthma [Citation4]. Over the past two decades, eosinophils have garnered attention for their pathophysiologic roles in various chronic diseases, including cardiovascular disease, diabetes, and CKD [Citation5].
Several studies have suggested a correlation between peripheral eosinophil counts (PEC) and CKD, encompassing disease incidence, progression, and prognosis [Citation6–18] (). It has been reported that patients with CKD exhibit higher PEC compared to non-CKD individuals [Citation16]. Cardiac patients in advanced CKD stages have shown significantly elevated PEC [Citation15]. Furthermore, high PEC levels (≥300 cells/µL) have been associated with CKD progression, higher all-cause mortality, and death compared to those with PEC <300 cells/µL [Citation7]. Studies have also indicated that receiving renal replacement therapy, including hemodialysis, peritoneal dialysis, and kidney transplantation, may lead to an increase in PEC levels or an elevated risk of eosinophilia [Citation10,Citation11,Citation19]. However, there is limited contradictory evidence available to clarify the association between PEC and the severity of renal impairment, such as albuminuria and glomerular filtration rate. While some studies suggested that patients with high PEC levels are more likely to have a lower estimated glomerular filtration rate (eGFR) and higher proteinuria [Citation6], others, like Yen CH et al. have reported that PEC was not significantly higher in CKD patients compared to the non-CKD population and was not significantly correlated with eGFR [Citation9]. Additionally, potential biases may influence the findings of existing studies due to small sample sizes and a lack of adjustment for potential confounders. Furthermore, it remains unclear whether there is a linear or non-linear association between PEC, UACR and eGFR. Given these uncertainties, this study was designed to elucidate the association between PEC and the severity of kidney impairment assessed by albuminuria and eGFR among individuals with CKD, using a large sample of nationally representative community adults from the National Health and Nutrition Examination Survey (NHANES).
Table 1. Evidence Supporting the association between PEC and CKD.
Patients and methods
Study population
The data of this study were derived from NHANES, which is an ongoing cross-sectional, multistage, stratified survey conducted to assess the nationally representative nutritional and health status of American civilians. Ethical approval for the NHANES protocol was obtained from the National Center for Health Statistics Ethics Review Board, and informed consents were signed by all the participants. For the evaluation of the association between PEC and parameters related to CKD, we utilized data from ten cycles of NHANES spanning from 1999 to 2018, comprising a total of 101,316 participants, including 59,204 adults.
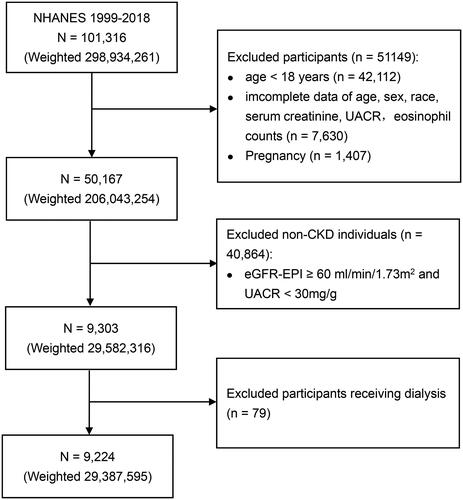
CKD was defined using established criteria, specifically an eGFR of less than 60 mL/min/1.73 m2 determined by the CKD-EPI creatinine equation (Supplementary Table 1), or a urinary albumin-to-creatinine ratio (UACR) of 30 mg/g or higher [Citation20]. To ensure the accuracy of CKD identification, participants with incomplete data on age, sex, race, serum creatinine, and UACR (n = 7630) were excluded. Furthermore, pregnant women (n = 1407) and individuals without CKD (n = 40,864) were excluded from the study cohort. Given the potential association between eosinophilia and hemodialysis as well as peritoneal dialysis, we excluded participants receiving either of these treatments (n = 79) [Citation10,Citation11]. Ultimately, the analysis was conducted among a total of 9224 patients with CKD, who formed the study’s final participant population. The participant selection process is visually detailed in , outlining the sequential steps used to identify the study cohort.
Figure 1. Flowchart of participants selection. CKD: chronic kidney disease; eGFR-EPI: estimated glomerular filtration rate based on the EPI formula; UACR: urinary albumin to creatinine ratio. Weighted numbers are the representative national estimates, after incorporating sample weights, strata, and primary sampling units in accordance with NHANES recommendations.
Measurement of complete blood count and standard biochemistry
Blood specimens were measured at the NHANES mobile examination centers. The method for deriving complete blood count parameters was based on the Beckman Coulter methodology of counting and sizing, in combination with an automatic diluting and mixing device for sample processing. For white blood cells (WBC) differential, three simultaneous measurements of individual cell volume, high-frequency conductivity, and laser light scatter were employed. The concentration of creatinine in both serum and urine samples was determined using the Jaffe rate method, with measurements conducted on the DxC800 modular chemistry side. To assess urinary albumin concentration, a fluorescent immunoassay was utilized. UACR was calculated using the following formula: UACR (mg/g) = urinary albumin (mg/dL) / urinary creatinine (g/dL). A comprehensive description of the laboratory methodology used in this study can be accessed on the NHANES website, providing detailed information on the analytical techniques employed for assessing blood and urine parameters.
Covariates
Several confounding factors have been previously found to be associated with PEC and CKD, and were identified as covariates, such as demographic factors [Citation9], body mass index (BMI) [Citation21,Citation22], smoking behavior [Citation21,Citation22], hypertension [Citation8], diabetes [Citation23], and asthma [Citation24,Citation25]. Demographic data, such as age, sex, and race/ethnicity, were collected using standardized questionnaires. Race was categorized into five groups: non-Hispanic white, non-Hispanic black, Mexican American, other Hispanic, and others. Smoking status was divided into three categories: never smokers, current smokers, and former smokers. Participants who had smoked fewer than 100 cigarettes during their lifetime were classified as never smokers. Those who had smoked more than 100 cigarettes and were currently smoking were considered as current smokers. Participants who had smoked more than 100 cigarettes but had quit smoking were classified as former smokers. BMI was categorized into three groups: <25, 25 to 29.9, and ≥30 kg/m2. Hypertension was determined based on self-reported medical diagnosis or systolic blood pressure ≥140 mmHg or diastolic blood pressure ≥90 mmHg during the physical examination. Diabetes was defined as a medical diagnosis of diabetes mellitus by a doctor or having a glycated hemoglobin A1c level ≥7.0%. Participants who had been diagnosed with asthma by a doctor or other health professional were considered to have asthma. Due to the 20-year survey period, which may potentially affect the correlation between PEC and the pre-defined outcomes, we included the NHANES cycle as an additional covariate. These covariates were taken into account during the statistical analysis to control for their potential influence on the association between PEC and CKD parameters.
Statistical analysis
All the analyses incorporated sample weights, strata, and primary sampling units to assess representative national estimates according to NHANES recommendations. Descriptive statistics were presented as numbers (percentages) for categorical variables and as medians (interquartile ranges, IQR) for continuous variables. To assess the differences between quartiles of PEC, one-way ANOVA tests, Kruskal-Wallis test, and χ2 test were utilized based on the variable type. Survey-weighted generalized multivariate linear regression was employed to evaluate the associations between PEC and both UACR and eGFR. Three regression models were implemented. Model 1 was unadjusted for any covariates. Model 2 was adjusted for age (continuous), sex (male or female), and race/ethnicity. Model 3 was further adjusted for additional covariates, including BMI (<25, 25 ∼ 29.9, and 30 kg/m2), white blood cell count (WBC, continuous), smoking behavior (former, current, or never smoker), hypertension (yes or no), diabetes (yes or no), asthma (yes or no), UACR (≥ 30 or <30 mg/g) or eGFR (≥ 60 or <60 mL/min/1.73m2), and NHANES cycles (1999–2000, 2001–2002, 2003–2004, 2005–2006, 2007–2008, 2009–2010, 2011–2012, 2013–2014, 2015–2016, 2017–2018). A restricted cubic spline was utilized to investigate the dose-response correlation between PEC and CKD parameters, and non-linear association was assessed using the likelihood ratio test. For the cubic spline, five knots were placed at the 5th, 27.5th, 50th, 72.5th, and 95th percentiles of the PEC distribution.
Subgroup analyses were conducted to explore potential variations in the associations by age (≥ 60 or < 60 years), sex (female or male), race (White and Black), CKD stages (1 or 2 or 3a or 3b or 4 or 5), UACR (≥ 30 or <30 mg/g), BMI (≥ 30 or <30 kg/m2), hypertension (yes or no), diabetes (yes or no), and smoking status (never or current/former smoker). In sensitivity analysis, the extreme 5% of PEC outliers were excluded to reduce their potential influence. As a part of additional sensitivity analysis, the associations between the percentage of eosinophils in WBC and UACR and eGFR were further explored.
All statistical analyses were performed using R studio (version 2022.07.2 Build 576, open-source edition). Two-sided P value less than 0.05 was considered as statistically significant.
Results
Baseline characteristics
The baseline characteristics stratified by quartiles of PEC among the 9224 patients with CKD in NHANES 1999–2018 are presented in . The median age of the participants was 64 years, with 52.52% being female. The median PEC was 176 cells/uL. Patients with higher PEC were observed to be older [Q4 vs. Q1: 66 (52, 76) vs. 60 (42, 74) years], less likely to be female (female, Q4 vs. Q1: 43.45% vs. 59.71%), more likely to be non-Hispanic white (Q4 vs. Q1: 50.98% vs. 40.73%), and less likely to be non-Hispanic black (Q4 vs. Q1: 20.01% vs. 31.56%). Moreover, participants in the higher quartile of PEC exhibited lower eGFR [Q4 vs. Q1: 59.16 (49.71, 91.63) vs. 77.58 (54.38, 102.09) mL/min/1.73m2] and higher BMI [Q4 vs. Q1: 29.50 (25.40, 34.60) vs. 27.30 (23.42, 32.05) kg/m2]. Patients with higher PEC were also more likely to have hypertension (Q4 vs. Q1: 71.79% vs. 62.65%), diabetes (Q4 vs. Q1: 35.23% vs. 24.56%), and asthma (Q4 vs. Q1: 16.34% vs. 10.98%). Smoking behavior showed correlation with a higher quartile of PEC (current smokers, Q4 vs. Q1: 19.75% vs. 13.71%). There was no significant difference in the proportion of participants from NHANES cycles across different quartiles of PEC.
Table 2. Baseline characteristics of participants with chronic kidney disease stratified by quartiles of eosinophil counts.
Association between PEC and CKD parameters
In all the three regression models, PEC demonstrated a negative association with eGFR (model 3: β per 100 cells/uL increase in PEC, −0.71; 95% CI, −1.04, −0.37) and a positive trend with UACR (model 3: β per 100 cells/uL increase in PEC, 10.21; 95% CI, 1.37, 19.06) (). These associations were consistently observed and further supported by comparisons between quartiles of PEC, with all P values for trend being less than 0.005 (). We also examined the association between PEC and CKD stages, revealing a positive correlation (Supplementary Table 2).
Table 3. Associations between eosinophil counts and UACR and eGFR.
Dose-response analysis
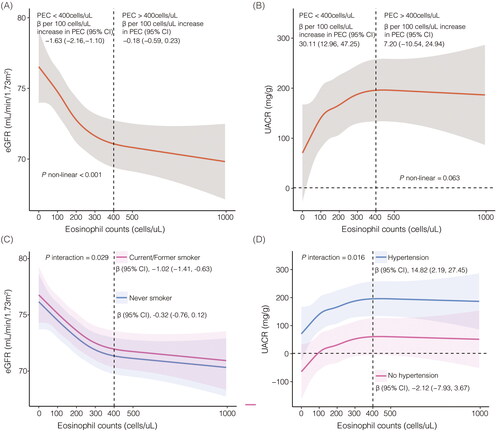
The restricted cubic spline analysis was conducted to explore the dose-response associations between PEC and UACR, as well as eGFR (). For the association between PEC and UACR, a linear positive trend was observed (p = 0.063). Specifically, when PEC was less than 400 cells/uL, a significant positive correlation with UACR was found (model 3: β per 100 cells/uL increase in PEC, 30.11; 95% CI, 12.96, 47.25), whereas this positive trend was not statistically significant when PEC exceeded 400 cells/uL (model 3: β per 100 cells/uL increase in PEC, 7.20; 95% CI, −10.54, 24.94). Regarding the association between PEC and eGFR, a non-linear negative correlation was observed (p < 0.001). Notably, a significant negative correlation was found when PEC was less than 400 cells/uL (model 3: β per 100 cells/uL increase in PEC, −1.63; 95% CI, −2.16, −1.10). However, this negative association was not statistically significant when PEC exceeded 400 cells/uL (model 3: β per 100 cells/uL increase in PEC, −0.18; 95% CI, −0.59, 0.23).
Figure 2. Restricted cubic spline curve for the association between eosinophils, albuminuria and estimated glomerular filtration rate. eGFR: estimated glomerular filtration rate; UACR: urinary albumin to creatinine ratio. A, eosinophils and eGFR in model 3; B, eosinophils and UACR in model 3; C, subgroup analysis for eosinophils and eGFR stratified by smoking status in model 3; D, subgroup analysis for eosinophils and UACR stratified by hypertension in model 3. Model 3 was adjusted for age (continuous), sex (male or female), race/ethnicity, BMI (<25, 25 ∼ 29.9, and 30 kg/m2), WBC (continuous), smoking behavior (former, current, or never smoker), hypertension (yes or no), diabetes (yes or no), asthma (yes or no), and UACR (≥ 30 or <30 mg/g) or eGFR (≥ 60 or <60mL/min/1.73m2), and NHANES cycles (1999–2000, 2001–2002, 2003–2004, 2005-2006, 2007-2008, 2009-2010, 2011–2012, 2013–2014, 2015-2016, 2017-2018).
Subgroup analysis
We conducted subgroup analyses based on various characteristics, including age, gender, race, hypertension, diabetes, BMI, and smoking status, as well as different degrees of renal impairment stratified CKD stages (). For participants over 60 years old, there was a positive correlation between PEC and UACR (model 3: β per 100 cells/uL increase in PEC, 12.25; 95% CI, 3.44, 21.06), while no significant difference of this correlation was found among those under 60 years old. Further analyses revealed that PEC was positively associated with UACR among White individuals (model 3: β per 100 cells/uL increase in PEC, 10.96; 95% CI, 2.61, 19.32), but not among Black individuals. Similarly, in participants with a smoking history, PEC exhibited a positive trend with UACR (model 3: β per 100 cells/uL increase in PEC, 16.31; 95% CI, 3.19, 29.42), whereas there was no significant correlation observed among those who never smoked. The positive trend between PEC and UACR was observed in patients with hypertension (model 3: β per 100 cells/uL increase in PEC, 14.82; 95% CI, 2.19, 27.45), while there was no statistical difference among non-hypertensive individuals. In addition, PEC showed a positive association with UACR in individuals with diabetes (model 3: β per 100 cells/uL increase in PEC, 35.73; 95% CI, 10.31, 61.15). A positive association between PEC and UACR was observed among participants with CKD stage 2 (model 3: β per 100 cells/uL increase in PEC, 23.42; 95% CI, 8.37, 38.46), but not among other CKD stages. Regarding the associations with eGFR, PEC demonstrated a negative correlation eGFR, except in non-hypertensive individuals, non-smoking population, and obese people. Similar results were obtained when analyzing PEC quartiles as variables (Supplementary Table 3 and Supplementary Table 4).
Figure 3. Subgroup analysis between eosinophils and albuminuria and estimated glomerular filtration rate in fully adjusted model. eGFR, estimated glomerular filtration rate; UACR, urinary albumin to creatinine ratio. Fully adjusted model was adjusted for age (continuous), sex (male or female), race/ethnicity, BMI (<25, 25 ∼ 29.9, and 30 kg/m2), WBC (continuous), smoking behavior (former, current, or never smoker), hypertension (yes or no), diabetes (yes or no), asthma (yes or no), and UACR (≥ 30 or <30 mg/g) or eGFR (≥ 60 or <60mL/min/1.73m2), and NHANES cycles (1999–2000, 2001–2002, 2003–2004, 2005–2006, 2007–2008, 2009–2010, 2011–2012, 2013–2014, 2015–2016, 2017–2018).
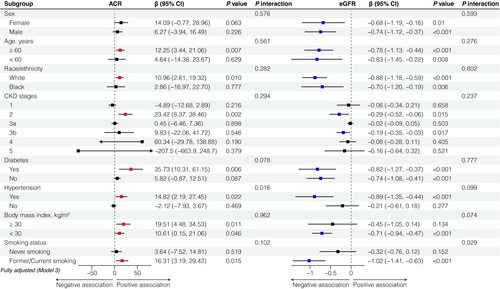
The interaction analysis revealed that smoking behavior exhibited interactive effects on the correlation between PEC and eGFR (p = 0.029) (), while hypertension exerted positive interaction effects on the association between PEC and UACR (p = 0.016) ().
Sensitivity analysis
When the participants with extreme 5% of PEC were excluded (< 51 or > 504 cells/uL), the results were also stable (). Moreover, the percentage of eosinophils in WBC was consistently negatively correlated with eGFR in all regression models, and the association between the percentage of eosinophils and UACR exhibited a positive trend when comparing eosinophil quartiles (Supplementary Table 5).
Table 4. Sensitivity analysis.
Discussion
The results of this cross-sectional study suggested a positive trend between PEC and UACR, and a negative correlation with eGFR in patients with CKD among American adults. These associations remained significant even after adjusting for potential confounding factors such as demographics, circulating leukocyte count, comorbidities. Stratified analyses revealed that the positive trend with UACR were mainly observed in specific subgroups, including females, individuals aged 60 years or older, White race, patients with CKD stage 2, hypertensive individuals, diabetic people, and smokers. Conversely, the negative correlation between PEC and eGFR persisted, except in non-hypertensive individuals, non-smokers, obese participants, and patients with CKD stages 1, 3a 4–5. The results from the restricted cubic spline analysis indicated a non-linear association. Specifically, when PEC was less than 400 cells/uL, UACR increased with the rise in PEC, while eGFR decreased. However, when PEC exceeded 400 cells/uL, neither UACR nor eGFR changed significantly. These findings suggested that glomerular injury may worsen with increasing PEC, even within the normal range, indicating a potential harmful role of PEC in CKD.
Previous reports have provided evidence of the potential association between PEC and CKD. Nakhjavani et al. observed that diabetic patients with CKD had higher eosinophil counts compared to diabetic patients without CKD and healthy individuals. Furthermore, they found a significant negative correlation between eGFR and PEC after accounting for conventional diabetes risk factors [Citation14]. Fukui et al. found a significant positive association between PEC and UACR in men with type 2 diabetes, but this association was not observed in women. This discrepancy may be attributed to differences in race, as the participants in Fukui et al.’s study mainly came from East Asia, while our study involved American individuals [Citation18]. Several studies have also indicated a potential harmful role of PEC in the progression of early CKD to end-stage kidney disease (ESKD). Yen et al. reported that rapid renal progression, defined as a reduction in eGFR of 30% or greater within two years, was significantly associated with higher PEC [Citation9].
Our subgroup analysis revealed that the association between PEC and CKD was statistically significant in individuals with diabetes mellitus, hypertension, and a history of smoking, which aligns with findings from the study conducted by Pongdee et al. [Citation8]. Interestingly, a positive association was found between PEC and the intima-media thickness of the common carotid artery in type 2 diabetes, suggesting a potential link between PEC, arteriosclerosis, and its impact on hemodynamics, ultimately playing a role in the occurrence and development of CKD [Citation26]. These findings collectively indicate the potential importance of PEC as a marker in the context of CKD and its association with various risk factors and disease progression. The relationship between PEC and CKD appears complex and multifactorial, warranting further research to elucidate the underlying mechanisms and establish its clinical relevance.
Eosinophils are often found in kidney biopsy of drug-induced interstitial nephritis, and also can be detected in other glomerular diseases, which increases the possibility that these cells may participate in CKD and renal fibrosis more broadly [Citation27,Citation28]. Recent research by Colon et al. demonstrated that eosinophils accumulating in the renal interstitium can modulate the inflammatory response and promote renal fibrosis through eosinophil peroxidase activity in a time- and disease- specific manner [Citation29]. Moreover, findings from Tariq et al. indicated that peripheral eosinophilia was significantly associated with the presence of eosinophils in kidney tissue. This association was observed even after adjusting for factors such as hypertension, proteinuria, and eGFR at the time of kidney biopsy [Citation12]. Wu et al. observed an association between PEC and proteinuria, tubulointerstitial inflammatory cell infiltration, and poor renal prognosis in patients with diabetic nephropathy [Citation30]. Coincidentally, a recent study confirmed the causal relationship between eosinophils and an increased risk of diabetic nephropathy using Mendelian randomization analysis [Citation31]. These findings suggested that eosinophils in the blood may have a causal relationship with interstitial eosinophilic aggregates in renal tissue, potentially influencing the development and progression of CKD and even leading to ESKD, as indicated by two recent cohorts [Citation6]. Furthermore, eosinophil fractions were found to be positively associated with glomerular basement membrane width and negatively associated with glomerular filtration surface density, which may contribute to albuminuria [Citation32]. These collective evidence from studies exploring eosinophil involvement in renal diseases provides valuable insights into the potential pathogenic role of eosinophils in CKD. Our study adds to this body of knowledge, as we found that PEC may serve as a potential predictor for kidney injury and is associated with the severity of glomerular impairment assessed by UACR and eGFR among individuals with CKD.
This study has several strengths that enhance the validity and reliability of the findings. Firstly, the use of data from NHANES, a nationally representative survey, allows for generalizability of the results to the broader American population. Additionally, the large sample size and long survey period spanning 20 years contribute to the robustness of the study. The characteristics of included participants reflect the equilibrium of PECs across NHANES cycles, and the introduction of NHANES cycle as a covariate ensured the stability of the regression analysis results. The weighted analysis ensures that the estimates are representative of the entire population and account for the complex survey design. Secondly, the inclusion of restricted cubic spline analysis provides valuable insights into the non-linear associations between PEC and UACR and eGFR, offering a more comprehensive understanding of the relationships between these variables. Conducting sensitivity analysis to assess the stability of the results is another strength of this study. By excluding extreme values of PEC, the researchers demonstrated the robustness of their findings and reduce the influence of extreme values on the overall results.
The originality of this study lies in revealing the complex non-linear association between PEC and UACR, as well as eGFR, within a large CKD population. By employing a combination of multiple linear regression and restricted cubic spline analysis, our findings offer a new perspective for clinicians: PECs might be associated with UACR and eGFR even within the normal range. Consequently, investigating the reasons behind elevated PECs and working toward their reduction could prove beneficial in alleviating albuminuria and delaying the progression of renal failure. Furthermore, our study underscores the importance of monitoring PEC levels among patients with CKD.
There are several limitations that should be acknowledged. Firstly, the causal correlation between PEC and CKD parameters could not be clearly determined and the dynamic associations could not be clarified, due to cross-sectional design. Therefore, it is essential to interpret the findings with caution and avoid drawing definitive causal inferences from the results. Furthermore, although sensitivity analysis was conducted to confirm the positive trend between PEC and UACR using eosinophil percentages, the lack of statistical significance in the overall linear regression models suggests some uncertainty in this association. This underscores the need for further research to explore potential confounding variables that may impact the observed associations. Thirdly, our ability to exclude participants who have received dialysis is feasible, but we cannot exclude individuals who have undergone kidney transplantation due to the lack of available data in NHANES. This limitation could potentially introduce bias into our results, as there may be a correlation between eosinophilia and dialysis as well as kidney transplantation [Citation33].
In conclusion, our study provides evidence for a positive trend between circulating eosinophils and UACR, as well as a negative correlation with eGFR among American adults with CKD when PEC levels are below 400 cells/uL. These findings shed light on the potential role of eosinophils in kidney injury and glomerular function in individuals with CKD. Such knowledge may lead to novel therapeutic strategies for individuals with CKD and improve their clinical outcomes.
Authors’ contributions
Li Shang contributed to the study design; Shisheng Han, Meng Jia, and Wenli Yuan performed the data analysis; Shisheng Han completed the original manuscript; Yan Lu, Yanqiu Xu, and Yi Wang participated in the revision of this manuscript. All authors have approved the final manuscript.
Supplemental Material
Download PDF (213.7 KB)Acknowledgments
We thank the participants and staff of NHANES involved in this study, as all the data were derived from NHANES.
Disclosure statement
No potential conflict of interest was reported by the author(s).
Data availability statement
The data used this study are openly available in NHANES at https://www.cdc.gov/nchs/nhanes/.
Additional information
Funding
References
- Liyanage T, Toyama T, Hockham C, et al. Prevalence of chronic kidney disease in Asia: a systematic review and analysis. BMJ Glob Health. 2022;7(1):1. doi: 10.1136/bmjgh-2021-007525.
- GBD Chronic Kidney Disease Collaboration. Global, regional, and national burden of chronic kidney disease, 1990-2017: a systematic analysis for the global burden of disease study 2017. Lancet. 2020;395(10225):709–11. doi: 10.1016/S0140-6736(20)30045-3.
- Kadatane SP, Satariano M, Massey M, et al. The role of inflammation in CKD. Cells. 2023;12(12):1581. doi: 10.3390/cells12121581.
- Akuthota P, Wang HB, Spencer LA, et al. Immunoregulatory roles of eosinophils: a new look at a familiar cell. Clin Exp Allergy. 2008;38(8):1254–1263. doi: 10.1111/j.1365-2222.2008.03037.x.
- Syeda MZ, Hong T, Zhang C, et al. Eosinophils: a friend or foe in human health and diseases. Kidney Dis. 2022;9(1):26–38. doi: 10.1159/000528156.
- Hattori K, Sakaguchi Y, Oka T, et al. Interstitial eosinophilic aggregates and kidney outcome in patients with CKD. Clin J Am Soc Nephrol. 2023;18(12):1563–1572. doi: 10.2215/CJN.0000000000000277.
- Kielar D, Jones AM, Wang X, et al. Association between elevated blood eosinophils and chronic kidney disease progression: analyses of a large United States electronic health records database. Int J Nephrol Renovasc Dis. 2023;16:269–280. doi: 10.2147/IJNRD.S431375.
- Pongdee T, Manemann SM, Decker PA, et al. Rethinking blood eosinophil counts: epidemiology, associated chronic diseases, and increased risks of cardiovascular disease. J Allergy Clin Immunol Glob. 2022;1(4):233–240. doi: 10.1016/j.jacig.2022.09.001.
- Yen CH, Wu IW, Lee CC, et al. The prognostic value of peripheral total and differential leukocyte count in renal progression: a community-based study. PLOS One. 2021;16(10):e0258210. doi: 10.1371/journal.pone.0258210.
- Kang DH, Lee Y, Kleine CE, et al. Eosinophil count and mortality risk in incident hemodialysis patients. Nephrol Dial Transplant. 2020;35(6):1032–1042. doi: 10.1093/ndt/gfz296.
- Yang J, Fan J, Fan L, et al. Higher eosinophils predict death-censored technique failure in peritoneal dialysis patients. Int Arch Allergy Immunol. 2020;181(10):765–773. doi: 10.1159/000509085.
- Tariq A, Okamato K, Tariq A, et al. Eosinophilia and risk of incident end stage kidney disease. BMC Nephrol. 2020;21(1):14. doi: 10.1186/s12882-020-1685-3.
- Hildebrand S, Corbett R, Duncan N, et al. Increased prevalence of eosinophilia in a hemodialysis population: longitudinal and case control studies. Hemodial Int. 2016;20(3):414–420. doi: 10.1111/hdi.12395.
- Nakhjavani M, Aghajani Nargesi A, Salabati M, et al. Changes in leukocyte subpopulations with decline in glomerular filtration rate in patients with type 2 diabetes. Acta Med Iran. 2015l;53(7):425–431.
- Ishii R, Fujita S, Kizawa S, et al. Association between absolute blood eosinophil count and CKD stages among cardiac patients. Heart Vessels. 2016;31(2):198–205. doi: 10.1007/s00380-014-0590-8.
- Agarwal R, Light RP. Patterns and prognostic value of total and differential leukocyte count in chronic kidney disease. Clin J Am Soc Nephrol. 2011;6(6):1393–1399. doi: 10.2215/CJN.10521110.
- Diskin CJ, Stokes TJ, Dansby LM, et al. The prevalence and meaning of eosinophilia in renal diseases on a nephrology consultation service. Nephrol Dial Transplant. 2011;26(8):2549–2558. doi: 10.1093/ndt/gfq745.
- Fukui M, Tanaka M, Hamaguchi M, et al. Eosinophil count is positively correlated with albumin excretion rate in men with type 2 diabetes. Clin J Am Soc Nephrol. 2009;4(11):1761–1765. doi: 10.2215/CJN.03330509.
- Colas L, Bui L, Kerleau C, et al. Time-dependent blood eosinophilia count increases the risk of kidney allograft rejection. EBioMedicine. 2021;73:103645. doi: 10.1016/j.ebiom.2021.103645.
- Levey AS, Stevens LA, Schmid CH, et al. A new equation to estimate glomerular filtration rate. Ann Intern Med. 2009;150(9):604–612. doi: 10.7326/0003-4819-150-9-200905050-00006.
- Hartl S, Breyer MK, Burghuber OC, et al. Blood eosinophil count in the general population: typical values and potential confounders. Eur Respir J. 2020;55(5):1901874. doi: 10.1183/13993003.01874-2019.
- Hallan S, de Mutsert R, Carlsen S, et al. Obesity, smoking, and physical inactivity as risk factors for CKD: are men more vulnerable? Am J Kidney Dis. 2006;47(3):396–405. doi: 10.1053/j.ajkd.2005.11.027.
- Zhu L, Su T, Xu M, et al. Eosinophil inversely associates with type 2 diabetes and insulin resistance in Chinese adults. PLOS One. 2013;8(7):e67613. doi: 10.1371/journal.pone.0067613.
- Malinovschi A, Fonseca JA, Jacinto T, et al. Exhaled nitric oxide levels and blood eosinophil counts independently associate with wheeze and asthma events in national health and nutrition examination survey subjects. J Allergy Clin Immunol. 2013;132(4):821–827.e1-5. doi: 10.1016/j.jaci.2013.06.007.
- Liu DW, Zhen XG, Liang Y, et al. Persistent asthma increases the risk of chronic kidney disease: a retrospective cohort study of 2354 patients with asthma. Chin Med J . 2013;126(21):4093–4099. doi: 10.3760/cma.j.issn.0366-6999.20131431.
- Matsumura T, Taketa K, Motoshima H, et al. Association between circulating leukocyte subtype counts and carotid intima-media thickness in japanese subjects with type 2 diabetes. Cardiovasc Diabetol. 2013;12(1):177. doi: 10.1186/1475-2840-12-177.
- Dai DF, Sasaki K, Lin MY, et al. Interstitial eosinophilic aggregates in diabetic nephropathy: allergy or not? Nephrol Dial Transplant. 2015;30(8):1370–1376. doi: 10.1093/ndt/gfv067.
- Raghavan R, Shawar S. Mechanisms of drug-induced interstitial nephritis. Adv Chronic Kidney Dis. 2017;24(2):64–71. doi: 10.1053/j.ackd.2016.11.004.
- Colon S, Luan H, Liu Y, et al. Peroxidasin and eosinophil peroxidase, but not myeloperoxidase, contribute to renal fibrosis in the murine unilateral ureteral obstruction model. Am J Physiol Renal Physiol. 2019;316(2):F360–F371. doi: 10.1152/ajprenal.00291.2018.
- Wu WY, Zhou XJ, Sun PP, et al. Interstitial eosinophilic infiltration in diabetic nephropathy is indicative of poor prognosis, with no therapy benefit from steroid. J Diabetes. 2020;12(12):881–894. doi: 10.1111/1753-0407.13077.
- Pang L, Ding Z, Chai H, et al. The causal relationship between immune cells and different kidney diseases: a mendelian randomization study. Open Med. 2023;18(1):20230877. doi: 10.1515/med-2023-0877.
- Wheelock KM, Saulnier PJ, Tanamas SK, et al. White blood cell fractions correlate with lesions of diabetic kidney disease and predict loss of kidney function in type 2 diabetes. Nephrol Dial Transplant. 2018;33(6):1001–1009. doi: 10.1093/ndt/gfx231.
- Whaley-Connell AT, Sowers JR, Stevens LA, et al. CKD in the United States: kidney early evaluation program (KEEP) and national health and nutrition examination survey (NHANES) 1999-2004. Am J Kidney Dis. 2008;51(4 Suppl 2):S13–S20. doi: 10.1053/j.ajkd.2007.12.016.