
Abstract
To investigate the potential clinical value of urinary exosomal (uE) miR-451a as a biomarker for IgAN, urinary exosomes were isolated from 40 patients with IgAN, 30 patients with primary renal diseases without IgA as disease controls (non-IgAN group) and 21 healthy controls (HCs). The expression of miR-451a within exosomes was examined by reverse transcription-quantitative polymerase chain reaction (RT-qPCR). uE miR-451a was significantly upregulated in patients with IgAN compared to non-IgAN and HCs. The uE miR-451a level was positively correlated with the change in eGFR and negatively correlated with serum creatinine, urinary macrophage migration inhibitory factor (MIF), interleukin-6 (IL-6) and tumor necrosis factor (TNF-α). A dual-luciferase reporter assay confirmed that MIF was a direct target of miR-451a. Receiver operating characteristic (ROC) curve analysis revealed that the expression of uE miR-451a showed potential diagnostic value for IgAN. Additionally, the uE miR-451a level could distinguish patients with IgAN with mild tubular atrophy/interstitial fibrosis from those with severe tubular atrophy/interstitial fibrosis. After a mean follow-up of 14.2 months, the levels of eGFR loss (ml/min/1.73 m2/year) were negatively correlated with baseline miR-451a. The levels of baseline miR-451a in the complete remission group were significantly higher than those in the non-complete remission group. uE miR-451a expression was significantly elevated in patients with IgA nephropathy and may serve as a potential biomarker for the diagnosis of IgAN and evaluation of tubulointerstitial damage, while the baseline levels of uE miR-451a may be predictors of therapeutic efficacy and disease progression.
1. Introduction
Immunoglobulin A nephropathy (IgAN) is the most common primary glomerulonephritis worldwide. Reportedly, 20%–40% of individuals with IgAN develop the progressive form of the disease, eventually requiring renal replacement therapy [Citation1]. However, the pathophysiologic mechanisms that govern the progression of IgAN are incompletely understood, and there remain limited noninvasive methods to diagnose and establish the prognosis of IgAN [Citation2].
In the past few decades, urine has served as a cost-effective and noninvasive diagnostic tool for monitoring kidney damage. However, existing methods for kidney disease diagnosis, including urine proteinuria and estimated glomerular filtration rate (eGFR), have limited sensitivity and specificity, and cannot be used for the early detection of kidney diseases. Recent research has shown that patients traditionally regarded as being ‘low-risk’, with proteinuria levels < 0.88 g/day, have high rates of kidney failure within 10 years [Citation3]. Furthermore, the lower threshold for biopsy is still debated. Therefore, it is important to discover novel prognostic biomarkers that could guide therapy [Citation4].
Exosomes, small membrane-bound lipid vesicles with a diameter of 30–200 nm, are found in nearly all biological fluids, including urine. Urinary exosomes contain proteins, mRNAs and miRNAs, which are secreted by cells from all nephron segments and provide an accurate representation of renal dysfunction and structural injury. Additionally, the potential of using urinary exosomes as biomarkers has been increasingly recognized, with several studies suggesting that urinary exosome miRNAs play an important role in the progression of nephropathy, such as focal segmental glomerular sclerosis, diabetic nephropathy and lupus erythematosus [Citation5,Citation6]. However, despite recent advancements, there is a lack of specific miRNAs that can reliably serve as diagnostic markers for IgAN.
Several small discovery studies have reported miRNA expression in IgAN. The first research on miRNAs in IgAN described the relationship between the urinary sediment miR-200 family, miR-205, miR-192 and the severity of kidney injury in IgAN [Citation7]. MiR-451 was first identified and reported by Altuvia in the human pituitary gland more than a decade ago [Citation8]. It has since been identified in several tissue types where it participates in multiple physiological and pathological processes. It has been reported that miR-451a delineates the proliferation activity of mesangial cells in rat models. Moreover, previous studies have shown miRNA-451 expression abnormalities in patients with chronic kidney disease (CKD). Indeed, Sayilar found significantly low urinary but higher plasma miR-451 levels in patients with CKD compared to healthy volunteers [Citation9]. Moreover, Manju Kumari reported that subjects with CKD without diabetes had significantly higher urinary miR-451 expression than those with diabetes [Citation10].
Previously, we reported that urinary exosome miR-451a was upregulated in patients with IgAN, as determined by high-throughput sequencing and RT-qPCR [Citation11]; however, whether urinary exosome miR-451a is specific to IgAN remains unknown. In this study, we assessed the differential expression of urinary exosome miR-451a in patients with IgAN compared to non-IgAN patients with primary renal diseases and healthy controls (HCs), with the aim to explore the roles of urinary exosome miR-451a in diagnosing IgA nephropathy and predicting disease progression.
2. Patients and methods
2.1. Patients and general data
This study was conducted between October 2021 and February 2023 at the Department of Nephrology at the Shanxi Provincial People’s Hospital (Taiyuan, China). Patients who were diagnosed with IgAN by biopsy and were aged ≥ 18 years were enrolled, while patients without IgAN with primary renal diseases who underwent kidney biopsy at the same time were included as the disease control group (non-IgAN patients). The exclusion criteria were as follows: patients with secondary IgA nephropathy; those who had received corticosteroids or immunosuppressants before the beginning of this study; those with malignancy, lupus, or severe hepatic disease; those who underwent kidney implantation therapy, including kidney transplantation or dialysis; and those with acute or chronic infection. We also excluded patients with fewer than eight glomeruli in light microscopy sections, and those with inadequate laboratory data records. Healthy volunteers were recruited at the Physical Examination Center of the same hospital. All patients had normal renal function, normal urinalysis results, and no personal or family history of nephropathy or other serious illness.
Finally, 40 patients with IgAN, 30 non-IgAN patients (including 19 cases of membranous nephropathy, 10 cases of minimal change disease, and one case of focal segmental glomurular sclerosis), and 21 healthy volunteers (as healthy controls; HCs) were enrolled in this study. We reviewed the patients’ demographic, clinical, and pathological information. Urine and serum specimens, and clinical data, were collected at the time of admission for renal biopsy. The clinical parameters reviewed included 24-h urinary protein excretion (UPE), serum creatinine (Scr), and eGFR, calculated using the Chronic Kidney Disease Epidemiology Collaboration (CKD–EPI) equations, as estimated by a standard equation at the time of kidney biopsy [Citation12]. After renal biopsy, the patients were treated with corticosteroids or angiotensin-converting enzyme inhibitors (ACEIs)/angiotensin receptor blockers (ARBs), according to the KDIGO guidelines [Citation13], and followed up for at least 12 months. Complete remission (CR) was defined as the absence of proteinuria (proteinuria < 0.3 g/24 h) along with a lack of worsening of renal function. Partial remission (PR) was defined as a ≥ 50% reduction in proteinuria from baseline. No response (NR) was defined as a < 50% reduction in proteinuria. All subjects signed informed consent forms and were approved by the Ethics Committee of Shanxi Provincial People’s Hospital.
2.2. Evaluation of renal pathological lesions
Renal tissues obtained by biopsy were fixed with formalin. After dehydration, transparentizing, waxing, embedding, paraffin sectioning (at a thickness of 3 um), and bake the slides at 60 degrees for 12–24 hours, they were stained with hematoxylin and eosin (H&E), periodic acid Schiff (PAS), periodic acid silver methenamine (PASM), and Masson’s trichrome for light microscopy. For immunofluorescence: 2 mm of fresh renal tissue obtained after renal puncture was added to a small amount of OCT embedding agent and frozen in a freezer kept at a constant temperature to prepare sections (with a thickness of 4 um). FITC-conjugated rabbit anti-human IgG, IgA, IgM, C3, and C1q (Zhongshan Jinqiao Biotech, Beijing, China) diluted at a ratio of 1:30 were added dropwise, and then the sections were incubated at 37 °C for 30 min, washed with PBS for 2 min three times, and sealed with a water-soluble sealing agent. The stained sections were then observed and interpreted under a fluorescence microscope. The renal pathology interpretation work in this section was carried out by two experienced professional renal pathology experts from Shanxi Provincial People’s Hospital who were blinded to the patients’ data and who evaluated the renal biopsy slides separately. For patients with IgAN, the severity of the renal pathological lesions was evaluated according to the Oxford classification [Citation14]. Four variables of the Oxford classification were further evaluated, including mesangial proliferation (M1 - more than half the glomeruli have more than three cells in a mesangial area, M0 - did not meet the criteria of M1), endocapillary hypercellularity (E1 - present, E0 - absent), segmental glomerulosclerosis (S1 - present, S0 - absent), tubular atrophy/interstitial fibrosis (T0: 0%–25%, T1: 26%–50%, T2: ≥ 50%), and crescents (C0: no crescents, C1: crescents in < 25% of glomeruli, C2: crescents in > 25% of glomeruli).
2.3. Sample collection and processing
The whole-stream early morning urine specimens collected from patients and controls were processed within 4 h after collection at 4 °C. Urine samples were centrifuged at 3000 × g for 15 min within 2 h of collection. The precipitate was discarded, and the supernatant was collected in a new sterile centrifuge tube and stored at −80 °C for later use.
2.4. Urinary exosome isolation
The isolated urinary exosome was collected using ultracentrifugation method. The urine supernatant was centrifuged at 2500 × g for 30 min at 4 °C. Then, the supernatant was collected for secondary centrifugation at 10,000 × g for 30 min at 4 °C. The supernatant was then again collected and transferred to a high-speed centrifuge for 70 min at 4 °C, 200,000 × g. The supernatant was then removed, after which the precipitate was resuspended in 10 mL PBS, using a 0.22-μm membrane for filtration (Merck KGaA, Darmstadt, Germany) and centrifuged again for 70 min (4 °C, 200,000 × g). The supernatant was then again removed, and the precipitate was resuspended in 100 μL PBS; this was the purified exosome sample, which was then collected and stored at −80 °C. We identified exosomes by measuring exosome markers CD9 and CD63 using a western blot and observing the exosome morphology under electron microscopy following the method of our preliminary work [Citation11].
2.5. RNA extraction
The miRcute miRNA Isolation Kit (Tiangen Biotech, DP501, Beijing, China) was used to separate extracellular miRNAs following the manufacturer’s guidelines. The RNA concentration (ng/ml) and purity (A260/A280) were detected using the NanoDrop One spectrophotometer (Thermo Fisher Scientific, Waltham, MA, USA).
2.6. RT-qPCR analysis
RT-qPCR was performed using a miRcute Plus miRNA First-Strand cDNA Kit (Tiangen Biotech, KR211, Beijing, China) according to the manufacturer’s instructions. RT-qPCR was performed on an RT-PCR instrument using a miRcute Plus miRNA qPCR Kit (SYBR Green) Kit (Tiangen Biotech, FP411, Beijing, China) according to the manufacturer’s protocol. The relative miRNA-451a (i.e., the primer sequence 5′-GCCAAACCGTTACTGAGTT-3′) (Sangon Biotech, Shanghai, China) expression was calculated using the 2 − ΔΔCT method, with the threshold cycle values normalized against U6 (Sangon Biotech, B532451, Shanghai, China).
2.7. Macrophage migration inhibitory factor (MIF) and cytokine detection by enzyme-linked immunosorbent assay (ELISA)
We used sandwich ELISA (Biosource® Europe S.A., Nivelles, Belgium) kits for measuring the urine levels of MIF, IL-6, and TNF-α, according to the manufacturer’s specifications.
2.8. Dual luciferase reporter assay for the identification of MIF as a functional target of miR-451a
The mRNA of MIF 3′- UTR containing wild-type (AACGGUU) or mutant miR-451a (GGUTAACC) (Gene Pharma, Shanghai, China) binding sites was cloned into the pmirGLO vector (Writegene Biotech, Zhengzhou, China). HEK-293T cells (CCTCC, Wuhan, China) were co-transfected with the luciferase reporter plasmid and miR-451a mimic or negative control (mimic NC) using Lipofectamine 2000 (Invitrogen). After 48 h, the luciferase activity was determined using a Dual-Glo Luciferase Reporter Assay System (Promega) according to the manufacturer’s instructions. The firefly luciferase activity of each sample was normalized to the Renilla luciferase activity.
2.9. Statistical analysis
Statistical analysis was performed using SPSS for Windows software, version 24.0 (IBM Corp, Armonk, NY, USA). Continuous data are expressed as the mean ± SD, and were compared using t-test or one-way ANOVA. Data with a skewed distribution are presented as median and interquartile range (IQR), as appropriate. The nonparametric Mann–Whitney test or Kruskal–Wallis rank (three groups) test was used to test non-normally distributed data. Categorical data are expressed as percentages and were compared using the chi-squared test, and the relationships between variables were analyzed by Spearman rank (R) correlation coefficients. We constructed ROC curves and calculated the area under the ROC curve (AUC) to investigate the value of miRNAs for predicting IgAN and evaluating histological injury. p-values < 0.05 were considered statistically significant. All probabilities were two-tailed.
3. Results
3.1. Demographic and baseline data of IgAN, non-IgAN, and healthy control (HC) groups
Forty patients with IgAN were enrolled in our study, among whom 22 were males and 18 were females. The age of the patients at renal biopsy was 41.2 ± 12.3 years old. Thirty-seven were treated with renin angiotensin system (RAS) blockade alone and 25 were treated with steroids and/or immunosuppressants. The baseline characteristics of patients with IgAN, non-IgAN patients, and HCs are listed in . The three groups showed no significant differences in sex and age. Additionally, there were no significant differences in Scr and eGFR between patients with IgAN and non-IgAN patients.
Table 1. Baseline characteristics of the patients with and without IgAN, and healthy controls (HCs).
3.2. Levels of uE miR-451a in patients with and without IgAN, and HCs
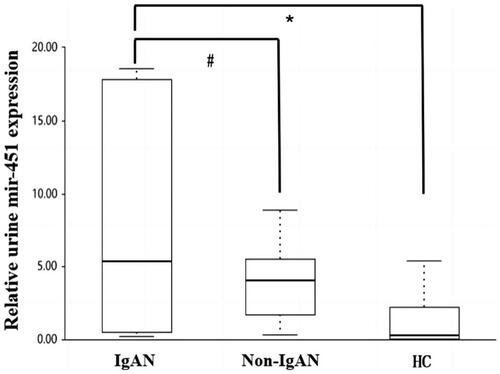
As shown in , the urinary exosomal (uE) expression of miR-451a was significantly higher in the IgAN group (5.38 [0.502–17.8]) compared to the non-IgAN (4.04 [1.677–5.515], p = 0.013) and HC groups (0.26 [0.0–2.2], p = 0.011), although there were no significant differences between the non-IgAN and HC groups (p = 0.325).
Figure 1. Comparison of uE miR-451a levels among the IgAN, non-IgAN, and HC groups. *Significant difference between patients with IgAN and HCs (p = 0.011); #significant difference between patients with non-IgAN and HCs (p = 0.0013).
3.3. Association between uE miR-451a and clinical and pathological parameters in patients with IgAN
As shown in , the levels of uE miR-451a were positively correlated with eGFR (r = 0.485, p = 0.0012) and negatively correlated with Scr (r = −0.389, p = 0.04), urinary MIF (r = −0.693, p < 0.001), IL-6 (r = −0.768, p < 0.001), and TNF-α (r = −0.663, p < 0.001).
Table 2. Correlations between uE miR-451a and clinical parameters and urinary MIF, TNF-α, and IL-6.
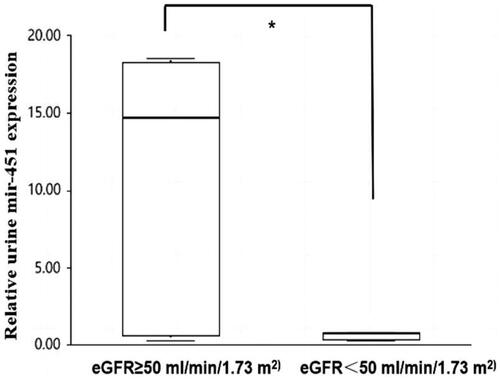
However, there was no significant correlation between miR-451a expression and 24-h urinary protein excretion (UTP) (r = 0.014, p = 0.944). The patients with IgAN were divided into two groups according to the eGFR, namely < 50 mL/min/1.73 m2 and ≥ 50 mL/min/1.73 m2 (9 vs. 31 cases). The relative levels of uE miR-451a noticeably decreased in the eGFR < 50 mL/min/1.73 m2 group compared to the eGFR ≥ 50 mL/min/1.73 m2 group (14.680 [0.5, 18.3] vs. 0.720 [0.3, 0.7], p = 0.007; ].
Figure 2. Comparison of uE miR-451 levels between the two subgroups according to the eGFR < 50 mL/min/1.73 m2 and ≥ 50 mL/min/1.73 m2 in patients with IgAN (9 vs 31 cases). *Significant difference between patients with the two subgroups according to the eGFR < 50 mL/min/1.73 m2 and ≥ 50 mL/min/1.73 m2 in patients with IgAN (p = 0.007).
3.4. Identification of MIF as a functional target of miR-451a
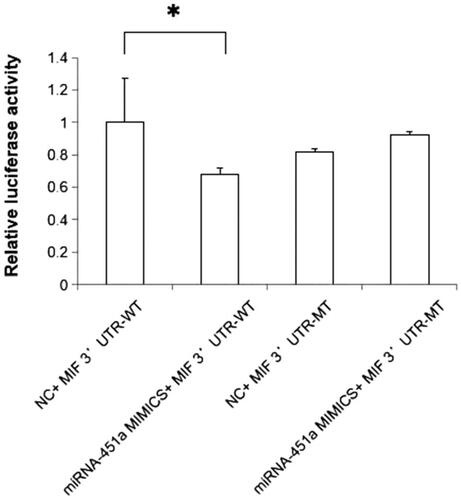
We performed a dual-luciferase reporter assay to determine whether MIF was a direct target of miR-451a. Wild-type and mutant 3′-UTR luciferase reporter constructs of MIF were generated, and these vectors were co-transfected into HEK-293T cells with miR-451a mimic or mimic NC, respectively. The results showed that miR-451a mimic transfection could inhibit wild-type MIF 3'UTR (p = 0.03, ).
Figure 3. Hsa-miR-451a mimic transfection can inhibit wild-type MIF 3′UTR (p = 0.03).
3.5. Correlations between uE miR-451a and histopathological parameters according to the Oxford classification in patients with IgAN
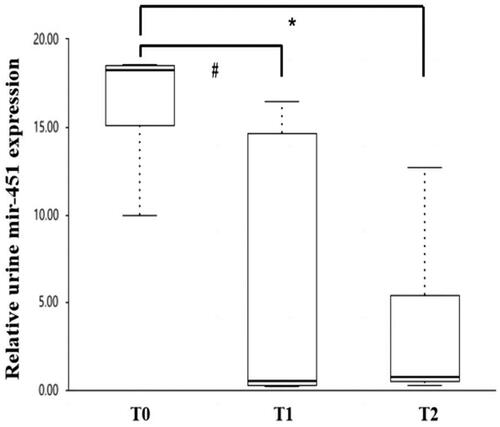
For mesangial proliferation, endocapillary hypercellularity, segmental glomerulosclerosis, and crescents, the levels of urinary miR-451a showed no significant difference between patients with M1 and M0 (10.0 [0.5–16.4] vs. 5.355 [0.3–18.3], p = 0.086), E1 and E0 (14.62 [0.4–17.5] vs. 5.53 [0.5–18.2], p = 0.935), S1 and S0 (5.350 [0.4, 16.5] vs. 16.440 [0.7, 18.3], p = 0.126), C1 and C0 (0.73 [0.5–15.1] vs. 10.005 [0.3–18.3], p = 0.365). The levels of urinary miR-451a were significantly lower in patients with a score of T1 (0.725 [0.3–16.4]) and T2 (0.720 [0.5–5.4]) than those with a score of T0 (18.240 [5.3,18.5], p = 0.011, p = 0.026, respectively) ().
Figure 4. Relationship between uEsmir-451a levels and different scores of tubular atrophy/interstitial fibrosis in IgA nephropathy according to the Oxford classification. #Significant difference between patients with T1 and T0 (p = 0.011). *Significant difference between patients with T2 and T0 (p = 0.026).
3.6. Prediction values of uE miR-451a in patients with IgAN
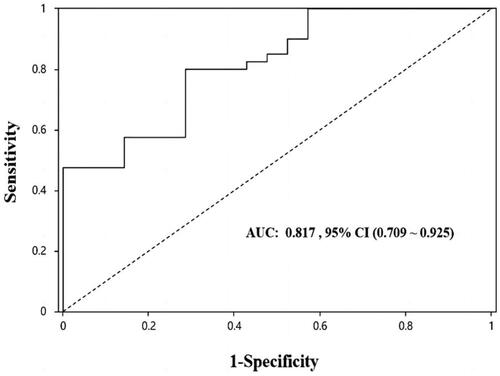
As shown in , ROC analysis revealed that uE levels of miR-451a were able to significantly discriminate between IgAN and HC (AUC: 0.817, p < 0.001), the best ‘cutoff’ expression level was > 0.43, giving a sensitivity of 0.8 and specificity of 0.714.
Figure 5. ROC analysis of uE miR-451a for the diagnosis of IgAN. AUC: Area under the curve; 95% CI: 95% confidence interval.
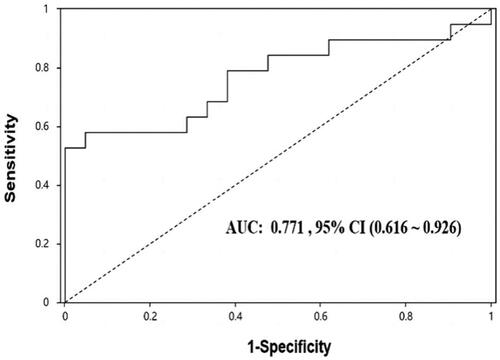
As shown in , the uE levels of miRNA-451a were able to significantly discriminate between T0 and T1 + T2. (AUC: 0.783, p = 0.002). The best ‘cutoff’ expression level for predicting renal tubulointerstitial injury was 16.44, giving a sensitivity of 0.571 and specificity of 0.947.
Figure 6. ROC curve of discriminating patients with IgAN with tubular atrophy/interstitial fibrosis T0 from patients with T1 + T2. AUC: Area under the curve; 95% CI: 95% confidence interval.
3.7. Correlation between uE miR-451a expression and clinical remission
Of the 40 patients with IgAN, the mean time of follow-up was 14.2 months (10.1–16.5 months). Additionally, there were no correlations between the rate of reduction of UPE (g/24 h/year) and levels of baseline uE miRNAa-451.eGFR loss (ml/min/1.73 m2/year) were negatively correlated with baseline miR-451a (r = −0.325, p = 0.039). We divided the 40 patients into CR and non-CR groups after follow-up. The results are summarized in . The levels of baseline uE miR-451a in the CR group were significantly higher than the those in the non-CR group (p = 0.018). Patients who achieved CR of proteinuria also had more severe tubular atrophy/interstitial fibrosis (p = 0.014).
Table 3. Comparison of baseline clinical parameters and uE miR-451a levels between the CR and non-CR groups.
4. Discussion
Currently, the existing methods and markers for IgAN diagnosis and progress risk assessment are limited [Citation1]. Recent studies have found that miRNAs can be secreted by cells into body fluids and that the circulating miRNAs are highly stable. However, the results have been debated, with discrepancies attributed to the different technologies or materials used in these studies. Furthermore, the results may also be influenced by the detection of urinary miRNA expression in urine sediments (which consist of various cell types, including red blood cells, lymphocytes, and renal tubular cells) without determining their cellular source [Citation15]. uE are produced by the kidney and pass through almost all kidney cell types. Additionally, uE contain miRNAs, which can be remarkably stable and easily obtained, providing readily available sources in the clinical setting for diagnosis and monitoring, serving as biomarkers for kidney diseases [Citation16].
In our previous study, using deep sequencing of uE, we identified higher miR-451a levels in urinary exosomes in patients with IgAN [Citation12]. However, these studies lacked disease controls to prove whether the differently expressed miRNAs were disease-specific for IgAN. In theory, any aberrant miRNA expression observed in patients with IgAN could be either disease-specific or present in all patients with CKD. In this study, to confirm whether this exosomal miRNA is related to IgAN, we determined the relative levels of miRNA-451a in the uE of patients with IgAN and HCs, as well as in other primary nephropathies as a disease control. The data indicated that patients with IgAN had greater expression of miR-451a in uE than non-IgAN and HCs. Additionally, the levels of uE miR-451a were positively correlated with eGFR and negatively correlated with Scr, indicating a possible correlation between the levels of the uE miR-451a and the severity of IgAN. At the same time, according to the eGFR ≥ 50 mL/min/1.73 m2 and < 50 mL/min/1.73 m2 in patients with IgAN, the level of miR451a in uE significantly declined with decreased renal function; however, there was no significant correlation between miR-451a expression and proteinuria severity. We analyzed the ability of uE miR-451a as a biomarker to distinguish between IgAN and HC groups. As shown in , the urinary levels of miRNA-451a were able to significantly discriminate between IgAN and HC groups.
The factors of IgAN progression are unclear. The Oxford classification encompasses five histopathological features (M, E, S, T, and C scores), which are independently associated with a higher risk of future kidney function decline. It has recently been reported that even if the urinary protein, which mainly reflects the degree of glomerular injury degree, is well controlled (< 1 g), IgAN still progresses [Citation3]. Moreover, there is increasing evidence that tubulointerstitium injury plays an important role in the progression of IgAN. Our study showed that the levels of uE miR-451a were significantly lower in patients with scores of T1 and T2 than those with T0. ROC revealed that miR-451a can distinguish patients with mild tubular atrophy/interstitial fibrosis from those with severe tubular atrophy/interstitial fibrosis, which are markers of renal chronic lesions. It has been reported that there is an increase in miR-451 expression in the exosomes secreted by human proximal tubular cells in response to injury [Citation10]. Similarly, a study conducted on kidney tissue reported higher expression of miR-451 in the renal cortex of hypertensive patients compared to that in normotensive subjects [Citation17]. Therefore, we examined uE samples instead of whole urine. Molecules in the urinary exosomal membrane are thought to be protected from the toxic urine environment and may reflect true levels. Additionally, biomolecules in urinary exosomes may represent the pathophysiological state of the originating renal cells.
The multiple-hit theory of IgAN has been widely accepted in the academic circle. It is now established that many proinflammatory cytokines such as TNF-α, IL-6, and chemokines, are highly produced by glomerular cells and contribute to glomerular inflammation [Citation18]. We previously employed bioinformatics analysis to identify and validate MIF as a target of miR-451a [Citation12].
MIF is a cytokine that shares many activities with other proinflammatory cytokines and activates macrophages by promoting the synthesis of cytokines such as TNF-α, Interleukin-1β (IL-1β), and IL-6 [Citation19,Citation20]. MIF, in combination with these cytokines, plays a pivotal role in mediating renal injury. Moreover, it has been reported that MIF plays a role as the initial or exacerbation mediator of IgAN or in the progression of IgAN [Citation21]. Urine MIF (uMIF) levels increase in patients with IgAN, reflecting the clinicopathological activity of the disease. High levels of uMIF reflect macrophage activation, which is considered to be involved in the development of glomerular injury in IgA nephropathy [Citation22]. Given the importance of the renal immune response and inflammatory reaction in the pathophysiology of IgAN, we also investigated the correlations of uE miR-451a with MIF and proinflammatory cytokines (IL-6 and TNF-α) in the urine sediment. Our results revealed that uE levels of miR-451a negatively correlated with urinary expression of MIF, IL-6, and TNF-α. Our preliminary research found that MIF is one of target genes predicted by Targetscan for hsa-miRNA-451a [Citation11]. We also performed a dual-luciferase reporter assay to verify whether MIF was a direct target of miR-451a. Our results showed that transfection with a miR-451a mimic inhibited wild-type MIF 3′ UTR. We speculate that the upregulation of uE miRNA-451a downregulated the secretion of MIF, which further decreased the overproduction of the proinflammatory cytokines IL-6 and TNF-α, and contributed to the occurrence and progression of IgAN.
RiCong Xu et al. recently investigated the relationship between Oxford Classification scores and longitudinal changes in proteinuria in patients with IgAN. As a result, they demonstrated that T1/2 was independently associated with a longitudinal increase in proteinuria in patients with IgAN [Citation23]. In this study, we regarded complete remission of proteinuria as the main clinical outcome. Our results showed that patients who achieved complete remission of proteinuria also had mild tubular atrophy/interstitial fibrosis (p = 0.014). The levels of baseline miR-451a in the complete remission group were significantly higher than those in the noncomplete remission group after a mean 14.2 months of follow-up. The levels of eGFR loss (ml/min/1.73 m2/year) were negatively correlated with baseline miR-451a. The expression of uE miR-451a may reflect the degree of renal injury and may be used as a marker for non-renal biopsy to judge renal tubulointerstitial injury and predict the progression of IgAN. Furthermore, uE miR-451a seems to have a protective effect on tubular injury in the early stage of IgAN.
This study has some limitations that warrant discussion. First, the sample size was relatively small and all patients were Chinese. Additionally, we did not investigate IgAN and disease control with different severity levels. These results should be validated in large multicenter cohorts with subgroup controls. Second, the reason for the change in uE miR-451 levels remains inclusive, but may be caused by organ secretion or disease. It is necessary to further study the expression level of miR-451 in specific renal cell types. Third, to confirm the effect of the miR-451a level on the prognosis of IgAN, it would be better to extend the follow-up time.
In conclusion, uE miR-451a expression significantly increases in patients with IgAN. uE miRNA-451 was negatively related to the increased severity of tubular interstitial damage, and it decreased with impaired renal function. We assessed the prognostic effect of uE miR-451a on the remission of proteinuria and decline of eGFR after a mean 14.2 months of follow-up. Further research is needed to confirm whether the level of uE miR-451a measured during renal biopsy can potentially predict the prognosis of IgAN patients. Our results suggest that urinary exosomal miR-451a could be a noninvasive candidate biomarker for the diagnosis and evaluation of the severity IgAN.
Authors’ contributions
Conception and design of the work: QZ; Data collection: QZ, YZ, HZH, XLH, YKL, and YZ; Supervision: QZ; Analysis and interpretation of the data: QZ, YZ, HZH, XLH, and YKL; Statistical analysis: QZ and YZ; Drafting the manuscript: QZ; Critical revision of the manuscript: all authors. All authors contributed to the article and approved the submitted version.
Consent to publish
The manuscript has been read and approved for submission by all (co-)authors.
Ethical approval
This study was conducted in accordance with the ethical principles stated in the Declaration of Helsinki and was approved by the ethics committee of Shanxi Provincial People’s Hospital (reference numbers: (2021) Shanxi Medical Ethics Review No. 32). The patients/participants provided their written informed consent to participate in this study.
Patient consent
All participants provided their written informed consent to participate in this study.
Date availability statement
The original contributions presented in this study are included in the article material. Further inquiries may be directed to the corresponding author.
Acknowledgments
We thank LetPub (www.letpub.com) for its linguistic assistance during the preparation of this manuscript.
Disclosure statement
No potential conflict of interest was reported by the author(s).
Additional information
Funding
References
- Pattrapornpisut P, Avila-Casado C, Reich HN. IgA nephropathy: core curriculum 2021. Am J Kidney Dis. 2021;78(3):1–8. doi: 10.1053/j.ajkd.2021.01.024.
- Rajasekaran A, Julian BA, Rizk DV. IgA nephropathy: an interesting autoimmune kidney disease. Am J Med Sci. 2021;361(2):176–194. doi: 10.1016/j.amjms.2020.10.003.
- Pitcher D, Braddon F, Hendry B, et al. Long-term outcomes in IgA nephropathy. Clin J Am Soc Nephrol. 2023;18(6):727–738. doi: 10.2215/CJN.0000000000000135.
- Selvaskandan H, Shi S, Twaij S, et al. Monitoring immune responses in IgA nephropathy: biomarkers to guide management. Front Immunol. 2020;11:572754. doi: 10.3389/fimmu.2020.572754.
- Schena FP, Sallustio F, Serino G. MicroRNAs in glomerular diseases from pathophysiology to potential treatment target. Clin Sci. 2015;128(11):775–788. doi: 10.1042/CS20140733.
- Nalewajska M, Gurazda K, Styczyńska-Kowalska E, et al. The role of MicroRNAs in selected forms of glomerulonephritis. Int J Mol Sci. 2019;20(20):5050. doi: 10.3390/ijms20205050.
- Wang G, Kwan BC-H, Lai FM-M, et al. Expression of microRNAs in the urinary sediment of patients with IgA nephropathy. Dis Markers. 2010;28(2):79–86. doi: 10.3233/DMA-2010-0687.
- Altuvia Y, Landgraf P, Lithwick G, et al. Clustering and conservation patterns of human microRNAs. Nucleic Acids Res. 2005;33(8):2697–2706. doi: 10.1093/nar/gki567.
- Sayilar EI. Biomarker potential of urine miR-451 at different stages of diabetic nephropathy. J Diabetes Metab. 2016;07(02):100650. doi: 10.4172/2155-6156.1000650.
- Kumari M, Mohan A, Ecelbarger CM, et al. MiR-451 loaded exosomes are released by the renal cells in response to injury and associated with reduced kidney function in human. Front Physiol. 2020;11:234. doi: 10.3389/fphys.2020.00234.
- Li SY, Hao HQ, Li RS, et al. Urinary exosomal MicroRNAs as new noninvasive biomarkers of IgA nephropathy. Tohoku J Exp Med. 2022;256(3):215–223. doi: 10.1620/tjem.256.215.
- Levey AS, Stevens LA, Schmid CH, et al. A new equation to estimate glomerular filtration rate. Ann Intern Med. 2009;150(9):604–612. doi: 10.7326/0003-4819-150-9-200905050-00006.
- Kidney Disease: improving Global Outcomes (KDIGO) Glomerular Diseases Work Group. KDIGO 2021 clinical practice guideline for the management of glomerular diseases. Kidney Int. 2021;100(4S):S1–S276. doi: 10.1016/j.kint.2021.05.021.
- Trimarchi H, Barratt J, Cattran DC, et al. Oxford classification of IgA nephropathy 2016: an update from the IgA nephropathy classification working group. Kidney Int. 2017;91(5):1014–1021. doi: 10.1016/j.kint.2017.02.003.
- Alvarez ML, Khosroheidari M, Kanchi Ravi R, et al. Comparison of protein, microRNA, and mRNA yields using different methods of urinary exosome isolation for the discovery of kidney disease biomarkers. Kidney Int. 2012;82(9):1024–1032. doi: 10.1038/ki.2012.256.
- Delrue C, De Bruyne S, Speeckaert R, et al. Urinary extracellular vesicles in chronic kidney disease: from bench to bedside? Diagnostics. 2023;13(3):443. doi: 10.3390/diagnostics13030443.
- Marques FZ, Campain AE, Tomaszewski M, et al. Gene expression profiling reveals renin mRNA overexpression in human hypertensive kidneys and a role for microRNAs. Hypertension. 2011;58(6):1093–1098. doi: 10.1161/HYPERTENSIONAHA.111.180729.
- Groza Y, Jemelkova J, Kafkova LR, et al. IL-6 and its role in IgA nephropathy development. Cytokine Growth Factor Rev. 2022;66:1–14. doi: 10.1016/j.cytogfr.2022.04.001.
- Sumaiya K, Langford D, Natarajaseenivasan K, et al. Macrophage migration inhibitory factor (MIF): a multifaceted cytokine regulated by genetic and physiological strategies. Pharmacol Ther. 2022;233:108024. doi: 10.1016/j.pharmthera.2021.108024.
- Kong Y-Z, Chen Q, Lan H-Y. Macrophage migration inhibitory factor (MIF) as a stress molecule in renal inflammation. Int J Mol Sci. 2022;23(9):4908. doi: 10.3390/ijms23094908.
- Taniguchi Y, Yorioka N, Yamashita K, et al. Macrophage migration inhibitory factor in IgA nephropathy. Kidney Int. 1998;54(6):2245–2246. doi: 10.1038/4499993.
- Matsumoto K, Kanmatsuse K. Urinary levels of macrophage migration inhibitory factor in patients with IgA nephropathy. Nephron. 2002;92(2):309–315. doi: 10.1159/000063297.
- Xu R-C, Guo J-Y, Cao T, et al. A mixed-method evaluation of the relationship between oxford classification scores and longitudinal changes in proteinuria in patients with immunoglobulin a nephropathy. Front Endocrinol. 2022;13:890900. doi: 10.3389/fendo.2022.890900.