
Abstract
Objective
Intradialytic hypotension (IDH) is a common and serious complication in patients with Maintenance Hemodialysis (MHD). The purpose of this study is to externally verify three IDH risk prediction models recently developed by Ma et al. and recalibrate, update and present the optimal model to improve the accuracy and applicability of the model in clinical environment.
Methods
A multicenter prospective cohort study of patients from 11 hemodialysis centers in Sichuan Province, China, was conducted using convenience sampling from March 2022 to July 2022, with a follow-up period of 1 month. Model performance was assessed by: (1) Discrimination: Evaluated through the computation of the Area Under Curve (AUC) and its corresponding 95% confidence intervals. (2) Calibration: scrutinized through visual inspection of the calibration plot and utilization of the Brier score. (3) The incremental value of risk prediction and the utility of updating the model were gauged using NRI (Net Reclassification Improvement) and IDI (Integrated Discrimination Improvement). Decision Curve Analysis (DCA) was employed to evaluate the clinical benefit of updating the model.
Results
The final cohort comprised 2235 individuals undergoing maintenance hemodialysis, exhibiting a 14.6% occurrence rate of IDH. The externally validated Area Under the Curve (AUC) values for the three original prediction models were 0.746 (95% CI: 0.718 to 0.775), 0.709 (95% CI: 0.679 to 0.739), and 0.735 (95% CI: 0.706 to 0.764) respectively. Conversely, the AUC value for the recalibrated and updated columnar plot model reached 0.817 (95% CI: 0.791 to 0.842), accompanied by a Brier score of 0.081. Furthermore, Decision Curve Analysis (DCA) exhibited a net benefit within the threshold probability range of 15.2% to 87.1%.
Conclusion
Externally validated, recalibrated, updated, and presented IDH prediction models may serve as a valuable instrument for evaluating IDH risk in clinical practice. Furthermore, they hold the potential to guide clinical providers in discerning individuals at risk and facilitating judicious clinical intervention decisions.
Introduction
Maintenance hemodialysis (MHD) is currently the predominant form of renal replacement therapy for patients with end-stage renal disease (ESRD), accounting for nearly 90% of all cases [Citation1]. Hemodialysis for maintenance purposes can only partially substitute the renal excretory function, proving insufficient in fully supplanting the metabolic and endocrine functionalities inherent to the kidneys. Inevitably, pathophysiological alterations stemming from the patient’s underlying ailment, coupled with injuries incurred during the hemodialytic procedure, persist. Consequently, the patient remains susceptible to a spectrum of interconnected acute and chronic complications. In this context, IDH is emerging as a common acute complication in MHD patients, with a prevalence reported in the literature ranging from 8% to 40% [Citation2,Citation3]. IDH can cause dizziness, nausea, vomiting and muscle spasms in patients with MHD and complicates up to one third of outpatient treatments [Citation4], leading to shortening or interruption of the patient’s treatment process and seriously affecting the treatment effect in patients with MHD [Citation5]. In addition, IDH can also lead to arteriovenous fistula and vascular access thrombosis in arteriovenous transplantation, which can cause cardiovascular complications and visceral organ damage, accelerate the loss of residual renal function and increase the risk of death [Citation6–8].
The characterization of IDH presently lacks uniformity both domestically and internationally, with no evidence-based consensus having been established. The European Best Practice Guidelines (EBPG) delineate IDH as a reduction in systolic blood pressure by ≥20 mmHg or a decrease in mean arterial pressure by ≥10 mmHg during dialysis, concomitant with clinical events necessitating intervention. However, recent investigations reveal that the most pronounced association between IDH and mortality risk emerges when patients are categorized with a minimal systolic blood pressure of <90 mmHg or <100 mmHg during dialysis [Citation9]. This correlation remains unaltered when incorporating symptoms and interventions into the definition. Timely and precise identification of individuals predisposed to IDH, coupled with targeted preventive and therapeutic strategies, proves imperative in the mitigation and management of IDH.
In order to appraise the risk of IDH, numerous studies have been undertaken to formulate risk prediction models. Lin et al. [Citation10] devised a Nomogram model utilizing multifactorial logistic regression analysis. While the internal performance of the model demonstrated general efficacy, it failed to account for comorbid factors and lacked external validation, rendering its external validity uncertain. In recent years, the burgeoning capabilities of machine learning techniques in disease prediction, diagnosis, and treatment [Citation11–13] have extended to IDH prognosis. Lee et al. [Citation14] applied recurrent neural networks in a deep learning model to prognosticate the risk of developing IDH, leveraging a dataset with timestamps representing vital signs over time. However, the model’s drawback lies in its excessive variables and its application limited to a singular population. Zhang et al. [Citation15] formulated a machine-learning model for IDH risk prediction. More recently, Ma et al. [Citation16] conducted a retrospective study employing regularized machine learning techniques, constructing three models – Nomogram model, categorical regression trees (CARTs), and extreme gradient boosting (XGboost) – to predict the occurrence of IDH with commendable accuracy. Nevertheless, all these models lack prospective external validation studies.
The predictive power of risk prediction models may vary over time and scenarios, and the Guidelines for the International Specification of Predictive Models (TRIPOD) advocate [Citation17] that predictive models need to be externally validated by other samples from our center or samples from other centers in addition to internal validation, and calibrated and updated for further assessment of the model’s scientific validity and application value. Islam et al. [Citation18] similarly suggested that predictive models should undergo scrutiny for overfitting and transferability (e.g. to other cohorts, settings) through concise and continuous model training and optimization preceding their application in clinical decision-making, thereby preempting distributional shifts. Despite the proliferation of diverse IDH risk prediction models in recent years, a dearth of prospective external validation studies encompassing multicenter and sizable samples persists. The ineffectual external validation of risk prediction models can substantially diminish their utility in clinical practice [Citation19,Citation20] and curtail their clinical applicability.
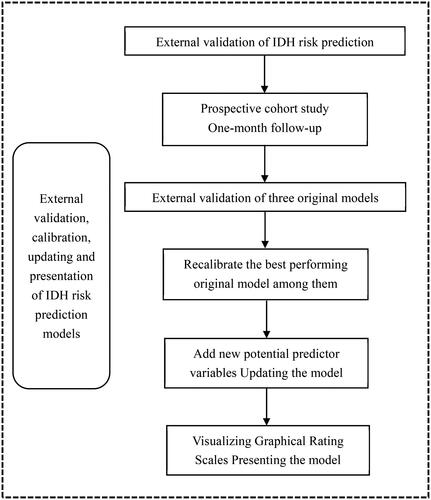
Therefore, the aim of this study was to further validate and compare the performance of the IDH risk prediction model constructed by Ma et al. in a patient cohort of a new time period and a new setting; to recalibrate the coefficients of the original risk prediction model that had the best performance in the external validation and to update the model with the addition of new potential prognostic variables; and to present the updated model as a simplified graphical rating scale, in order to lay a foundation for further generalization and application in practice.
Methods
Study design and participants
The study was a multicenter prospective study in which patients from 10 hemodialysis centers in Sichuan Province were selected from March 2022 to July 2022 as the subjects. Inclusion criteria: age ≥18 years; (2) patients diagnosed with end-stage renal disease according to the KDOQI guidelines and Chronic Kidney Disease Screening, Diagnosis and Prevention Guidelines, and who had received regular hemodialysis treatment for at least 3 months; who had received regular hemodialysis for at least 3 months; and who had complete dialysis data for ≥1 month. Exclusion criteria: Predialysis systolic blood pressure < 90 mmHg (including causes such as severe arrhythmias and heart failure), active tuberculosis, systemic infection, or active malignant tumor; patients with incomplete clinical information or laboratory data. This study was approved by the Ethics Committee of the First Affiliated Hospital of Chengdu Medical College (Ethics Approval No. 2021CYFYIRB-BA-63-02).
Research tools
The questionnaire, which was developed by the investigators, was designed to capture factors that influence IDH in maintenance hemodialysis patients. It included general patient information such as gender, age, and primary disease type, as well as laboratory parameters such as lymphocyte count, albumin, and total cholesterol, and dialysis-related details such as months on dialysis, dry weight, and Inter-dialysis weight gain (IDWG). Based on previous research and clinical evidence [Citation21–23], the questionnaire was expanded to include two additional domains of potential predictor variables: dialysis adequacy (Kt/V, K = dialyzer clearance, t = time, V = water volume) and body composition.
Nomogram for predicting IDH risk in dialysis patients: Our research team developed a prebuilt column-line diagram to predict IDH risk in dialysis patients using eight predictors: sex, age ≥60 years, diabetes mellitus, cardiovascular disease (CVD), inter-dialysis weight gain, pre-dialysis systolic blood pressure and albumin level. Internal validation showed an impressive area under the curve (AUC) of 0.979 for this model.
IDH Risk Prediction Classification Regression Tree for Dialysis Patients: In the preliminary phase of this study, we developed an IDH risk prediction classification regression tree for dialysis patients. The final tree structure consisted of 1 root node, 7 internal nodes, and 9 leaf nodes, and included 4 predictor variables: pre-dialysis systolic blood pressure, pre-dialysis diastolic blood pressure, age, and diabetes mellitus. Logical evaluation began at the root node, with results inferred at the leaf nodes. A probability of occurrence greater than 0.80 indicated high risk, represented by green leaf nodes; conversely, it was indicated by blue leaf nodes. The model achieved an AUC of 0.934 after internal validation.
Extreme Gradient Boosting for IDH Prediction in Dialysis Patients: Our research team developed an IDH prediction model using extreme gradient boosting that included 7 predictors: predialysis systolic blood pressure, predialysis diastolic blood pressure, ultrafiltration volume, albumin, predialysis weight gain, diabetes mellitus, and age. Internal validation showed an exceptional AUC of 0.992 for this model.
Data collection
Baseline Variables: We collected demographic characteristics of patients at enrollment, along with laboratory parameters and dialysis-related information for the respective month, from electronic medical records stored in the hospital information system.
Body composition: At baseline, trained investigators performed body composition measurements approximately 10–15 min after hemodialysis [Citation24]. These measurements included body mass index (BMI), subcutaneous fat (assessed by biceps skinfold thickness [BSF] and triceps skinfold thickness [TSF]), lean muscle mass (assessed by mid-arm circumference [MAC] and mid-arm muscle circumference [MAMC]), visceral fat (assessed by waist circumference [WC]), and muscle strength (assessed by handgrip strength [HGS]) [Citation25].
Definition
Blood pressure was monitored for one month using a noninvasive electronic sphygmomanometer with an upper-arm cuff, according to the World Health Organization (WHO) specifications for blood pressure measurement [Citation26]. Hypotension was characterized by a systolic blood pressure below 90 mmHg during dialysis, and IDH was defined as the occurrence of at least one episode of hypotension within one month of hemodialysis treatment [Citation27]. If a patient experienced IDH, detailed records of the hemodialysis session were kept and data collection was stopped. Patients who did not experience IDH were followed for one month.
Statistical analysis
Data analysis was performed using SPSS version 26.0 and R statistical software version 4.1.2. Non-normally distributed measures were presented as medians and quartiles, whereas categorical variables were presented as frequencies and percentages. Significance was indicated by p < .05.
External validation and recalibration of the three original models
The three initial models were externally validated using the full study cohort (n = 2235). To assess predictive model performance, discrimination was assessed using the area under the ROC curve (AUC), while calibration was assessed using calibration plots and Brier scores. Following external validation, the coefficients (intercepts and slopes) of the best-performing original model were recalibrated within the full study cohort (n = 2235). The performance of the recalibrated model was assessed using the same methods as in the external validation phase.
Model update and internal validation
The updated model was developed and subsequently validated using two randomly generated split samples. Specifically, these samples consisted of a development set (n = 1260) and a validation set (n = 975), both drawn from the larger study cohort of 2235 participants. These samples were stratified based on the number of patients at each dialysis center to ensure equal representation of centers compared to the full study cohort [Citation28]. Backward stepwise selection was applied by using the likelihood ratio test with Akaike’s information criterion as the stopping rule [Citation29]. Starting with the original predictor variables, followed by the newly introduced potential predictors (Kt/V, BMI, BSF, TSF, MAC, MAMC, WC and HGS), we assessed whether the overall model fit significantly deteriorated using AIC and the likelihood ratio test (LR). Variables were eliminated if their inclusion did not result in a significant decrease in AIC or LR [Citation30]. Specifically, we removed variables with odds ratios closest to 1 and the largest p-values. Finally, the updated model with the lowest AIC and consistent LR values was selected for this study.
The reproducibility of the updated model was validated internally using the validation set and its predictive performance was fully assessed in four dimensions: discrimination, calibration, reclassification (using net reclassification improvement [NRI] and integrated discrimination improvement [IDI]), and clinical benefit (using decision curve analysis [DCA]). The general flow of this study is shown in ().
Figure 1. Flow chart of research method.
Results
Baseline characteristics of participants
A total of 2482 patients were recruited for this study, of which 2339 patients met the inclusion and exclusion criteria and were included in our study. At 1-month follow-up, the dropout rate for the outcome measure was 4.4% (n = 104). The exact process of recruiting patients is shown in .
Figure 2. Flowchart recruitment process of the study population.
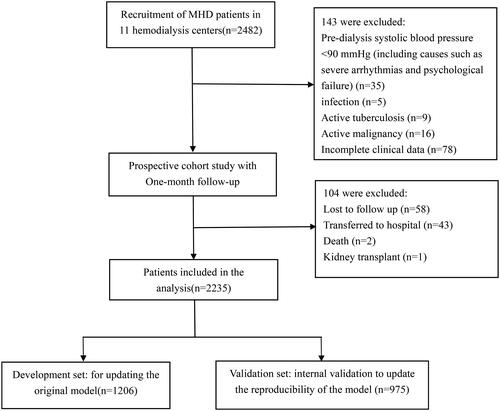
Thus, the final 2235 MHD patients included in the study and statistically analyzed for data had an incidence of IDH of 14.6% (327/2,235). Baseline characteristics of the complete study sample, development set, and validation set for this study are shown in .
Table 1. Baseline patient characteristics.
Comparison of external validation of three original models
We generated ROC curves to evaluate the discriminative ability of the three original prediction models (nomogram model, CART model, and XGboost model) in the new MHD patient cohort. The results showed that the AUC values for the three original prediction models were 0.746 (95% CI: 0.718–0.775), 0.709 (95% CI: 0.679–0.739) and 0.735 (95% CI: 0.706–0.764), as shown in . Since the original column-line diagram model showed the strongest overall performance during the external validation, it was selected for the subsequent stepwise analysis with recalibration and updating. and , along with , provide a summary of key results from all discrimination and calibration analyses.
Figure 3. ROC curves for predicting the occurrence of IDH in MHD patients. AUC = 0.5 indicates no discrimination whereas AUC = 1.0 indicates perfect discrimination. The solid reference line refers to no discrimination.
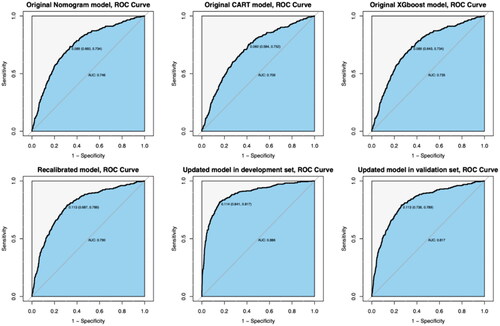
Figure 4. Calibration plots for predicting the occurrence of IDH. Note: The red reference line indicates a perfect fit, i.e., the predicted probability of IDH occurrence is the same as the observed probability of IDH occurrence.
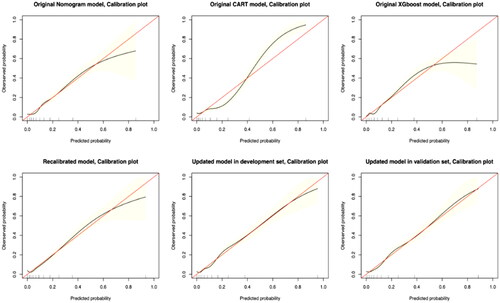
Table 2. Summary and comparison of model performance.
Recalibration of the original nomogram model
We recalibrated the coefficients of the predictor variables in the original nomogram model, and the results are presented in . This recalibration process resulted in an improvement in the AUC value, which increased from 0.746 to 0.790 (). In addition, the calibration plots showed a significant improvement in the consistency and accuracy of the recalibrated model ().
Table 3. Parameter estimation in the models.
Model update and internal validation
The updated model includes a total of seven variables that significantly predict the occurrence of IDH in MHD patients. Among these, four newly added prognostic variables, namely Kt/V < 1.2, BMI < 18.5 kg/m2, %MAMC < 90% and possible sarcopenia, were integrated. This expansion of predictor variables resulted in a strong performance of the updated model in terms of both discrimination and calibration. Detailed parameters for each predictor variable in the updated model are shown in . Internally validated within the validation set, the updated model maintained robust discrimination (AUC value of 0.817 [95% CI: 0.791 to 0.842]) and accurate calibration (Brier score = 0.081), with closely matched predicted and observed probabilities of IDH occurrence within a 1-month follow-up period.
Furthermore, the updated model demonstrated substantial net clinical benefit across a range of threshold probabilities from 15.2% to 87.1%, indicating its clinical utility, as shown in . Compared to the original nomogram model, reclassification as assessed by NRI (0.383; 95% CI, 0.271 to 0.503) and IDI (0.157; 95% CI, 0.092 to 0.285) classification showed significant improvement.
Figure 5. DCA analysis of the updated model.
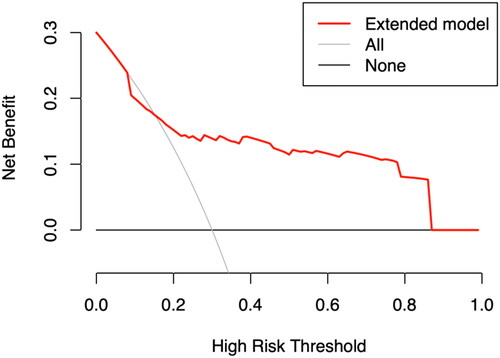
The x-axis represents the threshold probability of IDH; the y-axis represents the net benefit.
Model presentation
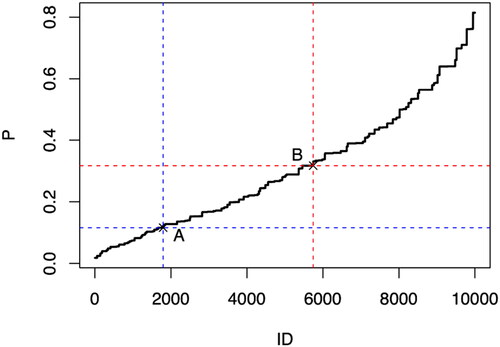
Using the model coefficients from the updated model, we constructed a joint distribution using a simulated data set. After considering the average exposure rate of IDH occurrence in MHD patients, we identified two critical points for risk classification: point A at position 1795 (incidence probability of 0.116) and point B at position 5744 (incidence probability of 0.317). These points delineate the risk classes of low versus medium and medium versus high risk for IDH occurrence in MHD patients after rigorous iterative calculation and validation ().
Figure 6. Node plot of the risk grade of IDH in MHD patients.
Using the established risk class criteria, we calculated and tabulated the probabilities of IDH development for all combinations of the seven predictor variables (female sex, age ≥60 years, diabetes, Kt/V < 1.2, BMI <18.5 kg/m2, %MAMC <90%, and possible sarcopenia) and color-coded these probabilities for clarity, with green indicating low risk, yellow indicating intermediate risk, and red indicating high risk. The results were then presented as a graphical rating scale ().
Figure 7. Graphical score chart for probability of IDH for patients with MHD. The number in each box indicates the probability of occurrence of IDH, and the three colors represent different risk levels; %MAMC: Standard percentage of MAMC; MAMC: Mid-arm muscle circumference; Kt/V: dialysis adequacy; BMI: body mass index; DM: diabetes mellitus.
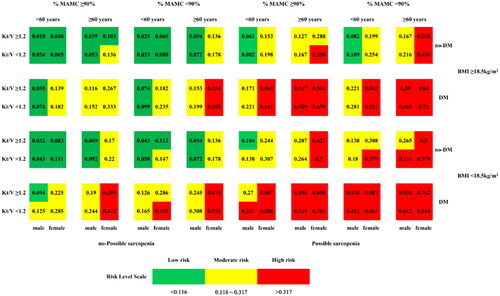
To illustrate, consider a 63-year-old female MHD patient with coexisting diabetes mellitus, last recorded BMI of 16.7 kg/m2, Kt/V of 0.8, %MAMC of 92%, and HGS of 19.6 kg-f. Such a patient would quickly be classified as high risk (red color) for the development of IDH.
Discussion
In this study, three original IDH prediction models constructed by Ma et al. were externally verified in 11 hemodialysis centers in Sichuan Province, China, including time verification and geographical verification [Citation31]. The outcomes revealed the superior performance of the original column-line graph model in the external validation, boasting an AUC value of 0.746 (95% CI: 0.718-0.775), aligning closely with the observations of Hong et al. who reported an AUC of 0.743 [Citation32]. Nevertheless, it was discerned that the discriminative and calibration capabilities of all three initial prediction models were notably overestimated. This discrepancy may be attributed to variations in the study timeframe, geographical locale, and the original modeling cohort [Citation33]. Moreover, it has been postulated that certain predictors, omitted from the models, might exert influence on the results [Citation34]. Conventionally, the performance of models in external validation cohorts tends to be inferior compared to development cohorts. This underscores the imperative for continual calibration and refinement of IDH prediction models within dialytic contexts, thereby enhancing their prognostic accuracy in novel demographic populations [Citation35,Citation36].
Through model calibration, the AUC value of the original Nomogram chart model witnessed enhancement, reaching 0.790. Given that the onset and progression of IDH entail a multifactorial and interactive process, the revelation of predictor variables for patient prognosis, along with timely adjustments, proves imperative. Following external validation, recalibration, and model updates, three original predictor variables – specifically, female gender, age ≥60 years, and comorbid diabetes mellitus – maintained their robust predictive capacity. This underscores the importance of sequential investigations to identify predictor variables significantly associated with outcomes and exhibiting stability. The incorporation of new prognostic variables, including Kt/V < 1.2, BMI < 18.5 kg/m2, %MAMC < 90%, and potential sarcopenia, led to a notable overall improvement in the model’s predictive efficacy. The updated model demonstrated effective discrimination and robust calibration, as corroborated by Decision Curve Analysis (DCA), revealing superior net benefit across a broad spectrum of probability thresholds (15.2% to 87.1%). This suggests that the model is inclined toward providing tangible clinical advantages. Precision in prognostic information serves as the foundational bedrock of optimal clinical practice. Such revelations facilitate collaborative decision-making between patients and healthcare practitioners, thereby mitigating the propensity for excessive surveillance in low-risk scenarios and averting delays in therapeutic interventions, where patients stand to accrue heightened net clinical benefits [Citation37].
Kt/V stands as the prevailing metric for assessing dialysis adequacy, and our findings indicate that hemodialysis patients exhibiting a Kt/V < 1.2 manifest an elevated likelihood of encountering intradialytic hypotension (OR: 1.374). This concurs with outcomes observed in antecedent research studies [Citation21]. Such an association may be attributed to suboptimal dialysis, a circumstance predisposing individuals to a cascade of complications, including disturbances in water-electrolyte balance, thereby instigating aberrant fluctuations in blood pressure. This underscores the imperative for in-depth investigation into fluid management strategies among hemodialysis patients and the intricate equilibrium required to address the confluence of fluid overload and hypotension during dialytic procedures.
Body Mass Index (BMI) is acknowledged as a valid prognosticator of mortality in hemodialysis patients. Our investigation revealed that a BMI <18.5 kg/m2 heightened the incidence of IDH, aligning with antecedent studies indicating that diminished BMI elevates the susceptibility to infections, cardiovascular diseases, and predisposes individuals to peripheral vascular sclerosis. This condition is characterized by decreased peripheral vasoconstrictive function and insufficient circulating blood volume, culminating in the development of hypotension [Citation38]. Additionally, some scholars have posited that individual body composition indicators (e.g. Triceps Skinfold Thickness and Waist Circumference as proxies for subcutaneous and visceral fat) exhibit analogous or even more robust associations with survival in hemodialysis patients compared to BMI [Citation25,Citation39]. However, our current study did not substantiate such findings; instead, %Mid-Arm Muscle Circumference (%MAMC) and potential sarcopenia demonstrated heightened predictive properties for IDH. Our results underscore the significance of sarcopenia, delineated by the pivotal attributes of muscle mass and strength, in shaping the prognosis of hemodialysis patients. These noninvasive, straightforward, and cost-effective bedside anthropometric measures may prove more advantageous for real-time health monitoring, as they appear to possess superior predictive capabilities for outcomes such as diminished quality of life, major adverse cardiovascular events, and mortality [Citation40]. This suggests that clinical staff should encourage patients to strengthen exercise and negotiate an activity plan based on their physical condition to gradually improve muscle mass and muscle strength in MHD patients, as well as instructing a reasonable diet to ensure that patients receive adequate nutrition and improve their nutritional status.
The ideal clinical prediction model should embody precision and user-friendliness within the realm of clinical practice. Recently disseminated guidelines on the presentation of prediction models in clinical settings unequivocally underscore that the optimal display mode should be tailored to users and their environmental context. It is particularly advantageous for stakeholders, including patients, to actively partake in the decision-making process [Citation41]. Hoesseini et al. [Citation42], in their exploration of optimal visual formats, engaged both physicians and patients, revealing a predilection among doctors for survival charts, while patients favored pie charts. In instances where the target audience comprises medical professionals and patients, concise and lucid graphics may constitute a superior presentational form.
Therefore, in this study, through the quantification and amalgamation of incremental risks among predictive variables, the association between patient characteristics and outcomes is delineated. A graphical score table, adorned with three distinct colors, is meticulously crafted, embodying simplicity and intuitiveness. This manifestation authentically realizes the visual representation of the predictive model. It proves advantageous for clinicians in comprehending the vulnerabilities in clinical blood pressure management, thereby laying an evidence-based foundation for the formulation of future clinical practice guidelines in the domain of hemodialysis treatment and nursing. Simultaneously, within the sphere of clinical practice, healthcare professionals possess the capability to generate a color-printed graphical score sheet for direct visual reference. This obviates the necessity for intricate formulaic computations, enabling the expeditious determination of the patient’s risk level for IDH. Consequently, this facilitates the implementation of tailored and categorized personalized treatment and care.
Conclusions
In this study, the risk prediction model for IDH developed by Ma et al. underwent independent and external validation through a multicenter, prospective cohort study characterized by a substantial sample size. This approach effectively mitigated various forms of bias when juxtaposed with retrospective studies. Remarkably, this study stands as the inaugural endeavor to recalibrate and update the prediction model concerning the incidence of IDH in MHD patients, thereby enhancing both predictive efficacy and clinical applicability. Simultaneously, a graphical scale was meticulously devised, further refining the predictive efficacy and generalizability of the model. This innovation serves to adeptly screen and categorize MHD patients, facilitating precise prevention and control measures, and guiding clinical medical decisions with efficacy.
This study has several limitations. First, we were unable to collect data on certain factors, such as vital signs and hemodialysis settings over time, which may have influenced our predictive ability. Second, we did not categorize IDH based on its frequency of occurrence, which limited our ability to identify predictive factors that discriminate between frequent and episodic cases. Further research is needed to develop a valuable and clinically applicable predictive model. In the future, we would like to further promote and apply the IDH risk prediction model for dialysis patients and evaluate its impact on both MHD patients and health care professionals, and implement interventions targeting predictive factors that may help reduce the incidence of IDH in dialysis patients.
Statement of ethics
This study was approved by the Ethics Committee of the First Affiliated Hospital of Chengdu Medical College (Ethics Approval No. 2021CYFYIRB-BA-63-02). This research study was conducted in accordance with the guidelines of the Declaration of Helsinki. All patients have informed consent.
Disclosure statement
No potential conflict of interest was reported by the author(s).
Additional information
Funding
References
- Htay H, Bello AK, Levin A, et al. Hemodialysis use and practice patterns: an international survey study. Am J Kidney Dis. 2021;77(3):1–11. doi: 10.1053/j.ajkd.2020.05.030.
- Kanbay M, Ertuglu LA, Afsar B, et al. An update review of intradialytic hypotension: concept, risk factors, clinical implications and management. Clin Kidney J. 2020;13(6):981–993. doi: 10.1093/ckj/sfaa078.
- Kuipers J, Verboom LM, Ipema KJR, et al. The prevalence of intradialytic hypotension in patients on conventional hemodialysis: a systematic review with meta-analysis. Am J Nephrol. 2019;49(6):497–506. doi: 10.1159/000500877.
- Mc Causland FR, Tumlin JA, Roy-Chaudhury P, et al. Intradialytic hypotension and cardiac arrhythmias in patients undergoing maintenance hemodialysis: results from the monitoring in dialysis study. Clin J Am Soc Nephrol. 2020;15(6):805–812. doi: 10.2215/CJN.06810619.
- Reeves PB, Mc Causland FR. Mechanisms, clinical implications, and treatment of intradialytic hypotension. Clin J Am Soc Nephrol. 2018; 13(8):1297–1303. doi: 10.2215/CJN.12141017.
- Sohn P, Narasaki Y, Rhee CM. Intradialytic hypotension: is timing everything? Kidney Int. 2021;99(6):1269–1272. doi: 10.1016/j.kint.2021.03.012.
- Takahashi R, Uchiyama K, Washida N, et al. Mean annual intradialytic blood pressure decline and cardiovascular events in Japanese patients on maintenance hemodialysis. Hypertens Res. 2023;46(6):1536–1546. doi: 10.1038/s41440-023-01228-8.
- Kim KY, Park HS, Kim JS, et al. Comparison of intradialytic blood pressure metrics as predictors of all-cause mortality. Clin Kidney J. 2021;14(12):2600–2605. Published 2021 Jul 6. doi: 10.1093/ckj/sfab124.
- Flythe JE, Xue H, Lynch KE, et al. Association of mortality risk with various definitions of intradialytic hypotension. J Am Soc Nephrol. 2015;26(3):724–734. doi: 10.1681/ASN.2014020222.
- Lin LS, He LF, Ying XH. Development of a risk prediction model for intradialytic hypotension in patients with maintenance hemodialysis. Chin J Nurs. 2021;56(10):1466–1471. doi: 10.3761/j.issn.0254-1769.2021.10.004.
- Beinecke JM, Anders P, Schurrat T, et al. Evaluation of machine learning strategies for imaging confirmed prostate cancer recurrence prediction on electronic health records. Comput Biol Med. 2022;143:105263. doi: 10.1016/j.compbiomed.2022.105263.
- Yu X, Qin W, Lin X, et al. Synergizing the enhanced RIME with fuzzy K-nearest neighbor for diagnose of pulmonary hypertension. Comput Biol Med. 2023;165:107408. doi: 10.1016/j.compbiomed.2023.107408.
- Hu K, Zhao L, Feng S, et al. Colorectal polyp region extraction using saliency detection network with neutrosophic enhancement. Comput Biol Med. 2022;147:105760. doi: 10.1016/j.compbiomed.2022.105760.
- Lee H, Yun D, Yoo J, et al. Deep learning model for real-time prediction of intradialytic hypotension. Clin J Am Soc Nephrol. 2021;16(3):396–406. doi: 10.2215/CJN.09280620.
- Zhang H, Wang LC, Chaudhuri S, et al. Real-time prediction of intradialytic hypotension using machine learning and cloud computing infrastructure. Nephrol Dial Transplant. 2023;38(7):1761–1769. Jun 30 doi: 10.1093/ndt/gfad070.
- Ma GT, Ma X, Xu WB, et al. Study on risk prediction models for intradialytic hypotension in maintenance hemodialysis patients. J Chengdu Med Coll. 2023;18(01):122–127 + 136. doi: 10.3969/j.issn.1674-2257.2023.01.025.
- Moons KG, Altman DG, Reitsma JB, et al. Transparent reporting of a multivariable prediction model for individual prognosis or diagnosis (TRIPOD): explanation and elaboration. Ann Intern Med. 2015;162(1):W1–73. doi: 10.7326/M14-0698.
- Islam SMS, Khosravi A. The need for a prediction model assessment framework. Lancet Glob Health. 2021;9(4):e404. doi: 10.1016/S2214-109X(21)00022-X.
- Slieker RC, van der Heijden AAWA, Siddiqui MK, et al. Performance of prediction models for nephropathy in people with type 2 diabetes: systematic review and external validation study. BMJ. 2021;374:n2134. doi: 10.1136/bmj.n2134.
- Freundlich RE, Clifton JC, Epstein RH, et al. External validation of a predictive model for reintubation after cardiac surgery: a retrospective, observational study. J Clin Anesth. 2024;92:111295. doi: 10.1016/j.jclinane.
- Dasgupta I, Thomas GN, Clarke J, et al. Associations between hemodialysis facility practices to manage fluid volume and intradialytic hypotension and patient outcomes. Clin J Am Soc Nephrol. 2019;14(3):385–393. doi: 10.2215/CJN.08240718.
- Inagaki K, Tawada N, Takanashi M, et al. The association between body mass index and all-cause mortality in Japanese patients with incident hemodialysis. PLoS One. 2022;17(6):e0269849. Published 2022 Jun 24. doi: 10.1371/journal.pone.0269849.
- Sultan S, Nasir K, Qureshi R, et al. Assessment of the nutritional status of the hemodialysis patients by anthropometric measurements. Cureus. 2021;13(10):e18605. Published 2021 Oct 8. doi: 10.7759/cureus.18605.
- Zhang H, Tao X, Shi L, et al. Evaluation of body composition monitoring for assessment of nutritional status in hemodialysis patients. Ren Fail. 2019;41(1):377–383. doi: 10.1080/0886022X.2019.1608241.
- Rhee CM, Nguyen DV, Moradi H, et al. Association of adiponectin with body composition and mortality in hemodialysis patients. Am J Kidney Dis. 2015;66(2):313–321. doi: 10.1053/j.ajkd.2015.02.325.
- John O, Campbell NRC, Brady TM, et al. The 2020 WHO technical specifications for automated Non-Invasive blood pressure measuring devices with cuff. Hypertension. 2021;77(3):806–812. doi: 10.1161/HYPERTENSIONAHA.120.16625.
- Chou JA, Streja E, Nguyen DV, et al. Intradialytic hypotension, blood pressure changes and mortality risk in incident hemodialysis patients. Nephrol Dial Transplant. 2018;33(1):149–159. doi: 10.1093/ndt/gfx037.
- Cervellera C, Maccio D. Distribution-preserving stratified sampling for learning problems. IEEE Trans Neural Netw Learn Syst. 2018;29(7):2886–2895. doi: 10.1109/TNNLS.2017.2706964.
- Na L, Li J, Pan C, et al. Development and validation of a predictive model for major complications after extracorporeal shockwave lithotripsy in patients with ureteral stones: based on a large prospective cohort. Urolithiasis. 2023;51(1):42. Published 2023 Mar 2. doi: 10.1007/s00240-023-01417-7.
- Barbour SJ, Coppo R, Zhang H, et al. Evaluating a new international risk-prediction tool in IgA nephropathy. JAMA Intern Med. 2019;179(7):942–952. 1 doi: 10.1001/jamainternmed.2019.0600.
- Toll DB, Janssen KJ, Vergouwe Y, et al. Validation, updating and impact of clinical prediction rules: a review. J Clin Epidemiol. 2008;61(11):1085–1094. doi: 10.1016/j.jclinepi.2008.04.008.
- Hong D, Chang H, He X, et al. Construction of an early alert system for intradialytic hypotension before initiating hemodialysis based on machine learning. Kidney Dis (Basel). 2023;9(5):433–442. Published 2023 Jun 23. doi: 10.1159/000531619.
- Ramspek CL, Jager KJ, Dekker FW, et al. External validation of prognostic models: what, why, how, when and where? Clin Kidney J. 2020;14(1):49–58. doi: 10.1093/ckj/sfaa188.
- Zhang LD, Hu FX, Wang J, et al. External validation of risk prediction models for postpartum stress urinary incontinence. Chin Gen Pract. 2022;25(09):1088–1092. doi: 10.12114/j.issn.
- Van Calster B, Van Hoorde K, Vergouwe Y, et al. Validation and updating of risk models based on multinomial logistic regression. Diagn Progn Res. 2017;1(1):2. doi: 10.1186/s41512-016-0002-x.
- Li XC, Wang CS, Hao J, et al. An introduction to the calibration and update methods of clinical prediction models and its implementation by R software. Chinese Journal of Evidence-Based Medicine. 2023;23(01):112–119. doi: 10.7507/1672-2531.202209029.
- Alba AC, Agoritsas T, Walsh M, et al. Discrimination and calibration of clinical prediction models: users’ guides to the medical literature. JAMA. 2017;318(14):1377–1384. doi: 10.1001/jama.2017.12126.
- Sumida K, Yamamoto S, Akizawa T, et al. Body mass index change and hospitalization risk in elderly hemodialysis patients: results from Japanese dialysis outcomes and practice patterns study. Am J Nephrol. 2018;47(1):48–56. doi: 10.1159/000486559.
- Park J, Ahmadi SF, Streja E, et al. Obesity paradox in end-stage kidney disease patients. Prog Cardiovasc Dis. 2014;56(4):415–425. doi: 10.1016/j.pcad.2013.10.005.
- March DS, Wilkinson TJ, Burnell T, et al. The effect of non-pharmacological and pharmacological interventions on measures associated with sarcopenia in end-stage kidney disease: A systematic review and meta-analysis. Nutrients. 2022;14(9):1817. doi: 10.3390/nu14091817.
- Bonnett LJ, Snell KIE, Collins GS, et al. Guide to presenting clinical prediction models for use in clinical settings. BMJ. 2019;365:l737. Published 2019 Apr 17. doi: 10.1136/bmj.l737.
- Hoesseini A, van Leeuwen N, Offerman MPJ, et al. Predicting survival in head and neck cancer: external validation and update of the prognostic model OncologIQ in 2189 patients. Head Neck. 2021;43(8):2445–2456. doi: 10.1002/hed.26716.