
Abstract
Background
Acute kidney injury (AKI) is a frequent complication of severe acute pancreatitis (SAP). Previous investigations have revealed the involvement of FTO alpha-ketoglutarate-dependent dioxygenase (FTO) and aquaporin 3 (AQP3) in AKI. Therefore, the aim of this study is to explore the association of FTO and AQP3 on proximal tubular epithelial cell damage in SAP-induced AKI.
Methods
An in-vitro AKI model was established in human proximal tubular epithelial cells (PTECs) HK-2 via tumor necrosis factor-α (TNF-α) induction (20 ng/mL), after which FTO and AQP3 expression was manipulated and quantified by quantitative real-time PCR and Western blotting. The viability and apoptosis of PTECs under various conditions, and reactive oxygen species (ROS), superoxide dismutase (SOD), and malonaldehyde (MDA) levels within these cells were measured using commercial assay kits and flow cytometry. Methylated RNA immunoprecipitation and mRNA stability assays were performed to elucidate the mechanism of FTO-mediated N6-methyladenosine (m6A) modification. Western blotting was performed to quantify β-catenin protein levels in the PTECs.
Results
FTO overexpression attenuated the TNF-α-induced decrease in viability and SOD levels, elevated apoptosis, increased levels of ROS and MDA, and diminished TNF-α-induced AQP3 expression and reduced β-catenin expression, but its silencing led to contradictory results. FTO negatively modulates AQP3 levels in RTECs in an m6A-depednent manner and compromises AQP3 stability. In addition, all FTO overexpression-induced effects in TNF-α-induced PTECs were neutralized following AQP3 upregulation.
Conclusion
FTO alleviates TNF-α-induced damage to PTECs in vitro by targeting AQP3 in an m6A-dependent manner.
1. Introduction
Acute pancreatitis (AP) is currently one of the most prevalent diseases among the gastroenteric disorders [Citation1]. Severe acute pancreatitis (SAP) develops in approximately 20% of patients with AP and may be associated with multiorgan failure [Citation2]. Acute kidney injury (AKI) is a common complication of AP with increased mortality and is defined as a sudden loss of excretory kidney function [Citation3,Citation4]. AKI has been recognized as a heterogeneous syndrome that affects not only acute morbidity and mortality but also the long-term prognosis [Citation5]. The mechanism of SAP-induced AKI, is mainly associated with systemic inflammatory response syndrome (SIRS), which involves a variety of cytokines and inflammatory mediators, such as tumor necrosis factor (TNF)-α, interleukin (IL)-1β, IL-6 and nuclear factor-kB (NF-kB), is complex [Citation6]. Among them, TNF-α is a key promoter of SAP-ALI development and can cause activation and injury of endothelial cells [Citation4,Citation7]. Further, some inflammatory mediators, such as complement activation products and reactive oxygen species (ROS) accumulation, also play a key role in this process [Citation8]. Hence, a detailed discussion of the mechanisms underlying AKI may provide some clinical clues for the management of AKI.
Wnt signaling plays a double-edged role in kidney injury and repair, and previous studies have found that appropriate activation of Wnt signaling has a kidney protective effect [Citation9]. Elevated ROS is associated with severe kidney injury, and Wnt-mediated pronephros development can be regulated by controlling ROS levels [Citation10]. Aquaporin 3 (AQP3) prevents activation of Wnt signaling pathways [Citation11]. AQP3 plays a dominant role in water reabsorption and transports glycerol and urea [Citation12]. AQP3 deficiency retarded cyst enlargement in experimental mouse models of autosomal dominant polycystic kidney disease [Citation13]. Further analysis revealed that AQP3 levels within the colon tissue were elevated in rats following the SAP model [Citation14]. And previous study showed that overexpression of AQP3 alleviates apoptosis, reduces intracellular ROS content, and inhibits p38 MAPK pathway in nucleus pulposus cells after oxidative injury [Citation15]. And down-regulation of AQP3 impairs cellular antioxidant response and H2O2 uptake under oxidative stress [Citation16]. Therefore, we speculated that AQP3 might aggravate SAP-induced AKI by inhibiting Wnt pathway and blocking renal repair.
Furthermore, with an understanding of the underlying mechanisms of AKI, alterations in N6-methyladenosine (m6A) modifications in kidney diseases (including AKI) have already been revealed [Citation17,Citation18). Currently, m6A is one of the most important RNA modifications because of its involvement in some pathological and physiological events [Citation19]. FTO alpha-ketoglutarate-dependent dioxygenase (FTO) is an m6A demethylase that erases m6A modifications from target mRNAs [Citation20,Citation21]. In addition to extensive research highlighting the involvement of FTO in obesity and cancer, recent studies have further supported the role of FTO in neuropsychiatric disorders and even SAP [Citation22,Citation23]. Additional evidence has supported that FTO levels are decreased in cisplatin-treated AKI models, together with increased m6A level [Citation24]. Moreover, the prediction from RM2target suggested that FTO may be an m6A-relevant demethylase of AQP3. Hence, the aim of this study is to explore whether FTO mitigated proximal tubular epithelial cell damage in TNF-α-induced SAP-induced AKI by targeting AQP3 in a m6A-dependent manner.
2. Material and methods
2.1. Cell culture and intervention
Human proximal tubular epithelial cells (PTECs) HK-2 (CL-0109, Procell, Wuhan, China) were maintained in non-essential amino acid-enriched minimal essential medium (PM150410, Procell, China) supplemented with 10% fetal bovine serum (164210, Procell, China) and 1% penicillin–streptomycin (PB180120, Procell, China), and incubated in a Heracell™ 240i CO2 incubator (51032875, ThermoFisher, Waltham, MA, USA) at 37 °C with 5% CO2.
Lyophilized TNF-α (SRP3177) was obtained from Merck KGaA (Darmstadt, Germany) and reconstituted in water to an adjusted concentration of 20 ng/mL. Hereafter, PTECs were treated with the aforementioned concentration of TNF-α for 12 h to mimic SAP-induced AKI [Citation25].
To reveal the effects of FTO and AQP3 in SAP-induced AKI, full-length complementary DNA (cDNA) sequence clones of FTO (G118994) and AQP3 (G109123) were ligated to the pDONR223 vector (zi-005797, Zlzt Bio, Wuhan, China) to overexpress FTO and AQP3. An empty vector was used as the negative control. Short hairpin RNA (shRNA) targeting FTO (shFTO, TR308064) and scrambled shRNA control (shNC, TR30012) were purchased from Origene (Rockville, MD, USA). Thereafter, these constructs and the transfection kit (11668-027, Invitrogen, Carlsbad, CA, USA) were diluted in Opti-MEM serum-reduced medium (31985-062, Gibco, Grand Island, NY, USA), following which these complexes were added to PTECs for 48-h transfection as to the manufacturer’s protocols. The sequences used in this assay are listed in .
Table 1. Sequences used for transfection.
2.2. Cell counting kit-8 (CCK-8) assay
The viability of PTECs following various interventions was measured via the CCK-8 assay using a commercial assay kit (96992; Sigma-Aldrich, Darmstadt, Germany). In detail, PTECs were grown in a 96-well plate at a density of 2 × 10³ cells per well for 48 h, and 10 μL CCK-8 working solution for a subsequent 4-h incubation. The absorbance at 450 nm was measured using a microplate absorbance reader (iMark™, Bio-Rad, Hercules, CA, USA) to estimate the viability of the PTECs.
2.3. Terminal deoxynucleotidyl transferase dUTP nick end labeling (TUNEL) assay
This assay was performed using an assay kit (12156792910, Sigma-Aldrich, Germany) [Citation26]. PTECs with various interventions (5 × 10⁴ cells/well) were seeded in 12-well plates and fixed with 4% paraformaldehyde (P6148, Sigma-Aldrich, Germany) at ambient temperature for 10 min, then permeabilized in 1% Triton X-100 (T8787, Sigma-Aldrich, Germany) for 5 min and covered with 50 mL of TdT enzyme reaction solution for 1-h incubation in a wet box. PTECs were further covered with 50 mL streptavidin-fluorescein labeling buffer at 37 °C for 30 min, and the nuclei were stained with 10 µL 4′, 6-Diamidino-2-phenylindole dihydrochloride (DAPI, D9542, Sigma-Aldrich, Germany) for 5 min. A confocal laser scanning microscope (Stellaris 5, Leica, Wetzlar, Germany) was used to observe the cells at 200 × magnification.
2.4. Reactive oxygen species (ROS) quantification assay
For the ROS quantification assay, PTECs under different interventions were rinsed and resuspended in Hank’s buffered saline solution (PB180323, Procell, China) and 2′,7′-dichlorofluorescin diacetate (DCFH-DA, D6883, Sigma-Aldrich, Germany) at 37 °C for 30 min. Finally, cells were analyzed in the fluorescein isothiocyanate channel (FITC) of the flow cytometer (CytoFLEX LX, Beckman Coulter, Indianapolis, IN, USA), and the mean fluorescence intensity (MFI) was recorded to estimate ROS content in PTECs of different groups [Citation27].
2.5. Determination on superoxide dismutase (SOD) and malondialdehyde (MDA) contents
The SOD (S0101M) and MDA (S0131M) contents within the PTECs of different groups were quantified in accordance with the relevant assay kit (Beyotime, Shanghai, China).
To quantify the SOD content in PTECs, SOD sample preparation buffer was added to 1 × 10⁷ PTECs and centrifuged at 12,000 g for 5 min at 4 °C to lyse the cells. The supernatant was then taken as the test sample, and the protein concentration was determined using a BCA protein assay kit (P0009, Beyotime, China). Then, the test sample was diluted and added to the working solution for 30-min incubation at 37 °C. The absorbance at 450 nm was recorded using a microplate reader.
To measure the MDA content, 1 × 10⁷ cells were homogenized and centrifuged at 10,000 g for 10 min to harvest the supernatant. Protein content was also quantified, after which the homogenate was mixed with the testing solution and boiled at 100 °C for 10 min. The mixture was then cooled in a water bath and centrifuged at 1,000 g for 10 min at ambient temperature. The supernatant (200 µL) was transferred to 96-well plates and the absorbance at 532 nm was read using a microplate reader.
2.6. Western blotting
Briefly, PTECs from various groups were treated with RIPA lysis buffer (P0013B, Beyotime, China) supplemented with a protease and phosphatase inhibitor cocktail (P1046, Beyotime, China). The concentration of the protein sample was measured using a BCA protein assay kit. Proteins were separated by sodium dodecyl sulfate polyacrylamide gel electrophoresis in 6% and 8% gels (P0012A, Beyotime, China) and transferred onto polyvinylidene fluoride membranes (FFP33, Beyotime, China). The membranes were blocked in the corresponding blocking buffer (P0023B, Beyotime, China) for 1 h and incubated with primary antibodies (Abcam, Cambridge, UK) against AQP3 (ab307969, 1:1,000, 31 kDa), β-catenin (ab223075, 1:5,000, 92 kDa), Bax (ab32503, 1:1,000, 20 kDa), cleaved-caspase 3 (ab32042, 1:500, 17 kDa), Bcl-2 (ab182858, 1:10,000, 26 kDa) and housekeeping control β-actin (ab8225, 1:10,000, 42 kDa) at 4 °C overnight and rinsed in TBS buffer with Tween-20 (ST671, Beyotime, China). Horseradish peroxide-conjugated secondary antibodies against rabbit IgG (ab205718, 1:2,000) and mouse IgG (ab205719, 1:2,000) were used for further culturing with the membranes at ambient temperature for 1 h. Protein bands were visualized using BeyoECL Plus reagent (P0018S, Beyotime, China) and a ChemiDcoTM XRS + imager (Bio-Rad, USA). The average intensities of these bands were quantified using ImageJ 5.0 (Bio-Rad, USA), and the results were normalized to the housekeeping control β-actin.
2.7. m6A content quantification test
All processes were based on an existing protocol [Citation28]. For this assay, total RNA from PTECs (5 × 10⁶) was isolated using TriZol (15596-026, Invitrogen, USA), incubated at room temperature for 5 min. Thereafter, polyadenylated mRNA was purified from the extracted total RNA. The concentration of RNA was determined using a spectrophotometer (ND-2000, ThermoFisher, USA), and the quantity of RNA sample was checked via electrophoresis on a 0.8% agarose gel (16500-500, Invitrogen, USA). Next, RNA samples were prepared and loaded with the wells. The wells were then covered with foil to prevent light, and electrophoresis was run at 35 V overnight.
For the m6A content quantification test, after confirming that the RNA samples were transferred from the gel to the membrane, the membrane was blocked in 5% nonfat milk (P0216, Beyotime, China) in TBST at room temperature for 1 h, rinsed in TBST for 15 min, and incubated with the primary antibody (Abcam, UK) against m6A (ab284130) or IgG (ab172730) at 4 °C overnight and with the secondary antibody against rabbit IgG at room temperature for 1 h. Further, BeyoECL Plus reagent was applied to the membrane, and the m6A content was calculated using ImageJ 5.0 (Bio-Rad Laboratories, Inc., Hercules, CA, USA).
2.8. m6A methylated RNA immunoprecipitation (MeRIP)
Total RNA was extracted using TRIzol, and DNAse (D7073, Beyotime, China) was added for DNA removal. Subsequently, the MeRIP assay was performed using an m6A RNA Enrichment Kit (E1610S, New England Biolabs, Inc., Ipswich, MA, USA). RNA from PTECs was prepared and incubated with protein A/G magnetic beads (16-663X, Sigma-Aldrich, Germany) pre-conjugated with an antibody against m6A or IgG. The co-precipitated RNAs were eluted from the beads, purified, and dissolved in RNase-free water. The binding RNA targets were analyzed by PCR (Citation29).
2.9. mRNA stability assay
The mRNA stability assay was performed as previously described [Citation30]. PTECs were treated with Actinomycin D (5 µg/mL, SBR00013, Sigma-Aldrich, Germany) for 0, 3, and 6 h to block cellular mRNA transcription. These cells were harvested, and total RNA was extracted to detect the mRNA stability of AQP3 in the subsequent quantitative real-time PCR assay.
2.10. RNA isolation and quantitative real-time PCR
As mentioned earlier, the total RNA from the PTECs of each group was extracted, and the concentration was tested. After cDNA synthesis, a commercial cDNA synthesis kit (E6560S, New England Biolabs, Inc., USA), CFX384 Touch Real-Time PCR Detection System (Bio-Rad, USA), and SYBR Green qPCR Mix (D7260, Beyotime, China) were used to run the PCR at the specified conditions:95 °C for 2 min, followed by 40 cycles of 95 °C for 15 s and 60 °C for 30 s. The relevant data were finally calculated using the 2−ΔΔCT method and normalized to the housekeeping control β-actin [Citation31]. The primer sequences used are listed in .
Table 2. Sequences of primers.
2.11. Statistical analysis
All experimental data from at least three independent trials are displayed as mean ± standard deviation and were analyzed using GraphPad Prism 8.0 (GraphPad, Inc., La Jolla, CA, USA). An independent samples t-test was used to compare the data between two groups, while the data among multiple groups were compared using one-way ANOVA. Statistical significance was set p value < .05.
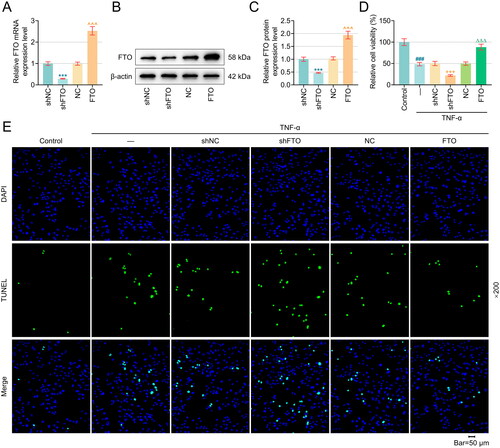
Figure 1. Overexpression of FTO in PTECs diminished TNF-α-induced viability decrease and apoptosis induction, while its silence did oppositely. (A–C) Validation on the transfection efficiency of FTO-specific overexpression plasmid and shRNA into human PTECs HK-2 via quantitative real-time PCR and western blot. β-actin was the housekeeping control. (D) CCK-8 assay results displaying the relative cell viability (%) of human PTECs HK-2 following the intervention of TNF-α and the transfection of FTO-specific overexpression plasmid and shRNA (48 hours). (E) Representative TUNEL staining results hinting the possible effects of TNF-α exposure and FTO-specific overexpression plasmid and shRNA intervention on the apoptosis of human PTECs HK-2 (indicated as green fluorescence). Magnification: 200 times. Scale bar = 50 µm. All experiments were performed in independent triplicates, and the data are expressed as mean ± standard deviation (n = 3). ***p or ^^^p or ###p or +++p or ΔΔΔp < 0.001. * vs. shNC; ^ vs. NC; # vs. Control; + vs. TNF-α+shNC; Δ vs. TNF-α+NC. Abbreviations: FTO, FTO alpha-ketoglutarate-dependent dioxygenase; TNF-α, tumor necrosis factor-α; PTECs, proximal tubular epithelial cells; shRNA, short-hairpin RNA; NC, negative control; CCK-8, cell counting kit-8; DAPI, 4’,6-Diamidino-2-phenylindole dihydrochloride; TUNEL, Terminal deoxynucleotidyl transferase dUTP nick end labeling.
3. Results
3.1. FTO TNF-α-induced viability decrease and apoptosis induction in PTECs
To determine the effects of FTO on the viability and apoptosis of TNF-α-induced PTECs, FTO-specific overexpression plasmids and shRNA were transfected into these cells. The increased or decreased levels of FTO in these cells marked the success of the transfection (, p < .001). Subsequent results from CCK-8 () and TUNEL staining assays () suggested that TNF-α exposure could impair the viability and increase the number of apoptotic cells (as reflected by the increased green fluorescence) in PTECs (, p < .001). In contrast, the overexpression of FTO restored viability and diminished green fluorescence in TNF-α-exposed PTECs (, p < .001), whereas FTO silencing further aggravated the effects of TNF-α (, p < .001). Furthermore, apoptosis-related proteins were detected by western blot, and the result showed that TNF-α exposure increased the Bax and Cleaved-caspase 3 protein expression, and decreased Bcl-2 expression, however, FTO overexpression restored Bax, Cleaved-caspase 3 and Bcl-2 protein expression in TNF-α-exposed PTECs, whereas FTO silencing further aggravated the effects of TNF-α (, p < .05).
Figure 2. Overexpression of FTO reversed TNF-α-induced damage to apoptosis-related proteins, PTECs and the AQP3/β-Catenin axis, while downregulation of FTO did the opposite. (A–D) Western blot was used to measure the expression of Bax, Cleaved-caspase 3 and Bcl-2. (E–F) Flow cytometry (equipped with a DCFH-DA probe) was adopted to assess ROS generation in PTECs with various interventions. (G–H) Relevant quantification on SOD and MDA contents in TNF-α-induced PTECs with intervention of FTO-specific overexpression plasmid and shRNA. (I) Representative protein bands displaying AQP3 and β-Catenin protein expressions in TNF-α-induced PTECs with intervention of FTO-specific overexpression plasmid and shRNA based on western blotting. (J–K) Quantified AQP3 (J) and β-Catenin (K) protein expressions in TNF-α-induced PTECs with intervention of FTO-specific overexpression plasmid and shRNA based on western blotting. β-actin was the housekeeping control. All experiments were performed in independent triplicates, and the data are expressed as mean ± standard deviation (n = 3). +p or Δp < 0.05. ΔΔp or ##p < 0.01. ###p or +++p or ΔΔΔp < 0.001. # vs. Control; + vs. TNF-α+shNC; Δ vs. TNF-α+NC. Abbreviations: ROS, reactive oxygen species; DCFH-DA, 2’,7’-Diochlorofluorescin Diacetate; FITC, fluorescein isothiocyanate; MFI, mean fluorescence intensity; SOD, superoxide dismutase; MDA, malonaldehyde; AQP3, Aquaporin 3.
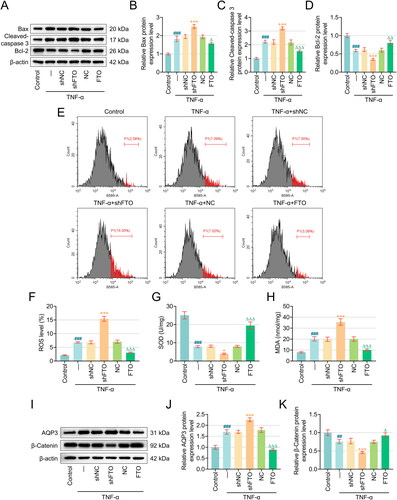
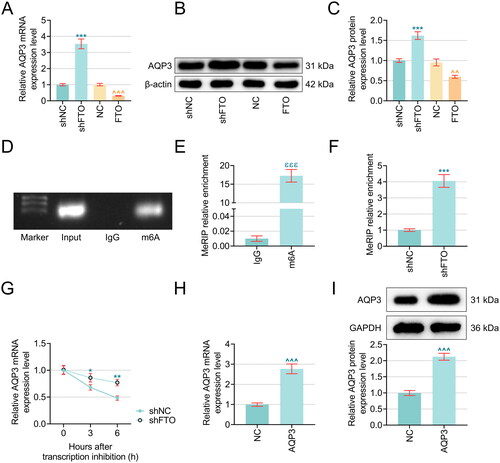
Figure 3. FTO negatively mediated AQP3 level in RTECs in an m6A-depenent manner and detriminished AQP3 stability. (A–C) The possible interaction between FTO and AQP3 was investigated based on the results from quantitative real-time PCR and western blot. β-actin was the housekeeping control. (D–E) Agarose gel electrophoresis (D) and MeRIP (E) were implemented to reveal the presence of AQP3 m6A modification. (F) MeRIP was carried out again to reveal the impact of FTO silencing on AQP3 m6A modification. (G) The results from mRNA stability assay addressing the effects of FTO silencing on the stability of AQP3 in PTECs using Actinomycin D for 0, 3 and 6 hours. β-actin was the housekeeping control. (H–I) Validation on AQP3 overexpression plasmid transfection efficiency via quantitative real-time PCR And western blot. β-actin was the housekeeping control. All experiments were performed in independent triplicates, and the data are expressed as mean ± standard deviation (n = 3). ^^p <0.01, ***p or ^^^p or ε ε εp < 0.001. * vs. shNC, ε vs. IgG; ^ vs. NC. Abbreviations: m6A, N6-methyladenosine; MeRIP, Methylated RNA immunoprecipitation.
3.2. Overexpression of FTO reversed TNF-α-induced effects on cellular damage and AQP3/β-catenin axis in PTECs, while FTO knockdown did conversely
Subsequently, flow cytometry (equipped with a DCFH-DA probe) and quantification of SOD and MDA contents in TNF-α-induced PTECs were performed. Exposure to TNF-α led to elevated DCFH-DA (FITC) MFI (which was proportional to ROS content) and MDA content, yet diminished SOD levels (, p < .001). The subsequent intervention with FTO-specific overexpression plasmid and shRNA suggested that FTO overexpression decreased the DCFH-DA (FITC) MFI and MDA content and enhanced the generation of SOD in TNF-α-induced PTECs (, p < .001), whereas FTO knockdown worsened the effects of TNF-α on increasing DCFH-DA (FITC) MFI and MDA content and reducing SOD content in PTECs (, p < .001).
Considering the crucial effects of AQP3 and the Wnt signaling pathway in AKI, we quantified the protein expression levels of AQP3 and the relevant pathway-related protein β-catenin by western blotting. Corresponding results suggested that the protein expression of both AQP3 and β-catenin in PTECs following TNF-α exposure was upregulated and downregulated, respectively (, p < .001). The overexpression of FTO further diminished the expression of AQP3 and promoted the expression of β-catenin in TNF-α-induced PTECs (, p < .001); however, inverse results were observed in these cells following the silencing of FTO (, p < .05).
3.3. FTO negatively modulated AQP3 level in RTECs in an m6A-dependent manner and compromised AQP3 stability
Since FTO has already been predicted to be an m6A demethylase of AQP3 in the RM2 target database, we sought to investigate the possible interaction between FTO and AQP3. The expression level of AQP3 following the overexpression or silencing of FTO was quantified again in PTECs, which indicated that FTO overexpression evidently reduced AQP3 levels (, p < .001), whereas its silencing produced contrary results to promote AQP3 expression in PTECs (, p < .001). In light of this, we examined whether m6A modification exists in AQP3, and an increased enrichment of m6A was observed (, p < .001). FTO silencing also promoted m6A enrichment (, p <.001). In addition, the results from the mRNA stability assay suggested that FTO silencing could evidently slow the downward trend in AQP3 expression levels in PTECs to promote the stability of AQP3 (, p <.05).
3.4. AQP3 overexpression neutralized the effects of FTO upregulation on the viability and apoptosis of TNF-α-induced PTECs
During this phase, we investigated the interaction between AQP3 and FTO. Accordingly, we tested the transfection efficiency of AQP3 overexpression plasmid, and the upward trend in AQP3 levels suggested the success of transfection (, p < .001).
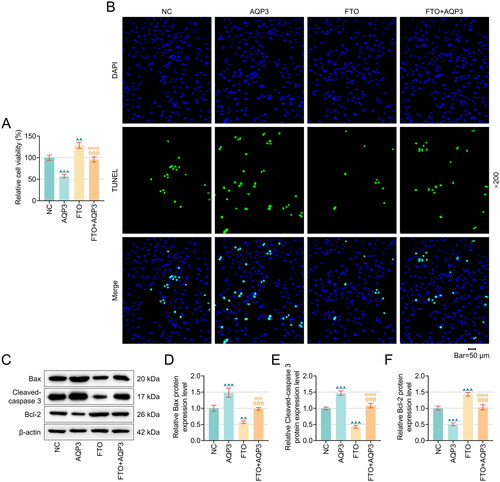
The results from rescue assays showed that FTO overexpression promoted viability and diminished green fluorescence in TNF-α-induced PTECs (, p < .01), while AQP3 upregulation produced contrary results abrogated the protective effects of FTO on TNF-α-induced PTECs (, p < .001). Furthermore, apoptosis-related proteins were detected by using western blot, and the result indicated that FTO overexpression decreased the Bax, Cleaved-caspase 3 protein level and increased Bcl-2 protein level in TNF-α-induced PTECs, while AQP3 overexpression produced contrary results and reversed the effect of FTO overexpression (, p < .001).
Figure 4. AQP3 overexpression neutralized the effects of FTO overexpression on the TNF-α-induced PTECs viability and apoptosis. (A–B) The results from CCK-8 (A) and TUNEL staining assays (B) were summarized to reveal the interplay between AQP3 and FTO in TNF-α-induced PTECs. Magnification: 200 times. Scale bar = 50 µm. (C–F) The expression of Bax, Cleaved-caspase 3 and Bcl-2 was detected by western blot. All experiments were performed in independent triplicates, and the data are expressed as mean ± standard deviation (n = 3). ^^p or ω ωp < .01. ^^^p or θ θ θp or ω ω ωp < .001. ^ vs. NC; θ vs. AQP3; ω vs. FTO.
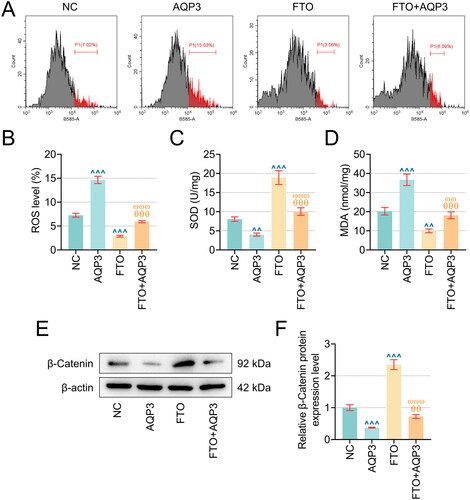
3.5. AQP3 overexpression counteracted the effects of FTO upregulation on PTECs damage and β-catenin protein expression in TNF-α-induced PTECs
In addition, ROS generation and SOD and MDA content in TNF-α-induced PTECs overexpressing FTO and/or AQP3 were quantified. It was shown in TNF-α-induced PTECs that FTO overexpression could diminish the levels of ROS and MDA and enhance the level of SOD (, p < .01), while AQP3 upregulation enhanced the generation of ROS and MDA yet suppressed the production of SOD (, p < .01). Furthermore, the protein expression of β-catenin in TNF-α-induced PTECs overexpressing FTO and/or AQP3 was calculated using western blotting. FTO overexpression promoted β-catenin protein expression (, p < .001), whereas AQP3 overexpression resulted in decreased levels of β-catenin (, p < .001). Besides, it should be noted that the effects of FTO overexpression on the aforementioned indices in TNF-α-induced PTECs were all reversed following the upregulation of AQP3 (, p < .01).
Figure 5. AQP3 overexpression cancelled the effects of FTO overexpression in TNF-α-induced PTECs on PTECs damage and β-Catenin protein expression. (A–B) Flow cytometry (equipped with a DCFH-DA probe) was adopted to assess ROS generation in TNF-α-induced PTECs with FTO and/or AQP3 overexpression. (C–D) Relevant quantification on SOD and MDA contents in TNF-α-induced PTECs with intervention of FTO and/or AQP3 overexpression. (E) Representative protein bands displaying β-Catenin protein expressions in TNF-α-induced PTECs with intervention of FTO and/or AQP3 overexpression based on western blotting. (F) Quantified AQP3 protein expression in TNF-α-induced PTECs with FTO and/or AQP3 overexpression based on western blotting. β-actin was the housekeeping control. All experiments were performed in independent triplicates, and the data are expressed as mean ± standard deviation (n = 3). ^^p or θ θp or ω ωp < 0.01. ^^^p or θ θ θp or ω ω ωp < 0.001. ^ vs. NC; θ vs. AQP3; ω vs. FTO.
4. Discussion
FTO is involved in the development of many metabolic diseases [Citation32]. FTO expression was increased in clear cell renal cell carcinoma compared with normal renal tissue [Citation33]. And previous study showed that inhibition of FTO expression can inhibit palmitic acid-induced inflammatory response of cardiomyocytes [Citation34]. We found that FTO silencing further inhibits TNF-α-inhibited cell viability and promotes apoptosis. Besides, we found that FTO silencing increased the level of ROS and MDA, decreased the level of SOD. Under normal physiological conditions, these substances remain in homeostasis due to the removal of dead cells and metabolic waste. However, in an injured state, this balance is disrupted and oxidative stress occurs [Citation35]. And this indicated that FTO silencing leads to the accumulation of ROS and MDA promoting further cell damage and FTO overexpression reversed this. However, how FTO regulates cell damage remains to be explored. Further, we found that FTO silence promotes AQP3 expression. In I/R mice, loss of AQP3 exacerbates kidney damage by increasing apoptosis and inhibiting MAPK signaling pathways [Citation36]. And we also found that AQP3 overexpression decreased the cell viability and increase cell apoptosis, which reversed the effects of FTO overexpression on cell viability and apoptosis, as well as the level of ROS, SOD and MDA. However, how FTO regulates AQP3 is still elusive.
Interestingly, FTO is an m6A demethylase mediating ∼5-10% of m6A demethylation, which can reverse and control the methylation-dependent process [Citation37]. While linking FTO and AKI, a prior investigation suggested that meclofenamic acid worsens cisplatin-induced AKI by inhibiting FTO-mediated m6A RNA abrogation [Citation24]. However, the relevant mechanisms involved have not yet been fully addressed. To reveal the downstream node via which FTO acts to exert its alleviative effects, the MeRIP assay was implemented as needed to determine whether AQP3 is the target of m6A demethylase FTO. And we found that m6A modification is present in AQP3. Further, FTO knockout increases m6A modification in AQP3. The association between AQPs and m6A modifications was addressed in a previous study. In detail, m6A-mediated overexpression of long non-coding RNA AC008440.5 promotes osteoarthritis progression via the microRNA-328-3p/AQP1/ANKH axis [Citation38]. However, the mechanism of m6A modification in AQP3 is still unknown.
Further, additional research has filled the blank with regard to the manipulation of both m6A demethylase FTO and AQP3 in the Wnt pathway [Citation39,Citation40]. These discoveries, combined with research emphasizing the roles of m6A modification and other AQPs in modulating the Wnt pathway [Citation41, Citation42], have led us to wonder whether the Wnt pathway is involved in the mechanism through which the FTO/AQP3 axis acts on TNF-α-modeled PTECs. The Wnt pathway is central to many developmental and disease-related process [Citation43]. This pathway is often repressed in adulthood; however, it can be reactivated during organ injury and regeneration [Citation44]. Transient Wnt activation can stimulate tissue regeneration following AKI, while uncontrolled and sustained Wnt signaling leads to adverse outcomes during AKI [Citation45]. This is dependent on the magnitude and duration of the activation [Citation9]. And our results have shown that FTO overexpression leads to the activation of Wnt signaling in modeled PTECs, whereas AQP3 overexpression causes inactivation, as evidenced by the increased or decreased expression of β-catenin (which can be controlled by Wnt to shape the outcome of Wnt signaling [Citation46]) in these cells. These preliminary results suggest that Wnt signaling may be one of the signaling pathways through which FTO/AQP3 acts to attenuate AKI. Whether more pathways are involved will also be the focus of our future research.
Besides, there are some limitations in this study. First, more experiments are need to verify the m6A modifications effect on TNF-α-induced SAP-induced AKI; Second these results were solely deduced based on an in-vitro PTECs model, and an equivalent in-vivo AP-induced AKI model is required for validation and consolidation.
5. Conclusion
Collectively, the current study revealed the involvement of the m6A demethylase FTO and its possible effector AQP3 in AP-induced AKI. The relevant data support that FTO overexpression attenuates TNF-α-induced damage of PTECs by targeting AQP3 to affect its stability in an m6A-dependent manner. We hope that these findings can provide novel clues concerning the involvement of FTO and AQP3 in AKI and some therapeutic targets for the management of AP-induced AKI in clinical practice.
Authors’ contributions
Substantial contributions to conception and design: Xinghui Li and Qi Liang
Data acquisition, analysis, and interpretation: Lu Liu, Shujun Chen, Yong Li, and Yu Pu
Drafting the article or critically revising it for important intellectual content: Xinghui Li, Qi Liang, Lu Liu, Shujun Chen, Yong Li, and Yu Pu.
Final approval of the version to be published: All authors.
Agreement to be accountable for all aspects of the work in ensuring that questions related to the accuracy or integrity of the work are appropriately investigated and resolved
Disclosure statement
No potential conflict of interest was reported by the author(s).
Data availability statement
The analyzed datasets generated during the study are available from the corresponding author upon reasonable request.
Additional information
Funding
References
- Beyer G, Hoffmeister A, Lorenz P, et al. Clinical practice guideline—acute and chronic pancreatitis. Dtsch Arztebl Int. 2022;119:1–11.
- Nassar TI, Qunibi WY. AKI associated with acute pancreatitis. Clin J Am Soc Nephrol. 2019;14(7):1106–1115. doi: 10.2215/CJN.13191118.
- Kellum JA, Romagnani P, Ashuntantang G, et al. Acute kidney injury. Nat Rev Dis Primers. 2021;7(1):52. doi: 10.1038/s41572-021-00284-z.
- Wang Y, Liu K, Xie X, et al. Potential role of imaging for assessing acute pancreatitis-induced acute kidney injury. Br J Radiol. 2021;94(1118):20200802. doi: 10.1259/bjr.20200802.
- Pickkers P, Darmon M, Hoste E, et al. Acute kidney injury in the critically ill: an updated review on pathophysiology and management. Intensive Care Med. 2021;47(8):835–850. doi: 10.1007/s00134-021-06454-7.
- Ma D, Li C, Jiang P, et al. Inhibition of ferroptosis attenuates acute kidney injury in rats with severe acute pancreatitis. Dig Dis Sci. 2021;66(2):483–492. doi: 10.1007/s10620-020-06225-2.
- Zhang XX, Wang HY, Yang XF, et al. Alleviation of acute pancreatitis-associated lung injury by inhibiting the p38 mitogen-activated protein kinase pathway in pulmonary microvascular endothelial cells. World J Gastroenterol. 2021;27(18):2141–2159. doi: 10.3748/wjg.v27.i18.2141.
- Schönfeld P, Wieckowski MR, Lebiedzińska M, et al. Mitochondrial fatty acid oxidation and oxidative stress: lack of reverse electron transfer-associated production of reactive oxygen species. Biochim Biophys Acta. 2010;1797(6-7):929–938. doi: 10.1016/j.bbabio.2010.01.010.
- Zhou D, Tan RJ, Fu H, et al. Wnt/β-catenin signaling in kidney injury and repair: a double-edged sword. Lab Invest. 2016;96(2):156–167. doi: 10.1038/labinvest.2015.153.
- Chatterjee S, Sil PC. ROS-influenced regulatory cross-talk with wnt signaling pathway during perinatal development. Front Mol Biosci. 2022;9:889719. doi: 10.3389/fmolb.2022.889719.
- Xie H, Jing Y, Xia J, et al. Aquaporin 3 protects against lumbar intervertebral disc degeneration via the wnt/β-catenin pathway. Int J Mol Med. 2016;37(3):859–864. doi: 10.3892/ijmm.2016.2470.
- Xing L, Wen JG, Frøkiær J, et al. Ontogeny of the mammalian kidney: expression of aquaporins 1, 2, 3, and World J Pediatr. 2014;10(4):306–312. doi: 10.1007/s12519-014-0508-7.
- Wang W, Geng X, Lei L, et al. Aquaporin-3 deficiency slows cyst enlargement in experimental mouse models of autosomal dominant polycystic kidney disease. Faseb J. 2019;33(5):6185–6196. doi: 10.1096/fj.201801338RRR.
- Xie R, Wang J, Yao Y, et al. Fluid resuscitation via the rectum ameliorates hemodynamic disorders through adjusting aquaporin expression in an experimental severe acute pancreatitis model. Exp Ther Med. 2019;17(1):437–443. doi: 10.3892/etm.2018.6934.
- Xu Y, Yao H, Wang Q, et al. Aquaporin-3 attenuates oxidative stress-induced nucleus pulposus cell apoptosis through regulating the P38 MAPK pathway. Cell Physiol Biochem. 2018;50(5):1687–1697. doi: 10.1159/000494788.
- Kim NH, Kim HJ, Lee AY. Aquaporin-3 downregulation in vitiligo keratinocytes increases oxidative stress of melanocytes. Biomol Ther (Seoul). 2023;31(6):648–654. doi: 10.4062/biomolther.2023.112.
- Ni L, Bai R, Zhou Q, et al. The correlation between ferroptosis and m6A methylation in patients with acute kidney injury. Kidney Blood Press Res. 2022;47(8):523–533. doi: 10.1159/000524900.
- Ni WJ, Lu H, Ma NN, et al. RNA N(6) -methyladenosine modifications and potential targeted therapeutic strategies in kidney disease. Br J Pharmacol. 2023;180(1):5–24. doi: 10.1111/bph.15968.
- Garbo S, Zwergel C, Battistelli C. m6A RNA methylation and beyond - the epigenetic machinery and potential treatment options. Drug Discov Today. 2021;26(11):2559–2574. doi: 10.1016/j.drudis.2021.06.004.
- Jiang X, Liu B, Nie Z, et al. The role of m6A modification in the biological functions and diseases. Signal Transduct Target Ther. 2021;6:74.
- You Y, Fu Y, Huang M, et al. Recent advances of m6A demethylases inhibitors and their biological functions in human diseases. Int J Mol Sci. 2022;23:5815.
- Azzam SK, Alsafar H, Sajini AA. FTO m6A demethylase in obesity and cancer: implications and underlying molecular mechanisms. Int J Mol Sci. 2022;23:3800.
- Wu J, Yuan XH, Jiang W, et al. Genome-wide map of N(6)-methyladenosine circular RNAs identified in mice model of severe acute pancreatitis. World J Gastroenterol. 2021;27(43):7530–7545. doi: 10.3748/wjg.v27.i43.7530.
- Zhou P, Wu M, Ye C, et al. Meclofenamic acid promotes cisplatin-induced acute kidney injury by inhibiting fat mass and obesity-associated protein-mediated m(6)a abrogation in RNA. J Biol Chem. 2019;294(45):16908–16917. doi: 10.1074/jbc.RA119.011009.
- Xiao J, Chen W, Lu Y, et al. Crosstalk between peroxisome proliferator-activated receptor-γ and mineralcorticoid receptor in TNF-α activated renal tubular cell. Inflamm Res. 2015;64(8):603–614. doi: 10.1007/s00011-015-0838-5.
- Yin X, Xue R, Wu J, et al. PINK1 ameliorates acute-on-chronic liver failure by inhibiting apoptosis through mTORC2/AKT signaling. Cell Death Discov. 2022;8(1):222. doi: 10.1038/s41420-022-01021-5.
- Caslin HL, Taruselli MT, Haque T, et al. Inhibiting glycolysis and ATP production attenuates IL-33-mediated mast cell function and peritonitis. Front Immunol. 2018;9:3026. doi: 10.3389/fimmu.2018.03026.
- Wang CY, Lin MH, Su HT. A method for measuring RNA N 6-methyladenosine modifications in cells and tissues. J Vis Exp. 2016;2016(118):54672.
- Huang J, Sun W, Wang Z, et al. FTO suppresses glycolysis and growth of papillary thyroid cancer via decreasing stability of APOE mRNA in an N6-methyladenosine-dependent manner. J Exp Clin Cancer Res. 2022;41(1):42. doi: 10.1186/s13046-022-02254-z.
- Xu Y, Zhou J, Li L, et al. FTO-mediated autophagy promotes progression of clear cell renal cell carcinoma via regulating SIK2 mRNA stability. Int J Biol Sci. 2022;18(15):5943–5962. doi: 10.7150/ijbs.77774.
- Livak KJ, Schmittgen TD. Analysis of relative gene expression data using real-time quantitative PCR and the 2(-Delta Delta C(T)) method. Methods. 2001;25(4):402–408. doi: 10.1006/meth.2001.1262.
- Sun L, Ling Y, Jiang J, et al. Differential mechanisms regarding triclosan vs. bisphenol a and fluorene-9-bisphenol induced zebrafish lipid-metabolism disorders by RNA-Seq. Chemosphere. 2020;251:126318. doi: 10.1016/j.chemosphere.2020.126318.
- Zhang D, Wornow S, Peehl DM, et al. The controversial role and therapeutic development of the m6A demethylase FTO in renal cell carcinoma. Transl Oncol. 2022;25:101518. doi: 10.1016/j.tranon.2022.101518.
- Yu Y, Pan Y, Fan Z, et al. LuHui derivative, a novel compound that inhibits the fat mass and obesity-associated (FTO), alleviates the inflammatory response and injury in hyperlipidemia-induced cardiomyopathy. Front Cell Dev Biol. 2021;9:731365. doi: 10.3389/fcell.2021.731365.
- Ge MH, Tian H, Mao L, et al. Zinc attenuates ferroptosis and promotes functional recovery in contusion spinal cord injury by activating Nrf2/GPX4 defense pathway. CNS Neurosci Ther. 2021;27(9):1023–1040. doi: 10.1111/cns.13657.
- He J, Yang B. Aquaporins in renal diseases. Int J Mol Sci. 2019;20:366.
- Shi H, Wei J, He C. Where, when, and how: context-dependent functions of RNA methylation writers, readers, and erasers. Mol Cell. 2019;74(4):640–650. doi: 10.1016/j.molcel.2019.04.025.
- Yang J, Zhang M, Yang D, et al. m(6)A-mediated upregulation of AC008 promotes osteoarthritis progression through the miR-328-3p–AQP1/ANKH axis. Exp Mol Med. 2021;53(11):1723–1734. doi: 10.1038/s12276-021-00696-7.
- Zhang L, Wan Y, Zhang Z, et al. FTO demethylates m6A modifications in HOXB13 mRNA and promotes endometrial cancer metastasis by activating the WNT signalling pathway. RNA Biol. 2021;18(9):1265–1278. doi: 10.1080/15476286.2020.1841458.
- Liu C, Liu L, Zhang Y, et al. Molecular mechanism of AQP3 in regulating differentiation and apoptosis of lung cancer stem cells through wnt/GSK-3β/β-catenin pathway. J Buon. 2020;25:1714–1720.
- Song N, Cui K, Zhang K, et al. The role of m6A RNA methylation in cancer: implication for nature products anti-cancer research. Front Pharmacol. 2022;13:933332. doi: 10.3389/fphar.2022.933332.
- Wang W, Li F, Sun Y, et al. Aquaporin-1 retards renal cyst development in polycystic kidney disease by inhibition of wnt signaling. Faseb J. 2015;29(4):1551–1563. doi: 10.1096/fj.14-260828.
- Rim EY, Clevers H, Nusse R. The wnt pathway: from signaling mechanisms to synthetic modulators. Annu Rev Biochem. 2022;91(1):571–598. doi: 10.1146/annurev-biochem-040320-103615.
- Meng P, Zhu M, Ling X, et al. Wnt signaling in kidney: the initiator or terminator? J Mol Med (Berl). 2020;98(11):1511–1523. doi: 10.1007/s00109-020-01978-9.
- Schunk SJ, Floege J, Fliser D, et al. WNT-β-catenin signalling - a versatile player in kidney injury and repair. Nat Rev Nephrol. 2021;17(3):172–184. doi: 10.1038/s41581-020-00343-w.
- Clevers H, Nusse R. Wnt/β-catenin signaling and disease. Cell. 2012;149(6):1192–1205. doi: 10.1016/j.cell.2012.05.012.