
Abstract
Background
The analytical renal pathology system (ARPS) based on convolutional neural networks has been used successfully in native IgA nephropathy (IgAN) patients. Considering the similarity of pathologic features, we aim to evaluate the performance of the ARPS in allograft IgAN patients and broaden its implementation.
Methods
Biopsy-proven allograft IgAN patients from two different centers were enrolled for internal and external validation. We implemented the ARPS to identify glomerular lesions and intrinsic glomerular cells, and then evaluated its performance. Consistency between the ARPS and pathologists was assessed using intraclass correlation coefficients. The association of digital pathological features with clinical and pathological data was measured. Kaplan-Meier survival curve and cox proportional hazards model were applied to investigate prognosis prediction.
Results
A total of 56 biopsy-proven allograft IgAN patients from the internal center and 17 biopsy-proven allograft IgAN patients from the external center were enrolled in this study. The ARPS was successfully applied to identify the glomerular lesions (F1-score, 0.696–0.959) and quantify intrinsic glomerular cells (F1-score, 0.888–0.968) in allograft IgAN patients rapidly and precisely. Furthermore, the mesangial hypercellularity score was positively correlated with all mesangial metrics provided by ARPS [Spearman’s correlation coefficient (r), 0.439–0.472, and all p values < 0.001]. Besides, a higher allograft survival was noticed among patients in the high-level groups of the maximum and ratio of endothelial cells, as well as the maximum and density of podocytes.
Conclusion
We propose that the ARPS could be implemented in future clinical practice with outstanding capability.
Introduction
Deep learning, a subset of artificial intelligence (AI), is dedicated to training artificial neural networks to recognize intricate patterns within extensive datasets. It draws inspiration from the complex operations of the human brain, employing algorithms that enhance the processing and analysis of intricate data structures [Citation1]. Consequently, deep learning demonstrates exceptional problem-solving capabilities, surpassing traditional machine learning techniques. Recently, deep learning has gained significant popularity in the medical domain, with a notable presence in the field of nephrology and pathology [Citation2–4]. In renal pathology, extensive endeavors have been undertaken to precisely locate glomeruli and glomerular structures via deep learning [Citation5–9]. Notably, the application of convolutional neural networks (CNNs) has yielded promising outcomes, leading to their widespread utilization for auxiliary diagnosis via whole-slide image analysis [Citation10–12]. In our previous studies, a CNN-based analytic renal pathology system (ARPS) was established to locate the glomeruli, identify the glomerular lesions, and quantify the glomerular intrinsic glomerular cells in cases of native immunoglobulin A nephropathy (IgAN) [Citation13]. Rates of 93.1% accuracy and 94.9% recall were achieved on average for the location of glomeruli, and the total Cohen’s kappa for glomerular lesion classification was 0.912 [95% confidence interval (CI), 0.892–0.932]. Remarkably, in the identification of three kinds of glomerular intrinsic glomerular cells, the ARPS reached a distinguished performance of 92.2% accuracy, which surpassed the approximately 5%–11% average accuracy of junior pathologists. Additionally, the ARPS offered significant convenience by swiftly estimating the number of intrinsic glomerular cells in native IgAN, requiring only 0.6 s for analysis—approximately 1/50 to 1/100 of the time junior pathologists typically need [Citation13].
IgAN is one of the most common primary glomerulonephritis types worldwide and is responsible for a large proportion of end-stage renal disease (ESRD) [Citation14,Citation15]. Approximately 15%-20% of IgAN patients will reach ESRD within 10 years and finally receive renal replacement therapy or kidney transplantation [Citation16]. Even after transplantation, IgAN can still reappear. According to the diagnosis of native and donor kidney biopsy, post-transplant IgAN is classified as recurrent IgAN, de novo IgAN, IgAN of unknown origin and transmitted latent IgAN. Among them, recurrent IgAN accounts for the predominant proportion, but its reported incidence varies considerably from 9% to 61%, mainly due to diverse biopsy protocols and length of follow-up [Citation17]. However, most data from native and donor kidney biopsies are unavailable considering the untimely detection of native diseases and transplant surgery in other medical centers. Consequently, the definition of allograft IgAN was proposed in this study. Similar to native IgAN, the pathology of allograft IgAN usually presents with only minor histologic abnormalities in the early era, but mesangial and endocapillary hypercellularity and crescents can still exist. Up to 40% of patients with recurrent IgAN have been reported to have graft loss [Citation18].
The original Oxford Classification known as MEST was proposed by expert renal pathologists to assist in clinical practice in native IgAN in 2009 [Citation19,Citation20]. In 2016, it was updated as the MEST-C scoring system, which is the gold standard for IgAN clinical practice [Citation21]. Subsequently, the clinical importance of the Oxford classification in both native and allograft IgAN was validated [Citation22–26]. Considering the outstanding performance of the ARPS in native IgAN patients, we investigated whether the ARPS could achieve the same performance in allograft IgAN as well and further explored the correlation among the results obtained from the ARPS, clinical data, pathological features and prognostic indicators in this study.
Materials and Methods
Patient enrollment
Biopsy-proven allograft IgAN patients at the National Clinical Research Center of Kidney Diseases in Jinling Hospital (internal validation center) between January 2016 and April 2020 and at the First Affiliated Hospital of Zhejiang University (external validation center) between January 2022 and December 2022 were enrolled in the study. The inclusion criteria were as follows: 1) age ≥ 18 years and 2) ≥ 5 countable glomeruli on slides stained by periodic acid-Schiff (PAS). The countable glomeruli were those with a sum of intrinsic glomerular cells ≥ 50. The exclusion criteria were as follows: 1) patients with concurrent acute or chronic rejection; and 2) patients comorbid with other renal diseases, such as membranous nephropathy, diabetic nephropathy, and BK virus-associated nephropathy. This study was approved by the Ethics Committee of Jinling Hospital (2022DZKY-055-01) and conducted in strict accordance with the tenets of the Declaration of Helsinki.
Relevant information and endpoint events
General information and laboratory indicators when they were diagnosed with IgAN by renal allograft biopsy and follow-up outcomes were collected according to the medical records of patients at the internal validation center. Among them, native and donor biopsy data were also included. Patients’ demographic characteristics and clinical data were collected retrospectively from the electronic medical record system within one month of allograft biopsy, mostly within 1 week. The estimated glomerular filtration rate (eGFR) was calculated by the chronic kidney disease epidemiology collaboration (CKD-EPI) equation [Citation27]. Follow-up was discontinued on February 28, 2023, or when endpoint events occurred. The endpoint was defined as the eGFR of renal transplant recipients being <15/min/1.73 m2 for more than 3 months or the patient receiving regular renal replacement therapy again.
Digital slide preparation
Allograft biopsy specimens were routinely processed by standard procedures for light, immunofluorescence (IF), and electron microscopy (EM). The tissue for light microscopy was serially sectioned (2 μm) and stained using hematoxylin-eosin (H&E), PAS, methenamine-silver and Masson trichrome. SV40 was assessed immunohistochemically using a Leica BOND-MAX auto Stainer (Leica Microsystems). The tissue for IF and EM was processed according to conventional procedures. The MEST-C scores of each patient were evaluated by 2 senior pathologists with reference to the Oxford Classification [Citation21]. Acute or chronic rejection was diagnosed by 2 experienced pathologists, referring to the Banff 2019 Kidney Meeting Report [Citation28]. In addition, the number of global glomerular sclerosis, segmental glomerular sclerosis and crescents were also evaluated by three senior pathologists. Additionally, glomerular lesion types and internal glomerular structures identified by the ARPS were verified by 2 experienced pathologists. To compare consistency among different pathologists, each glomerular lesion was evaluated by 3 junior pathologists. Discrepancies in scoring and diagnosis were resolved through discussion until an agreement was reached.
ScanScope® AT Turbo Scanner (Leica, Wetzlar, Germany) was applied to scan the PAS-stained slides of allograft IgAN patients under 40× magnification at a resolution of 0.25 μm/pixel. The types of glomerular lesions were automatically located and measured by the ARPS, including global glomerular sclerosis (GS), segmental glomerular sclerosis (SS), crescents (C), and none of the above (NOA). Intrinsic glomerular cells containing mesangial cells (M), endothelial cells (E) and podocytes (P) and the glomerular area and mesangial area in the NOA glomerulus were also automatically detected and measured by the ARPS.
Whole slide image deep-learning analysis
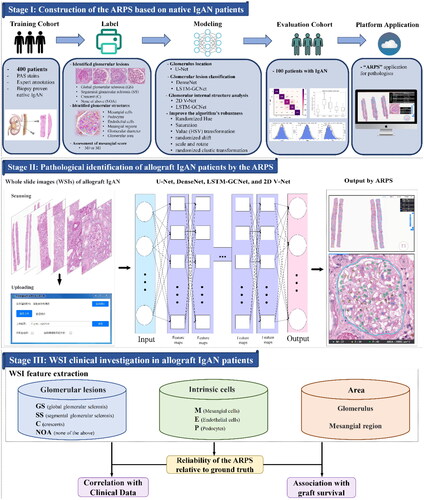
Our workflow was divided into three stages: stage I is implementing the ARPS based on native IgAN patients, stage II is allograft tissue compartment recognition by the ARPS, and stage III includes whole slide image (WSI) feature extraction and relevant analysis based on clinical and graft survival data (the details are depicted in and demonstrated in Supplementary Methods I). Briefly, at stage I, to establish the ARPS, a dataset of 41,000 patches collected from 400 native IgAN patients was included for the location and identification of glomerular lesions, with 30,000 patches used for training, 5,000 for validation, and 5,000 for testing. Importantly, these patches were extracted from different slides to ensure robustness and generalizability [Citation13]. To evaluate the localization of glomeruli, we employed 100 human slides (60 for validation and 40 for testing). Moreover, for the identification of intrinsic glomerular cells, we selected 460 images of glomeruli (about 70,000 cells) from NOA samples, with 240 used for training, 60 for validation, and 160 for testing. At stage II, PAS-stained slides of allograft IgAN patients from the two medical centers were scanned and then uploaded. Then, the ARPS identified and located the glomerular lesion types and internal glomerular structures using multiple algorithms and outputted the results. In particular, U-Net and Dense Net were introduced to locate the glomeruli and distinguish easily classified glomerular lesions such as GS, respectively. To classify SS, NOA and C, LSTM-GCNet was utilized based on the internal glomerular characteristics. In addition, 2D V-Net was implemented to predict intrinsic glomerular cells [Citation13]. At stage III, the reliability of the ARPS relative to ground truth (evaluated by 2 senior pathologists) in identifying glomerular lesion types (including GS, SS, C and NOA) and intrinsic glomerular cells (including M, E and P) was evaluated. Then, the relationship of WSI features extracted by the ARPS (including glomerular lesion types, intrinsic glomerular cells, glomerular area and mesangial area) with clinical data and graft survival were investigated only in patients from the internal validation center.
Figure 1. Workflow of our study. At stage I, the analytic renal pathology system (ARPS) was established. A dataset consisting of 41,000 patches obtained from 400 native immunoglobulin A nephropathy (IgAN) patients was utilized, with the patches carefully labeled for the location and identification of glomeruli lesions (GS, SS, C and NOA). Moreover, for the identification of intrinsic glomerular cells, we selected and labeled 460 images of glomeruli (about 70 000 cells, including M, E and P) from NOA samples. The ARPS system exhibited exceptional performance in accurately categorizing glomerular lesion types and intrinsic glomerular cells (Citation13). Stage II is allograft tissue compartment recognition, where periodic acid-Schiff (PAS) slides of allograft IgAN patients were scanned and then uploaded. After that, the ARPS identified the glomerular lesions and internal glomerular structures using U-Net, DenseNet, LSTM-GCNet and 2D V-Net. Stage III is the whole-slide image (WSI) clinical investigation, where we evaluated the reliability of the ARPS relative to ground truth (evaluated by a pathologist) in identifying glomerular lesions and internal glomerular structures. Meanwhile, the glomerular area, mesangial area, glomerular lesions (SS, GS, C and NOA) and intrinsic glomerular cells (M, E and P) automatically identified by the ARPS were further examined through association with clinical data and post-transplantation graft survival.
Definition of relevant indicators
By using the confusion matrix, we evaluated the performance of the ARPS on identifying glomerular lesion types and intrinsic glomerular cells relative to ground truth by 2 specialized pathologists, including accuracy, precision, recall, specificity, F1-score, Area Under the Curve-Receiver Operating Characteristic (AUC-ROC) and Cohen’s Kappa coefficients (Supplementary Methods I) [Citation13,Citation29]. Notably, PAS-stained slides from the two medical centers were used for internal validation and external validation. These results were all evaluated by 2 experienced pathologists for their reliability. The ratio of each glomerular lesion type and the average proportion of mesangial area to the total glomerular area were calculated in each patient from the internal validation center. In addition, the maximum number, average density (intrinsic glomerular cell number/glomerular area), and average ratio (intrinsic glomerular cell number/total intrinsic glomerular cell number) of each intrinsic glomerular cell in the countable NOA glomeruli were also calculated (the details are depicted in Supplementary Methods II).
Statistical analysis
The data were analyzed by SPSS version 25.0 and X-tile Software. Then, they were plotted in GraphPad Prism 9. Categorical data are presented as counts and percentages. Continuous variables are presented as the mean ± standard deviation (SD) or median with the interquartile range (IQR). Consistency between the ARPS and pathologists was assessed based on the value of intraclass correlation coefficients (ICCs) and Cohen’s Kappa coefficients. Additionally, ICCs were calculated to evaluate consistency among three different junior pathologists in identifying glomerular lesions. The AUC-ROC was determined for each glomerular lesion type and intrinsic cell identified by the ARPS. The association of digital pathological features with clinical and pathological data was measured by Pearson’s correlation or Spearman’s correlation. In addition, we evaluated the correlation between clinicopathological features and allograft outcomes with two methods. (1) X-tile method and Kaplan–Meier survival curve. According to the optimal cutoff determined by X-tile software, we categorized the pathological features into high-level (> the optimal cutoff) and low-level (≤ the optimal cutoff) groups. Kaplan–Meier survival curves comparing the two groups were plotted, and the associated p value was calculated by the log-rank test. (2) Cox proportional hazards model. A univariate Cox proportional hazards model was used to estimate the hazard ratio (HR), confidence interval (CI), and Cox p value. Then, variables with a p value < .1 were included in the multivariate Cox proportional hazards model. All tests were two-sided. p < .05 was considered statistically significant.
Results
Demographic and general information
From the internal validation center, a total of 56 patients with biopsy-proven allograft IgAN were enrolled, and 43 of them were male (76.79%). The clinical information of these patients is shown in . Forty-two patients received kidneys from living relative donors, and the rest were from donation after cardiac death (DCD). Of the 56 patients, native and donor biopsy data were available in 10 and 8 patients, respectively. Among them, only one patient had both native and donor biopsy data. The median age at the time of allograft biopsy was 32 (IQR: 28, 39) years. Median values of patients’ serum creatinine and urinary protein were 1.44 (IQR: 1.18, 2.00) mg/dl and 0.76 (IQR: 0.43, 1.86) g/24h when they were confirmed as IgAN by allograft biopsy. According to the MEST-C scoring system of the Oxford classification, 17 (30.36%) patients with allograft IgAN were rated as M1(≥50% of the glomeruli with mesangial hypercellularity), 13 (23.21%) as E1(endocapillary hypercellularity present), 31 (55.36%) as S1(Segmental glomerulosclerosis or podocytopathic features present), 13 (23.21%) patients as T1-2 (tubular atrophy/interstitial fibrosis > 25%) and 22 (39.29%) as C1-2 (cellular/fibrocellular crescents present in a least 1 glomerulus). We also enrolled 17 IgAN patients proven by allograft biopsy from the external validation center.
Table 1. Demographic And clinical characteristics of patients with allograft IgA nephropathy (IgAN) from internal validation center.
Identification of glomerular lesion types by the ARPS
The pathological manifestations of IgAN after kidney transplantation are complex and varied. For internal validation, 2127 glomeruli were detected by the ARPS (), with 1555 NOA, 284 GS, 148 SS, 114 C, and 26 Neg1 (negative samples were regions excluding glomeruli). First, evaluation metrics of the ARPS identifying each glomerular lesion type were calculated () based on the confusion matrix (Table S1). Compared to the other glomerular lesion types (SS and C), the identification of NOA and GS was better (F1-score > 0.92) (). After that, ICC was introduced to evaluate the consistency between the ARPS and pathologists. We found outstanding reliability for NOA (ICCs = 0.929) and GS (ICCs = 0.875) and substantial reliability for SS (ICCs = 0.651), while the reliability for C was only moderate (ICCs = 0.547) (). Furthermore, the consistency between the ARPS and pathologists were superior to that among different junior pathologists in identifying glomerular lesion types ().
Figure 2. Identification of glomerular lesion types and intraglomerular structures in periodic acid–Schiff (PAS) slides from allograft IgAN patients by the analytic renal pathology system (ARPS). (A) A section of a whole slide image (WSI) from allograft IgAN patients. (B) Segmentation and location of glomerular lesion types in the WSI by the ARPS. Each glomerulus is categorized into global glomerular sclerosis (green), segmental glomerular sclerosis (yellow), crescents (red), and none of the above (blue). [
 ], the intrinsic glomerular cell was not identified and located; [
![Figure 2. Identification of glomerular lesion types and intraglomerular structures in periodic acid–Schiff (PAS) slides from allograft IgAN patients by the analytic renal pathology system (ARPS). (A) A section of a whole slide image (WSI) from allograft IgAN patients. (B) Segmentation and location of glomerular lesion types in the WSI by the ARPS. Each glomerulus is categorized into global glomerular sclerosis (green), segmental glomerular sclerosis (yellow), crescents (red), and none of the above (blue). [Display full size], the glomerular lesion was identified incorrectly. (C) A glomerulus (none of the above) in a WSI. (D) Intrinsic glomerular cell segmentation and identification, including mesangial cells (blue), endothelial cells (yellow), podocytes (green), and glomerulus boundary. [Display full size], the intrinsic glomerular cell was not identified and located; [Display full size], the intrinsic glomerular cell was identified incorrectly; [Display full size], other internal glomerular structure was misidentified as intrinsic glomerular cell. (E) Location of mesangial region and mesangial cells.](/cms/asset/bc04560b-bfac-43bb-8cc5-b75163a17930/irnf_a_2322043_f0002_c.jpg)
Figure 3. Metrics of the analytic renal pathology system (ARPS) on identifying glomerular lesions and intrinsic glomerular cells in allograft IgAN patients from the internal and external validation center. (A-B) Metrics of the ARPS on identifying glomerular lesions. (C-D) Metrics of the ARPS on identifying intrinsic glomerular cells. AUC-ROC, Area Under the Curve-Receiver Operating Characteristic; GS, global glomerular sclerosis; SS, segmental glomerular sclerosis; C, crescents; NOA, none of the above; M, mesangial cells; E, endothelial cells; P, podocytes. (E) Kappa agreement testing between the ARPS and a pathologist.
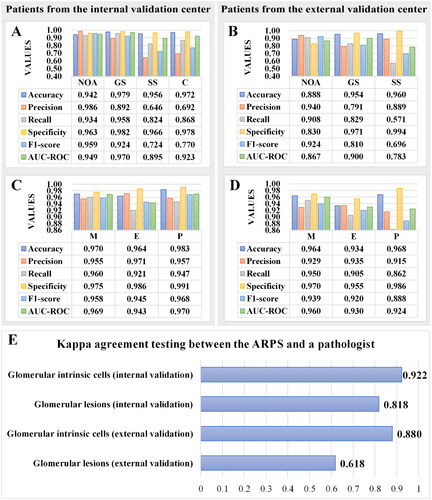
Table 2. ICCs Of glomerular lesions in different cohorts.
For external validation, 349 glomeruli were detected by the ARPS, with 261 NOA, 28 GS, 41 SS, 3 C, and 16 Neg1. According to the confusion matrix (Table S2), evaluation metrics of the ARPS identifying glomerular lesion types were calculated (). Notably, to avoid unnecessary interference with the results, the evaluation metrics of C in external validation were not calculated due to the lack of C lesions (Table S2). Generally, the ARPS performed relatively well in external validation (all F1-scores > 0.696), with F1-scores close to those of internal validation. Among the three types of glomerular lesions, the best performance of the ARPS was observed in identifying NOA (F1-score = 0.924), followed by GS (F1-score = 0.810) and then SS (F1-score = 0.696).
Moreover, Cohen’s Kappa coefficients were calculated to assess the agreement between the ARPS and a pathologist in both internal and external validation (). The results revealed that the ARPS exhibited excellent performance in internal validation for glomerular lesion identification (Kappa = 0.818), superior to that in external validation (Kappa = 0.618).
Performance of the ARPS in identifying intraglomerular structures
Initially, we randomly selected 129 NOA glomeruli (15,172 intrinsic glomerular cells, with 5391 M, 5153 E, 2646 P, 1982 Neg2, negative samples were other cells in NOA glomeruli) in patients from our center for internal validation and estimated the reliability of the ARPS to identify intrinsic glomerular cells with reference to the confusion matrix (Table S3). As shown in , the performance of the ARPS in identifying the three types of glomerular intrinsic glomerular cells was excellent, with all evaluation metrics above 0.945. We found that the ARPS identified P best, followed by M and E. Then, the ARPS was further applied to measure the population of each intrinsic glomerular cell, glomerular area, and mesangial area. Additionally, the maximum number, average density and ratio of each intrinsic glomerular cell, average proportion of mesangial area, etc., were calculated (Table S5). Furthermore, we calculated the average proportion of M, E and P (0.37: 0.38: 0.25) in NOA glomeruli from allograft IgAN patients (Figure S1), indicating that the number of E was the highest, followed by M and P.
Similarly, 2809 intrinsic glomerular cells (827 M, 1169 E, 414 P, 402 Neg2) of patients were identified by the ARPS for external verification (Table S4). The ARPS excelled in identifying the three types of glomerular intrinsic glomerular cells (all evaluation metrics > 0.888) (). We also found that the ARPS performed better in identifying M (F1-score = 0.939) and E (F1-score = 0.920) than P (F1-score = 0.888). In addition, we calculated Cohen’s Kappa coefficients to assess the agreement between the ARPS and a pathologist in identifying glomerular intrinsic glomerular cells (). The results showed excellent agreement in both internal (Kappa = 0.922) and external validation (Kappa = 0.880).
Correlation of intraglomerular characteristics measured by the ARPS with clinical and pathological data
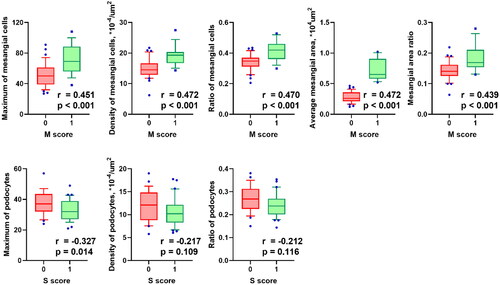
Both the mesangial hypercellularity score (M0 < 50%; M1 ≥ 50% of the glomeruli) in the Oxford classification and the mesangial features provided by the ARPS can reflect the hypercellularity of mesangial cells. Here, we examined the relationship between these 2 methods. Our data indicated that all digital features of the mesangial region (mesangial cell and area) were significantly correlated with mesangial hypercellularity scores in the Oxford classification (r > 0.43, and p < .05), and all mesangial digital indicators were higher in patients categorized as M1 (). Besides, the relationship between the P digital features and the segmental sclerosis score from the Oxford classification was analyzed. Only the maximum of P was significantly correlated with the segmental sclerosis score ().
Figure 4. Correlation of mesangial digital features with Oxford mesangial hypercellularity score. M score, mesangial hypercellularity score from the Oxford classification of IgA nephropathy (Citation19, Citation20). Cases in which more than half the glomeruli contain more than three cells in a mesangial area is categorized as M1, and conversely, were categorized as M0. P values and correlation coefficients were calculated from Spearman’s correlation test.
Furthermore, based on the good reliability of the ARPS in identifying glomerular intrinsic glomerular cells, correlation analysis was performed between clinical data and intraglomerular characteristics measured by the ARPS, including intrinsic glomerular cells and glomerular and mesangial areas (Figure S2). The maximum and density of P in allograft IgAN patients were found to be negatively correlated with proteinuria levels and serum triglyceride (p < .05). All digital features of P were negatively correlated with serum total cholesterol (p < .05). The maximum and ratio of M were positively correlated with graft age at allograft IgAN biopsy (p < .05). The mesangial area and its ratio were also found to be positively correlated with proteinuria levels, serum total cholesterol and graft age at allograft IgAN biopsy (p < .05). The maximum number and density of E were negatively associated with serum creatinine (p < .05). In addition, a positive correlation was also observed between glomerular area and graft age at allograft IgAN biopsy (p < .05).
Association between clinicopathological features and allograft survival
Among the 56 patients from our center, 53 patients’ follow-up information was available, and their mean follow-up time was 41.09 ± 21.61 months. Compared to low-level groups, a higher allograft survival was noticed among patients in the high-level groups of the maximum and ratio of E, and the maximum and density of P (). According to the results of univariate Cox proportional hazards regression model, 7 pathological indicators (the density and ratio of M, the maximum, density and ratio of E, maximum of P, and mesangial area ratio) and 3 clinical indicators (serum creatinine, eGFR and blood urea nitrogen) were all prognostic risk markers for allograft survival (p < .05) (). Moreover, serum creatinine and P maximum were identified as independent risk predictors of allograft loss based on multivariate Cox proportional hazards regression analysis (p < .05) ().
Figure 5. Kaplan–Meier curves of intrinsic glomerular cells identified by the analytic renal pathology system (ARPS) in high-level and low-level groups. E-max, maximum of endothelial cells; E-ratio, ratio of endothelial cells; P-max, maximum of podocytes; P-density, density of podocytes. P values were calculated by log-rank tests.
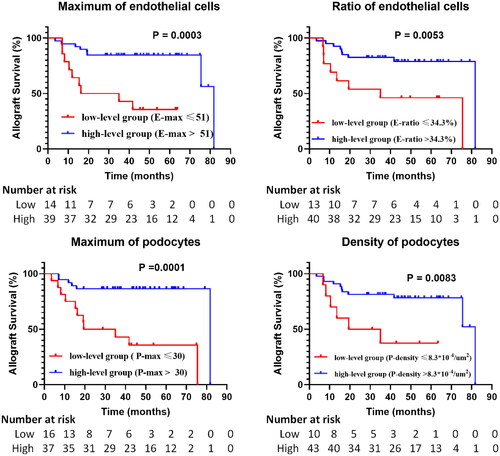
Table 3. Proportional Cox regression model assessing clinicopathological predictors of allograft failure.
Discussion
Our current study initially employed AI algorithms in allograft IgAN to identify glomerular lesion types and quantify intrinsic glomerular cells, achieving exceptional results. Additionally, this is the first study to investigate the prognostic value of the ARPS in allograft IgAN.
Generally, the application of the ARPS holds significance for pathological practice in allograft IgAN cases. From the perspective of identifying glomerular lesion types, the outstanding performance of the ARPS was observed in allograft IgAN, which is close to that in native IgAN13. Compared to SS and C, the ARPS exhibited a better capability to identify GS and NOA in allograft IgAN patients. Furthermore, the ICCs between the ARPS and pathologists in allograft IgAN were comparable or even superior to the ICCs among different pathologists in both native and allograft IgAN patients, underscoring the robust reliability of the ARPS in identifying glomerular lesions. It also revealed a trend in the consistency of lesion types (NOA > GS > SS > C), which is broadly consistent with the trend in ICCs for native and allograft IgAN among different pathologists (GS > SS and C) as previously reported [Citation21]. Furthermore, the imbalanced classes of the four glomerular lesion types in native IgAN could also contribute to this consistency trend [Citation13,Citation31]. Finally, the external validation also yielded outstanding results, closely matching those obtained through internal validation, thus demonstrating the applicability of the ARPS across different settings. In short, we posit that employing the ARPS can mitigate the potential for subjective errors inherent in the manual identification of glomerular lesion types by pathologists.
Meanwhile, the ARPS excelled in identifying intrinsic glomerular cells. Accordingly, we quantified the three types of intrinsic glomerular cells and calculated the average ratios of M, E and P in allograft IgAN patients. In contrast to the average ratio in native IgAN [Citation13], a highest proportion of E was noticed in allograft IgAN. After reviewing the Oxford classification in native IgAN patients, we observed a higher proportion of patients rated as M1 compared to allograft IgAN patients [Citation13]. This finding may partially explain the observed increase in the endothelial cell ratio of allograft IgAN patients in this study. Furthermore, it was noted that the quantitative mesangial variables provided by the ARPS were associated with the mesangial hypercellularity score, a component of the Oxford classification. Therefore, we assert that our ARPS is qualified to assist clinical practice. Currently, the mesangial hypercellularity score of the Oxford classification is evaluated manually by renal pathologists, which is time-consuming and subjective. Different from the semi-quantitative results of M0/1 in the Oxford classification, the ARPS can generate continuous variables of mesangial cells and mesangial area and provide a more objective and detailed evaluation of mesangial hypercellularity. Such automation can alleviate the workload of renal pathologists and potentially contribute to enhancing the MEST-C scoring system. Previous studies have established a connection between podocyte injury and glomerular segmental sclerosis. However, in this study, only the maximum of P was significantly correlated with the segmental sclerosis score [Citation21, Citation32–34]. While the remaining digital features of P displayed a negative correlation, they did not reach statistical significance. The limited sample size might account for this lack of significance. Additionally, external validation of the ARPS was also implemented to identify intrinsic glomerular cells. A difference was observed in identifying P between internal and external validation (Figure S3). We assumed that the difference in the staining protocol between the two centers was the main cause of the identified difference. In summary, the ARPS was deemed capable of assisting the clinical assessment of intrinsic glomerular cells in allograft IgAN patients.
Our findings of this study illustrate the prognostic value of the ARPS and potentially provide the opportunity to gain insight into allograft IgAN. Serum creatine and the maximum of P were identified as independent risk factors for allograft failure based on multivariate analysis. This result suggested that they were important pathological prognostic variables in allograft IgAN. The effect of serum creatinine on prognosis has already been confirmed in both native IgAN and transplant glomerulopathy [Citation35–38]. Podocyte injury, a feature of glomerulopathies, often leads to proteinuria. Plenty of researches have proved that proteinuria is a dominant prognostic factor for the progression of native IgAN and allograft kidney disease [Citation39–41]. Therefore, it is crucial to further understand the importance of podocyte injury in IgAN. The well-recognized method of podocyte quantification in morphometry is using indirect immunofluorescence for podocyte nuclei detection which is tedious and costly [Citation42]. Based on this method, many podocyte-relevant indicators emerged, such as podocytes number and density [Citation43–46]. These indicators fostered several research on the prognosis of native IgAN and allograft kidney diseases [Citation47–51]. However, the prognostic significance of podocyte injury in allograft IgAN has not been reported. Valuably, the ARPS affords a more convenient, objective, and economical option in podocyte research. In this study, we successfully confirmed the prognostic value of podocytes in allograft IgAN patients, thereby providing valuable insights for further investigation into the role of podocytes in allograft IgAN.
However, there are still several limitations in this study. First, the native kidney biopsy and donor kidney biopsy information of most patients was not accessible. Second, only the crescent itself was investigated in this study, excluding the subcategories of crescents.
Conclusion
Considering its excellent performance in both internal and external validation, the ARPS could be applied to identify the glomerular lesion types and quantify the intrinsic glomerular cells of allograft IgAN patients. Furthermore, the results of glomerular lesions and glomerular intrinsic glomerular cells identified by the ARPS were associated with clinical data and graft outcome. In summary, we are confident that the ARPS can be a successful component of clinical practice because its performance is consistent with and even better than that of experienced pathologists in some respects.
Statement of Ethics
The study was conducted in strict accordance with the World Medical Association Declaration of Helsinki. The study was approved by the Ethics Committee of Jinling Hospital (2022DZKY-055-01).
Authors’ contributions
XL and CZ conceived and designed the study. XL, DL, and QL collected and digitized all patient cohorts, and carried out statistical analysis. JC and HL compiled pathology data of patients from external center. CZ, FX, SL, DL, and FY participated in analysis and interpretation of the data. XL and HF drafted the manuscript. CZ revised the manuscript. HW, YN, GX, and CZ provided administrative, technical, or material support.
Supplemental Material
Download PDF (512 KB)Acknowledgements
We thank all the participants of this study. The pathological resources for external validation were provided by the First Affiliated Hospital of Zhejiang University.
Disclosure statement
No potential conflict of interest was reported by the author(s).
Data availability statement
The data underlying this article will be shared on reasonable request to the corresponding author.
Additional information
Funding
References
- LeCun Y, Bengio Y, Hinton G. Deep learning. Nature. 2015;521(7553):1–12. doi: 10.1038/nature14539.
- Xie G, Chen T, Li Y, et al. Artificial intelligence in nephrology: how can artificial intelligence augment nephrologists’ intelligence? Kidney Dis (Basel). 2020;6(1):1–6. doi: 10.1159/000504600.
- Ho YS, Fülöp T, Krisanapan P, et al. Artificial intelligence and machine learning trends in kidney care. Am J Med Sci. 2024:S0002-9629(24)00051-X. doi: 10.1016/j.amjms.2024.01.018.
- Thongprayoon C, Kaewput W, Kovvuru K, et al. Promises of big data and artificial intelligence in nephrology and transplantation. J Clin Med. 2020;9(4):1107.
- Bukowy JD, Dayton A, Cloutier D, et al. Region-based convolutional neural nets for localization of glomeruli in trichrome-stained whole kidney sections. J Am Soc Nephrol. 2018;29(8):2081–2088. doi: 10.1681/ASN.2017111210.
- Chagas P, Souza L, Araújo I, et al. Classification of glomerular hypercellularity using convolutional features and support vector machine. Artif Intell Med. 2020;103:101808. doi: 10.1016/j.artmed.2020.101808.
- Kato T, Relator R, Ngouv H, et al. Segmental HOG: new descriptor for glomerulus detection in kidney microscopy image. BMC Bioinf. 2015;16(1):316. doi: 10.1186/s12859-015-0739-1.
- Sheehan S, Mawe S, Cianciolo RE, et al. Detection and classification of novel renal histologic phenotypes using deep neural networks. Am J Pathol. 2019;189(9):1786–1796. doi: 10.1016/j.ajpath.2019.05.019.
- Jayapandian CP, Chen Y, Janowczyk AR, et al. Development and evaluation of deep learning-based segmentation of histologic structures in the kidney cortex with multiple histologic stains. Kidney Int. 2021;99(1):86–101. doi: 10.1016/j.kint.2020.07.044.
- Hermsen M, de Bel T, den Boer M, et al. Deep learning-based histopathologic assessment of kidney tissue. J Am Soc Nephrol. 2019;30(10):1968–1979. doi: 10.1681/ASN.2019020144.
- Kim YG, Choi G, Go H, et al. A fully automated system using A convolutional neural network to predict renal allograft rejection: extra-validation with giga-pixel immunostained slides. Sci Rep. 2019;9(1):5123. doi: 10.1038/s41598-019-41479-5.
- Gadermayr M, Dombrowski AK, Klinkhammer BM, et al. CNN Cascades for segmenting sparse objects in gigapixel whole slide images. Comput Med Imaging Graph. 2019;71:40–48. doi: 10.1016/j.compmedimag.2018.11.002.
- Zeng C, Nan Y, Xu F, et al. Identification of glomerular lesions and intrinsic glomerular cell types in kidney diseases via deep learning. J Pathol. 2020;252(1):53–64. doi: 10.1002/path.5491.
- Wyatt RJ, Julian BA. IgA nephropathy. N Engl J Med. 2013;368(25):2402–2414. doi: 10.1056/NEJMra1206793.
- Floege J, Barratt J. IgA nephropathy: a perspective for 2021. Semin Immunopathol. 2021;43(5):625–626. doi: 10.1007/s00281-021-00890-9.
- Le W, Liang S, Hu Y, et al. Long-term renal survival and related risk factors in patients with IgA nephropathy: results from a cohort of 1155 cases in a chinese adult population. Nephrol Dial Transplant. 2012;27(4):1479–1485. doi: 10.1093/ndt/gfr527.
- Uffing A, Pérez-Saéz MJ, Jouve T, et al. Recurrence of IgA nephropathy after kidney transplantation in adults. Clin J Am Soc Nephrol. 2021;16(8):1247–1255. doi: 10.2215/CJN.00910121.
- Allen PJ, Chadban SJ, Craig JC, et al. Recurrent glomerulonephritis after kidney transplantation: risk factors and allograft outcomes. Kidney Int. 2017;92(2):461–469. doi: 10.1016/j.kint.2017.03.015.
- Roberts ISD, Cook HT, Troyanov S, Working Group of the International Ig ANN, the Renal Pathology S., et al. The oxford classification of IgA nephropathy: pathology definitions, correlations, and reproducibility. Kidney Int. 2009;76(5):546–556. doi: 10.1038/ki.2009.168.
- Cattran DC, Coppo R, Cook HT, Working Group of the International Ig ANN, the Renal Pathology S., et al. The oxford classification of IgA nephropathy: rationale, clinicopathological correlations, and classification. Kidney Int. 2009;76(5):534–545. doi: 10.1038/ki.2009.243.
- Trimarchi H, Barratt J, Cattran DC, et al. Oxford classification of IgA nephropathy 2016: an update from the IgA nephropathy classification working group. Kidney Int. 2017;91(5):1014–1021. doi: 10.1016/j.kint.2017.02.003.
- Park S, Go H, Baek CH, et al. Clinical importance of the updated oxford classification in allograft IgA nephropathy. Am J Transplant. 2019;19(10):2855–2864. doi: 10.1111/ajt.15400.
- Vasconcelos AS, Mazzali M, de Sousa MV. IgA nephropathy and kidney transplantation according to the oxford classification. J Bras Nefrol. 2023;45(3):350–356.
- Agrawal V, Singh A, Kaul A, et al. Utility of oxford classification in post-transplant immunoglobulin A nephropathy. Transplant Proc. 2017;49(10):2274–2279. doi: 10.1016/j.transproceed.2017.10.002.
- Mariani G, Freitas LLL, Zollner RL, et al. Renal outcome in IgA nephropathy according to oxford classification and ultrastructural analysis in a Brazilian center. Clin Nephrol. 2018;89(4):270–276. doi: 10.5414/CN109062.
- Bellur SS, Roberts ISD, Troyanov S, et al. Reproducibility of the oxford classification of immunoglobulin A nephropathy, impact of biopsy scoring on treatment allocation and clinical relevance of disagreements: evidence from the VALidation of IGA study cohort. Nephrol Dial Transplant. 2019;34(10):1681–1690. doi: 10.1093/ndt/gfy337.
- Levey AS, Stevens LA, Schmid CH, et al. A new equation to estimate glomerular filtration rate. Ann Intern Med. 2009;150(9):604–612.
- Loupy A, Haas M, Roufosse C, et al. The banff 2019 kidney meeting report (I): updates on and clarification of criteria for T cell- and antibody-mediated rejection. Am J Transplant. 2020;20(9):2318–2331. doi: 10.1111/ajt.15898.
- Minaee S, Kalchbrenner N, Cambria E, et al. Deep learning-based text classification: a comprehensive review. ACM Comput Surv. 2021;54(3):1–40. doi: 10.1145/3439726.
- Zeng CH, Le W, Ni Z, et al. A multicenter application and evaluation of the oxford classification of IgA nephropathy in adult chinese patients. Am J Kidney Dis. 2012;60(5):812–820. doi: 10.1053/j.ajkd.2012.06.011.
- Ferryman K, Mackintosh M, Ghassemi M. Considering biased data as informative artifacts in AI-assisted health care. N Engl J Med. 2023;389(9):833–838. doi: 10.1056/NEJMra2214964.
- Barisoni L. Podocyte biology in segmental sclerosis and progressive glomerular injury. Adv Chronic Kidney Dis. 2012;19(2):76–83. doi: 10.1053/j.ackd.2012.02.018.
- Hara S, Kobayashi N, Sakamoto K, et al. Podocyte injury-driven lipid peroxidation accelerates the infiltration of glomerular foam cells in focal segmental glomerulosclerosis. Am J Pathol. 2015;185(8):2118–2131. doi: 10.1016/j.ajpath.2015.04.007.
- Lu CC, Wang GH, Lu J, et al. Role of podocyte injury in glomerulosclerosis. Adv Exp Med Biol. 2019;1165:195–232.
- Barbour SJ, Coppo R, Zhang H, et al. Evaluating a new international risk-prediction tool in IgA nephropathy. JAMA Intern Med. 2019;179(7):942–952.
- Bosma RJ, Kwakernaak AJ, van der Heide JJ, et al. Body mass index and glomerular hyperfiltration in renal transplant recipients: cross-sectional analysis and long-term impact. Am J Transplant. 2007;7(3):645–652. doi: 10.1111/j.1600-6143.2006.01672.x.
- Chen T, Li X, Li Y, et al. Prediction and risk stratification of kidney outcomes in IgA nephropathy. Am J Kidney Dis. 2019;74(3):300–309. doi: 10.1053/j.ajkd.2019.02.016.
- Clayton PA, Lim WH, Wong G, et al. Relationship between eGFR decline and hard outcomes after kidney transplants. JASN. 2016;27(11):3440–3446. doi: 10.1681/ASN.2015050524.
- Pattrapornpisut P, Avila-Casado C, Reich HN. IgA nephropathy: core curriculum 2021. Am J Kidney Dis. 2021;78(3):429–441. doi: 10.1053/j.ajkd.2021.01.024.
- Reich HN, Troyanov S, Scholey JW, et al. Remission of proteinuria improves prognosis in IgA nephropathy. J Am Soc Nephrol. 2007;18(12):3177–3183. doi: 10.1681/ASN.2007050526.
- Yu GZ, Guo L, Dong JF, et al. Persistent hematuria and kidney disease progression in IgA nephropathy: a cohort study. Am J Kidney Dis. 2020;76(1):90–99. doi: 10.1053/j.ajkd.2019.11.008.
- Venkatareddy M, Wang S, Yang Y, et al. Estimating podocyte number and density using a single histologic section. J Am Soc Nephrol. 2014;25(5):1118–1129. doi: 10.1681/ASN.2013080859.
- Haruhara K, Sasaki T, de Zoysa N, et al. Podometrics in Japanese living donor kidneys: associations with nephron number, age, and hypertension. JASN. 2021;32(5):1187–1199. doi: 10.1681/ASN.2020101486.
- Chen DP, Zaky ZS, Schold JD, et al. Podocyte density is reduced in kidney allografts with high-risk APOL1 genotypes at transplantation. Clin Transplant. 2021;35(4):e14234.
- Schaub JA, O’Connor CL, Shi J, et al. Quantitative morphometrics reveals glomerular changes in patients with infrequent segmentally sclerosed glomeruli. J Clin Pathol. 2022;75(2):121–127. doi: 10.1136/jclinpath-2020-207149.
- Ding F, Wickman L, Wang SQ, et al. Accelerated podocyte detachment and progressive podocyte loss from glomeruli with age in alport syndrome. Kidney Int. 2017;92(6):1515–1525. doi: 10.1016/j.kint.2017.05.017.
- Hishiki T, Shirato I, Takahashi Y, et al. Podocyte injury predicts prognosis in patients with iga nephropathy using a small amount of renal biopsy tissue. Kidney Blood Press Res. 2001;24(2):99–104. doi: 10.1159/000054214.
- Xu L, Yang HC, Hao CM, et al. Podocyte number predicts progression of proteinuria in IgA nephropathy. Mod Pathol. 2010;23(9):1241–1250. doi: 10.1038/modpathol.2010.110.
- Naik AS, Afshinnia F, Aqeel J, et al. Accelerated podocyte detachment early after kidney transplantation is related to long-term allograft loss of function. Nephrol Dial Transplant. 2019;34(7):1232–1239. doi: 10.1093/ndt/gfy350.
- Naik AS, Afshinnia F, Cibrik D, et al. Quantitative podocyte parameters predict human native kidney and allograft half-lives. JCI Insight. 2016;1(7):e86943. doi: 10.1172/jci.insight.86943.
- Yang Y, Hodgin JB, Afshinnia F, et al. The two kidney to one kidney transition and transplant glomerulopathy: a podocyte perspective. J Am Soc Nephrol. 2015;26(6):1450–1465. doi: 10.1681/ASN.2014030287.