
Abstract
Background
Acute kidney injury (AKI) represents a diverse range of conditions characterized by high incidence and mortality rates, and it is mainly associated with immune-mediated mechanisms and mitochondrial metabolism dysfunction. Cuproptosis, a recently identified form of programmed cell death dependent on copper, is closely linked to mitochondrial respiration and contributes to various diseases. Our study aimed to investigate the involvement of cuproptosis-related genes (CRGs) in AKI.
Methods
Identification of CRGs was conducted using differential expression analysis, and subsequent Gene Ontology (GO) and Kyoto Encyclopedia of Genes and Genomes (KEGG) pathway enrichment analyses were conducted using human sequencing profiles. Utilizing CIBERSORT algorithm, receiver operating characteristic (ROC) curve analysis, nomogram development, and decision curve analysis (DCA), the association among immune scores, CRGs, and the diagnostic value of these genes was explored.
Results
Notably, six CRGs (FDX1, DLD, DLAT, DBT, PDHA1, and ATP7A) were identified as significant differentiators between AKI and non-AKI groups. The ROC curve, based on these six genes, demonstrated an AUC value of 0.917, which was further validated using an additional dataset with an AUC value of 0.902. Nomogram and DCA further confirmed the accuracy of the model in predicting the risk of AKI.
Conclusion
This study elucidated the role of cuproptosis in AKI and revealed the association between CRGs and infiltrated immune cells through comprehensive bioinformatic techniques. The six-gene cuproptosis-related signature exhibited remarkable predictive efficiency for AKI.
Introduction
Acute kidney injury (AKI) is a severe and complex syndrome characterized by the sudden loss of excretory kidney function, as defined by a rapid increase in serum creatinine, decreased urine output, or both [Citation1]. Occurring in approximately 10–15% of all hospitalizations [Citation2], the incidence of AKI increases to over 50% in patients admitted to intensive care units (ICUs) [Citation3, Citation4]. Despite advances in nursing, global AKI-related mortality has remained noticeable over the last 50 years [Citation5], reaching around 50% in patients requiring kidney replacement treatment. AKI, if not fully recovered, may lead to irreversible nephron loss and chronic kidney disease (CKD), eventually progressing to end-stage renal disease (ESRD [Citation5]. Moreover, AKI significantly increases the risk of subsequent heart failure, myocardial infarction, and stroke [Citation6]. Thus, early detection and exploration of the potential mechanism of AKI is essential due to the high mortality rate and unfavorable prognosis associated with CKD and cardiovascular morbidity.
AKI is diagnosed clinically, with elevated plasma creatinine (Cr) and decreased urine output serving as classic indicators in the approved diagnostic criteria, such as the Risk, Injury, Failure, Loss of kidney function, and End-stage kidney disease (RIFLE), Acute Kidney Injury Network (AKIN) classifications, and the 2012 KDIGO criteria [Citation5]. However, plasma Cr may not be a proper biomarker as it is closely related to patients’ age, gender, reflecting only the balance of Cr production and excretion. This limitation makes it challenging to apply in pediatric patients, particularly neonates [Citation7, Citation8]. Meanwhile, the urine volume is susceptible to the effects of volume resuscitation. Recognizing these constraints, researchers have been actively exploring new biomarkers for AKI over the past decade [Citation9–12]. Biomarkers which are mostly concerned include Urinary kidney injury molecule-1 (KIM-1), liver-type fatty acid binding protein (L-FABP), insulin-like growth factor-binding protein-7 (IGFBP-7), tissue inhibitor of metalloprotease-2 (TIMP-2), and neutrophil gelatinase-associated lipocalin (NGAL). Among them, IGFBP7 has drawn significant attention as a urinary biomarker in predicting different types of AKI [Citation13]. However, a major limitation of current biomarker research in AKI is the lack of tissue correlation [Citation10]. Clinical application remains a distant objective, and there is an urgent need for effective biomarkers or a novel diagnostic signature to achieve precise recognition.
As a metal trace, copper serves as a catalytic and structural cofactor for enzymes that is essential for the maintenance of normal biological activities [Citation14]. However, it is imperative to maintain extremely low intracellular copper concentrations to prevent the accumulation of free intracellular copper and the resulting copper-induced cytotoxicity. Recently, a novel copper-induced cell death mediated by proteolipid acylation has been discovered and termed “cuproptosis” which is quite distinct from other oxidative stress-regulated deaths such as pyroptosis, ferroptosis, and necroptosis. It was reported that the excess intracellular copper could bind to lipid-acylated components of the tricarboxylic acid cycle, leading to lipoylated protein aggregation and iron-sulfur cluster protein depletion, and subsequent cell death [Citation15,Citation16]. The recently reported finding revealed the mechanism of copper-mediated cytotoxicity. Several forms of cell death pathways have been reported to be involved in the occurrence and development of AKI, such as apoptosis, necrosis, ferroptosis, and pyroptosis [Citation17–20]. However, the role of cuproptosis in the pathogenesis and development of AKI remains elusive. Therefore, in the present study, it was hypothesized that cuproptosis could be associated with AKI and that cuproptosis-related genes (CRGs) may serve as new biomarkers for the early diagnosis and treatment for AKI.
In this study, a systematic exploration of differentially expressed CRGs and immune infiltration analysis were carried out. Subsequently, a novel diagnostic cuproptosis-related model was developed based on the identified differentially expressed CRGs. To assess the model’s performance, a nomogram, decision curve analysis (DCA), and an external dataset for validation were employed. Additionally, leveraging the expression levels of the differentially expressed CRGs, AKI patients were categorized into two distinct cuproptosis-related clusters for the immune infiltration analysis within each subcluster.
Materials and methods
Data acquisition and processing
Gene expression datasets were downloaded from GEO database (www.ncbi.nlm.nih.gov/geo/) based on specific criteria: (a) inclusion of patients diagnosed with AKI; (b) inclusion of datasets with at least 10 AKI and healthy kidney tissue samples; (c) GEO datasets containing >5000 genes. Finally, 2 gene expression profiles (GSE139061, GSE30718 were included (). A total of 9 control and 39 AKI kidney were collected from dataset GSE139061. The detection platforms were based on GPL20301. The dataset GSE30178 was based on the GPL6244 platform, containing 11 kidney samples from healthy controls and 28 kidney samples from AKI patients [Citation21]. Moreover, GSE139061 was selected as a training dataset and GSE30718 was chosen for validation analysis [Citation22].
Table 1. Details of microarray data.
Moreover, we curated a set of 16 CRGs (FDX1, LIAS, LIPT1, DLD, DLAT, PDHA1, PDHB, SLC31A1, MTF1, GLS, CDKN2A, DBT, GCSH, DLST, ATP7A, and ATP7B) from previously published literature [Citation15].
Identification and functional enrichment analysis of differentially expressed CRGs
Differential analysis of CRGs was performed using the limma package in R 4.2.2 software (University of Auckland, New Zealand) [Citation23], employing an adjusted p-value cutoff of < 0.05. Heatmaps were generated using the “pheatmap” package in R. Gene Ontology (GO) and Kyoto Encyclopedia of Genes and Genomes (KEGG) enrichment analyses were carried out to unravel the biological functions of the CRGs, utilizing the “cluster Profiler” package and “circlize” package [Citation24,Citation25]. Statistical significance was set at p < 0.05.
Immune infiltration analysis using the CIBERSOFT algorithm
The evaluation of immune cell infiltration in AKI samples was conducted using the CIBERSORT algorithm (https://cibersort.stanford.edu/) with the LM22 gene file defining 22 immune cell subsets. A significance threshold of P-value < 0.05 and the bar plot displayed the immune cell composition for each sample. The sum of proportions for the 22 immune cells in each sample was equal to 1.
Correlation analysis between differentially expressed CRGs and infiltrated immune cells
To explore the correlation between CRGs and AKI-related immune cell properties, correlation analysis was conducted by R software. The Spearman correlation coefficient was employed to establish significance, and P value below 0.05 was indicative of a significant correlation. The outcomes were visualized using the “ggplot” package in R software.
Development of the diagnostic model
Following the correlation analysis, the differentially expressed CRGs were utilized to develop a diagnostic model for AKI using the “rms” package in R software. The model’s performance was assessed through nomogram visualization, DCA, and receiver operating characteristic (ROC) curve analysis. ROC-AUC values were categorized as follows: ≥ 0.9 for excellent discrimination, 0.8 ≤ ROC-AUC < 0.9 for great discrimination, 0.7 ≤ ROC-AUC < 0.8 for acceptable discrimination, and ROC-AUC = 0.5 indicating no discrimination. ROC analysis was implemented using the “ROCR” package (https://www.rdocumentation.org/packages/ROCR/).
Independent validation of the diagnostic model
The external kidney tissue dataset of GSE30718 was applied for validating the ability of the diagnostic model to distinguish AKI from non-AKI controls by using the ROC analyses. ROC curves were visualized using the “pROC” R package.
Subcluster analysis of differentially expressed CRGs
To elucidate cuproptosis-associated expression patterns in AKI, an unsupervised cluster analysis was performed on 39 AKI samples, dividing them into two clusters. This analysis, conducted using the “ConsensusClusterPlus” package(version1.62.0) in R software, was based on the six most differentially expressed CRGs related to immune infiltration. The optimal cluster number (k = 9) was determined through a comprehensive evaluation of the cumulative distribution function (CDF) curve, consensus matrix, and consensus cluster score (>0.9).
Results
Identification and functional enrichment analysis of differentially expressed CRGs
In the initial analysis of GSE139061, we scrutinized the expression profiles of 16 CRGs and identified six differentially expressed CRGs between AKI and non-AKI patients (P-values < 0.05). These genes, namely DLAT, DBT, ATP7A, PDHA1, FDX1, and DLD, were all downregulated in AKI patients (). To elucidate the biological functions of these cuproptosis regulators in AKI occurrence and progression, we conducted Gene Ontology (GO) enrichment analysis and Kyoto Encyclopedia of Genes and Genomes (KEGG) pathway analysis using the Bioconductor package clusterProfiler in R.
Figure 1. Identification and Functional Enrichment Analysis of Differentially Expressed CRGs in AKI. (A) Heatmap: Illustrating expression patterns of the six differentially expressed CRGs. (B) Circos Plot: Indicating the relationship between genes and Gene Ontology (GO) terms. (C) GO Categories: Representing Molecular Function (MF), Biological Processes (BP), and Cellular Components (CC) associated with CRGs. (D) KEGG Analysis: Unveiling the pathways enriched in the differentially expressed CRGs in AKI. (E) Correlation Analysis: Investigating the interplay among the six differentially expressed CRGs.
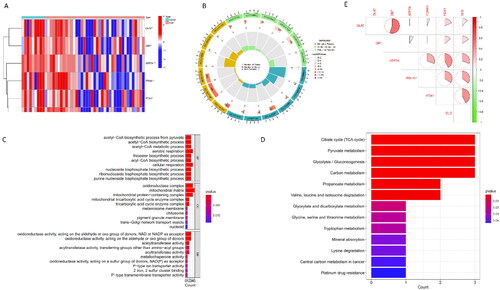
The GO enrichment analysis highlighted that, for Biological Processes (BP), AKI-related CRGs were predominantly associated with aerobic respiration, cellular respiration, and the acetyl-CoA process. Regarding Cellular Components (CC), these CRGs were mainly involved in the mitochondrial matrix, oxidoreductase complex, and mitochondrial protein-containing complex. In terms of Molecular Function (MF), the AKI-related CRGs were primarily linked to oxidoreductase activity and acetyltransferase activity (). Pathway analysis () revealed enrichment in the TCA cycle, pyruvate metabolism, and glycolysis/gluconeogenesis pathways.
Analysis of immune infiltration and correlation with differentially expressed CRGs
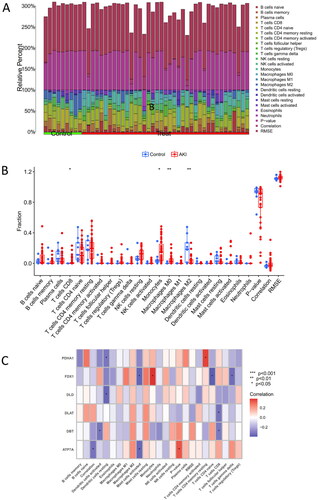
The distribution of 22 immune cell types in each sample in the GSE139061 is illustrated in . Each color in the figure corresponds to a distinct immune cell type. The analysis revealed that AKI patients demonstrated elevated levels of infiltration by M0 macrophages, monocytes, and CD8+ T cells while experiencing reduced infiltration levels of M2 macrophages (). Furthermore, a positive association was found between FDX1 and monocytes, whereas DBT and DLAT exhibited a negative correlation with CD8+ T cells ().
Figure 2. Immune infiltration and correlation analysis with CRGs. (A) Fractional representation of 22 immune cell types in both AKI and non-AKI control samples. (B) Boxplot illustrating the differences in immune infiltration cells between AKI and non-AKI controls. Statistical significance denoted by *p < 0.05 and **p < 0.01. (C) Correlation analysis depicting the relationship between CRGs and immune infiltration cells.
Construction and independent validation of the diagnostic model
To comprehensively assess the diagnostic capabilities of cuproptosis regulators, a nomogram was developed integrating clinical data and genetic characteristics of AKI patients using 6 differentially expressed CRGs (). The efficacy of the nomogram was evaluated through DCA. Notably, the results of DCA underscored the robust predictive efficiency of the nomogram, suggesting its potential utility in clinical decision-making ().
Figure 3. Construction and validation of the cuproptosis gene predictive diagnostic model.
(A) Nomogram illustrating the diagnostic potential of CRGs. (B) Calibration curve demonstrating the predictive accuracy of the non-correlation nomogram in the cohort. (C) ROC curve evaluating the diagnostic efficacy of the predictive diagnostic model. (D) ROC curve analysis assessing the diagnostic performance of the model in the test set of GSE30718.
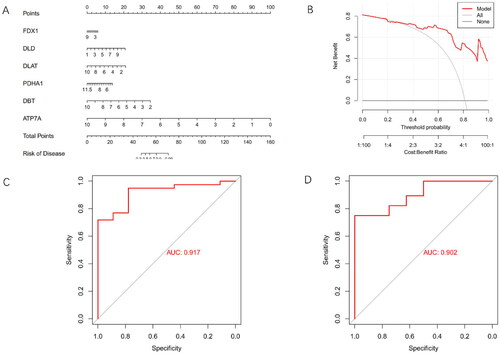
The ROC curve analysis was employed to further validate the performance of the 6-gene model, revealing an exceptional area under the curve (AUC) value of 0.917 (). External validation using datasets comprising normal and AKI kidney tissues, particularly in the GSE30718 dataset, highlighted the notable performance of the 6-gene model, yielding an AUC value of 0.902 (). These findings collectively demonstrated the high efficacy of the proposed model in accurately discriminating AKI patients from normal cases.
Identification of cuproptosis Subclusters in AKI
To reveal cuproptosis-related expression patterns in AKI samples, a consensus clustering algorithm was employed to categorize AKI patients based on the expression levels of six differentially expressed CRGs. The most stable cluster emerged when the cluster number (k-value) was set to two (k = 2), and the cumulative distribution function (CDF) curves remained within a minimal range at a consensus index ranging from 0.1 to 0.9 (). At k = 2, each subcluster exhibited a consistent score exceeding 0.9 ().
Figure 4. Identification of Cuproptosis-Related Subclusters in AKI.
(A)Consensus clustering matrix illustrating the stability of subclusters when k = 2.
(B)Representative Cumulative Distribution Function (CDF) curves providing insights into the clustering stability.
(C) Heatmap of the non-negative matrix showcasing the distinct patterns within the identified subclusters.
(D) Principal Component Analysis (PCA) plot visually representing the separation between the cuproptosis-related subclusters in Alzheimer’s Disease.
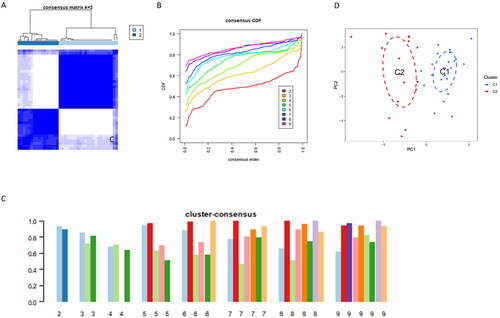
Subsequently, 39 AKI samples were successfully categorized into two distinct clusters, namely cluster 1 and cluster 2. The principal component analysis (PCA) plot () clearly illustrates a significant difference between the two clusters. This categorization provides a more profound insight into cuproptosis subclusters in the context of AKI.
Differentiation analysis of CRGs and immune infiltration analysis of the Subclusters
To explore the distinct characteristics of the two clusters, the differences in the expression levels of differentially expressed CRGs were assessed. The heatmap and boxplot visualization () revealed that Cluster 1 exhibited the higher expression levels of FDX1, DLD, PDHA1, and ATP7A compared with Cluster 2 (). Similarly, DLD and DBT showed a similar tendency, although no statistical significance was found.
Figure 5. Differentiation Analysis and Immune Infiltration Analysis of Two Cuproptosis Subclusters.
(A) The heatmap illustrates clinical features and expression patterns of six CRGs in the identified cuproptosis subclusters.
(B) Boxplots depict the expression levels of the six CRGs between the two cuproptosis subclusters, with statistical significance denoted by *p < 0.05 and **p < 0.01.
(C) Relative abundances of 22 immune cells are presented for the two cuproptosis-specific subclusters.
(D) The bar chart showcases the differences in immune infiltration cells between the two cuproptosis subclusters.
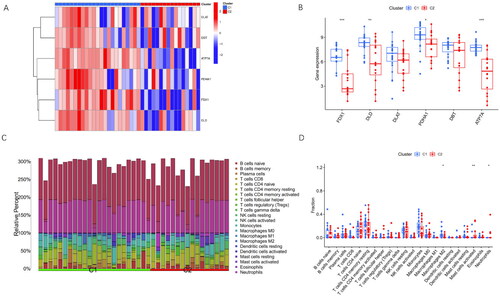
Subsequently, the immune infiltration analysis was conducted to explore the altered immune characteristics between Cluster 1 and Cluster 2 (). The results demonstrated the elevated levels of neutrophils, activated mast cells, and M2 macrophages in Cluster 1 compared with those in Cluster 2 (). This analysis provided valuable insights into the immune microenvironment differences between the two clusters.
Discussion
AKI involves a diverse range of conditions characterized by elevated incidence and mortality rates, frequently displaying no symptoms until the emergence of kidney failure. Cuproptosis, a recently identified type of cell death characterized by the aggregation of lipoylated mitochondrial enzymes and depletion of iron-sulfur cluster proteins, has been strongly implicated in the occurrence and progression of some diseases [Citation15]. However, the roles of cuproptosis in AKI remain elusive. The present study aimed to assess the regulatory role of CRGs in AKI and explore its impact on the immune microenvironment. Additionally, a novel cuproptosis-related signature was developed to diagnose AKI.
In the present study, the first comprehensive profiling of CRGs in kidney tissues between AKI patients and normal controls was conducted. The findings revealed a greater number of dysregulated CRGs in AKI patients compared with normal controls, indicating the potentially crucial involvement of cuproptosis in the occurrence and progression of AKI. Subsequently, the correlation between CRGs was calculated, identifying significant synergistic or antagonistic effects, highlighting notable interactions among cuproptosis-associated regulators of AKI.
Moreover, immune infiltration analysis demonstrated alterations in immune cell abundance in AKI patients, which is consistent with previously reported studies [Citation26–28]. Up-regulation of M0 macrophages, monocytes, and CD8+ T cell infiltration, along with down-regulation of M2 macrophages, was observed in AKI patients compared with controls. Further correlation analysis between CRGs and immune cells revealed associations such as FDX1 with monocytes and DBT/DLAT with CD8+ T cells. These findings provide valuable insights into the complex interplay between CRGs, immune cells, and the development of AKI.
Over the last decade, the interactions between AKI and the immune system have notably attracted scholars’ attention [Citation27–29]. There are several types of immune cells, such as macrophages, dendritic cells, and lymphocytes, in the normal kidney with a small population [Citation30]. It is documented that the amount of macrophages dramatically increases in post-ischemic kidneys, with monocytes following, which then differentiate into macrophages [Citation31]. M1 macrophages contribute to the initiation stage of kidney injury by releasing chemokines, proinflammatory cytokines, and inducible nitric oxide synthase, while M2 macrophages participate in wound healing and inflammation resolution, a phenomenon validated in different AKI models [Citation32,Citation33]. Recently, macrophages were implicated in the disease pathogenesis of rhabdomyolysis-induced AKI, Koshu Okubo’s study showed that macrophages released extracellular traps (ETs) comprising DNA fibers and granule proteins in a mouse model of rhabdomyolysis induced AKI [Citation34]. Similarly, Wei et al. observed that macrophages promote inflammatory responses to AKI through macrophage phenotype polarization and efferocytosis in 2 different murine AKI models including renal ischemia/reperfusion injury (IRI) and cisplatin-induced AKI [Citation35]. Additionally, a recent study revealed that macrophages can limit septic AKI by expressing interleukin-1 receptor antagonist and restraining interleukin-6 generation from endothelial cells [Citation36]. Our results also show an increase in the expression level of the M1 macrophage marker and a significant decrease in the expression level of the M2 macrophage marker.
T lymphocytes mediate pathogenic and reparative processes during AKI, while the exact mechanisms regulating kidney T cell functions remain elusive [Citation37]. Gong et al. ‘s findings in 2020 indicated the pivotal role of T lymphocytes in AKI, revealing an increase in CD4-CD8- T lymphocytes at 24 h, declining by 72 h in the cisplatin-induced AKI mouse model.Moreover, in vitro kidney coculture with CD4/CD8- T cells decreased cisplatin-induced apoptosis in kidney proximal tubular epithelial cells [Citation38]. These findings suggest that CD4/CD8- T lymphocytes play a protective role in not only ischemic AKI but also in cisplatin-induced AKI. However, in our research, the CD4+ T lymphocytes did not show a significant difference, whereas the CD8+ T lymphocytes were markedly up regulated. the exact regulatory mechanism of T lymphocytes requires further research. The correlation between CRGs and immune cells provides new insights into the mechanisms underlying AKI.
Subsequently, a diagnostic model was developed based on 6 differentially expressed CRGs, which was validated using an external dataset. The six-gene signature demonstrated a precise diagnostic performance for AKI in the external validation dataset (AUC = 0.902), emerging as a novel diagnostic approach for AKI. More importantly, a nomogram was also developed for AKI diagnosis, utilizing DLAT, DBT, ATP7A, PDHA1, FDX1, and DLD genes. This nomogram exhibited a remarkable diagnostic efficacy, emphasizing its potential for the future clinical application in AKI diagnosis.
Bioinformatic analysis of the CRGs revealed enrichment in mitochondrial matrix and protein-containing complex, TCA cycle, enzymatic activities, and glycolysis/gluconeogenesis pathways. Mitochondria have remarkably attracted clinicians’ attention in understanding AKI mechanisms, with recent research emphasizing the crucial role of energy metabolism dysfunction in the pathogenesis of AKI. Studies demonstrated that during sepsis-induced AKI, energy metabolism may initially shift toward glycolysis mediated by the Akt/mTORC1/HIF-1α pathway, reducing oxidative phosphorylation and mitochondrial ROS production. Subsequently, the AMPK-dependent pathway is activated for mitochondrial biogenesis [Citation39]. In-depth investigations into mitophagy and mitochondrial apoptosis have demonstrated protective effects on stressed cells, contributing to AKI ameliorations on stressed cells, contributing to AKI amelioration [Citation40,Citation41]. Cuproptosis, a novel copper-dependent cell death mechanism, is closely associated with mitochondrial activity [Citation15,Citation42]. Therefore, it was hypothesized that CRGs may influence the pathological process of AKI by interacting with mTORC1 and AMPK pathways. However, further studies are required to validate this hypothesis.
Additionally, unsupervised cluster analysis was employed to elucidate distinct cuproptosis regulation patterns in AKI patients based on the expression levels of CRGs. Two distinct cuproptosis-related clusters were identified. Cluster 1 exhibited a higher level of immune infiltration, particularly with neutrophils, activated mast cells, and M2 macrophages. Sepsis or noninfectious forms of inflammation play a crucial mediating role in AKI. Although neutrophils are important components of the inflammatory cascade, the precise role of neutrophils in AKI remains controversial [Citation27]. Prior research has indicated the recruitment and infiltration of neutrophils in ischemia-reperfusion induced AKI [Citation43]. Similarly, it reported that neutrophil numbers increased in sepsis induced AKI [Citation44]. It was also reported that neutrophil count increased in cisplatin-induced AKI [Citation45,Citation46]. To date, few studies have concentrated on the role of mast cells in AKI. Notably, Shaun et al. reported that mast cell-deficient mice exhibited significant attenuation AKI by reducing TNF production [Citation47]. Regarding M2 macrophages, significant differences were observed both in the overall immune infiltration analysis and the subcluster immune infiltration analysis, indicating the pivotal role of M2 macrophages in AKI.
However, some limitations of this study should be pointed out. Firstly, the analysis was based on public datasets, lacking detailed clinical data, such as pathological characteristics of AKI. Secondly, despite utilizing an external dataset for additional validation, further in vivo and in vitro experimental verification of expression levels of CRGs is necessary. Lastly, due to time constraints, it was infeasible to explore the precise role of cuproptosis and potential interactions between CRGs and immune cells in AKI. Hence, further research is required to eliminate the above-mentioned limitations.
Conclusions
In summary, this study assessed the impact of cuproptosis on the development of AKI and elucidated the correlation between CRGs and infiltrated immune cells, employing a range of bioinformatic techniques. A six-gene signature (FDX1, DLD, DLAT, DBT, PDHA1, and ATP7A) associated with cuproptosis was identified, demonstrating a remarkable diagnostic efficiency for AKI. A comprehensive immune infiltration analysis revealed that M2 macrophages play a pivotal role as key immune cells in the initiation and progression of AKI.
The above-mentioned findings represent the first evidence of cuproptosis involvement in the onset and progression of AKI, providing novel insights into the mechanisms and potential therapeutic targets for this disease.
Ethics approval and consent to participate
Not applicable.
Consent for publication
Not applicable.
Availability of Data and materials
Public datasets were utilized in this study and can be accessed here:(https://www.ncbi.nlm.nih.gov/geo/), GSE139061, GSE30718.
Competing interests
The authors declare that they have no competing interests.
Authors’ contributions
Yajing Li: Conceptualization, Methodology, Data Curation, Formal analysis, Writing—Original Draft. Yingxue Ding: Project administration, Writing—Review & Editing, Supervision. The author(s) read and approved the final manuscript.
Acknowledgments
Not applicable.
Disclosure statement
No potential conflict of interest was reported by the author(s).
References
- Khwaja A. KDIGO clinical practice guidelines for acute kidney injury. Nephron Clin Pract. 2012;120(4):1–11. doi: 10.1159/000339789.
- Al-Jaghbeer M, Dealmeida D, Bilderback A, et al. Clinical decision support for in-hospital AKI. J Am Soc Nephrol. 2018;29(2):654–660. doi: 10.1681/ASN.2017070765.
- Singbartl K, Kellum JA. AKI in the ICU: definition, epidemiology, risk stratification, and outcomes. Kidney Int. 2012;81(9):819–825. doi: 10.1038/ki.2011.339.
- Hoste EA, Bagshaw SM, Bellomo R, et al. Epidemiology of acute kidney injury in critically ill patients: the multinational AKI-EPI study. Intensive Care Med. 2015;41(8):1411–1423. doi: 10.1007/s00134-015-3934-7.
- Kellum JA, Romagnani P, Ashuntantang G, et al. Acute kidney injury. Nat Rev Dis Primers. 2021;7(1):52. doi: 10.1038/s41572-021-00284-z.
- Odutayo A, Wong CX, Farkouh M, et al. AKI and long-term risk for cardiovascular events and mortality. J Am Soc Nephrol. 2017;28(1):377–387. doi: 10.1681/ASN.2016010105.
- Lin X, Li J, Tan R, et al. Identification of hub genes associated with the development of acute kidney injury by weighted gene Co-expression network analysis. Kidney Blood Press Res. 2021;46(1):63–73. doi: 10.1159/000511661.
- Ronco C, Bellomo R, Kellum JA. Acute kidney injury. Lancet. 2019;394(10212):1949–1964. doi: 10.1016/S0140-6736(19)32563-2.
- Hoste E, Bihorac A, Al-Khafaji A, et al. Identification and validation of biomarkers of persistent acute kidney injury: the RUBY study. Intensive Care Med. 2020;46(5):943–953. doi: 10.1007/s00134-019-05919-0.
- Wen Y, Parikh CR. Current concepts and advances in biomarkers of acute kidney injury. Crit Rev Clin Lab Sci. 2021;58(5):354–368. doi: 10.1080/10408363.2021.1879000.
- Xiao Z, Huang Q, Yang Y, et al. Emerging early diagnostic methods for acute kidney injury. Theranostics. 2022;12(6):2963–2986. doi: 10.7150/thno.71064.
- Molinari L, Del Rio-Pertuz G, Smith A, et al. Utility of biomarkers for sepsis-associated acute kidney injury staging. JAMA Netw Open. 2022;5(5):e2212709. doi: 10.1001/jamanetworkopen.2022.12709.
- Yu JT, Hu XW, Yang Q, et al. Insulin-like growth factor binding protein 7 promotes acute kidney injury by alleviating poly ADP ribose polymerase 1 degradation. Kidney Int. 2022;102(4):828–844. doi: 10.1016/j.kint.2022.05.026.
- Kim BE, Nevitt T, Thiele DJ. Mechanisms for copper acquisition, distribution and regulation. Nat Chem Biol. 2008;4(3):176–185. doi: 10.1038/nchembio.72.
- Tsvetkov P, Coy S, Petrova B, et al. Copper induces cell death by targeting lipoylated TCA cycle proteins. Science. 2022;375(6586):1254–1261. doi: 10.1126/science.abf0529.
- Duan WJ, He RR. Cuproptosis: copper-induced regulated cell death. Sci China Life Sci. 2022;65(8):1680–1682. doi: 10.1007/s11427-022-2106-6.
- Linkermann A, Chen G, Dong G, et al. Regulated cell death in AKI. J Am Soc Nephrol. 2014;25(12):2689–2701. doi: 10.1681/ASN.2014030262.
- Hu Z, Zhang H, Yang SK, et al. Emerging role of ferroptosis in acute kidney injury. Oxid Med Cell Longev. 2019;2019:8010614–8010618. doi: 10.1155/2019/8010614.
- Li N, Wang Y, Wang X, et al. Pathway network of pyroptosis and its potential inhibitors in acute kidney injury. Pharmacol Res. 2022;175:106033. doi: 10.1016/j.phrs.2021.106033.
- Belavgeni A, Meyer C, Stumpf J, et al. Ferroptosis and necroptosis in the kidney. Cell Chem Biol. 2020;27(4):448–462. doi: 10.1016/j.chembiol.2020.03.016.
- Famulski KS, de Freitas DG, Kreepala C, et al. Molecular phenotypes of acute kidney injury in kidney transplants. J Am Soc Nephrol. 2012;23(5):948–958. doi: 10.1681/ASN.2011090887.
- Janosevic D, Myslinski J, McCarthy TW, et al. The orchestrated cellular and molecular responses of the kidney to endotoxin define a precise sepsis timeline. Elife. 2021;10:e62270. doi: 10.7554/eLife.62270.
- Ritchie ME, Phipson B, Wu D, et al. Limma powers differential expression analyses for RNA-sequencing and microarray studies. Nucleic Acids Res. 2015;43(7):e47–e47. doi: 10.1093/nar/gkv007.
- Gu Z, Gu L, Eils R, et al. Circlize implements and enhances circular visualization in R. Bioinformatics. 2014;30(19):2811–2812. doi: 10.1093/bioinformatics/btu393.
- Yu G, Wang LG, Han Y, et al. clusterProfiler: an R package for comparing biological themes among gene clusters. OMICS. 2012;16(5):284–287. doi: 10.1089/omi.2011.0118.
- Yao W, Chen Y, Li Z, et al. Single cell RNA sequencing identifies a unique inflammatory macrophage subset as a druggable target for alleviating acute kidney injury. Adv Sci (Weinh). 2022;9(12):e2103675.
- Singbartl K, Formeck CL, Kellum JA. Kidney-immune system crosstalk in AKI. Semin Nephrol. 2019;39(1):96–106. doi: 10.1016/j.semnephrol.2018.10.007.
- Uchida T, Yamada M, Inoue D, et al. Involvement of innate immune system in the pathogenesis of sepsis-associated acute kidney injury. Int J Mol Sci. 2023;24(15):12465. doi: 10.3390/ijms241512465.
- Anders HJ, Wilkens L, Schraml B, et al. One concept does not fit all: the immune system in different forms of acute kidney injury. Nephrol Dial Transplant. 2021;36(1):29–38. doi: 10.1093/ndt/gfaa056.
- Zheng L, Gao W, Hu C, et al. Immune cells in ischemic acute kidney injury. Curr Protein Pept Sci. 2019;20(8):770–776. doi: 10.2174/1389203720666190507102529.
- Ysebaert DK, De Greef KE, Vercauteren SR, et al. Identification and kinetics of leukocytes after severe ischaemia/reperfusion renal injury. Nephrol Dial Transplant. 2000;15(10):1562–1574. doi: 10.1093/ndt/15.10.1562.
- Huen SC, Cantley LG. Macrophage-mediated injury and repair after ischemic kidney injury. Pediatr Nephrol. 2015;30(2):199–209. doi: 10.1007/s00467-013-2726-y.
- Okabe Y, Medzhitov R. Tissue biology perspective on macrophages. Nat Immunol. 2016;17(1):9–17. doi: 10.1038/ni.3320.
- Okubo K, Kurosawa M, Kamiya M, et al. Macrophage extracellular trap formation promoted by platelet activation is a key mediator of rhabdomyolysis-induced acute kidney injury. Nat Med. 2018;24(2):232–238. doi: 10.1038/nm.4462.
- Huang W, Wang BO, Hou YF, et al. JAML promotes acute kidney injury mainly through a macrophage-dependent mechanism. JCI Insight. 2022;7(14):e158571. doi: 10.1172/jci.insight.158571.
- Privratsky JR, Ide S, Chen Y, et al. A macrophage-endothelial immunoregulatory axis ameliorates septic acute kidney injury. Kidney Int. 2023;103(3):514–528. doi: 10.1016/j.kint.2022.10.008.
- Noel S, Lee K, Gharaie S, et al. Immune checkpoint molecule TIGIT regulates kidney T cell functions and contributes to AKI. J Am Soc Nephrol. 2023;34(5):755–771. doi: 10.1681/ASN.0000000000000063.
- Gong J, Noel S, Hsu J, et al. TCR(+)CD4(-)CD8(-) (double negative) T cells protect from cisplatin-induced renal epithelial cell apoptosis and acute kidney injury. Am J Physiol Renal Physiol. 2020;318(6):F1500–F1512. doi: 10.1152/ajprenal.00033.2020.
- Sun J, Zhang J, Tian J, et al. Mitochondria in sepsis-induced AKI. J Am Soc Nephrol. 2019;30(7):1151–1161. doi: 10.1681/ASN.2018111126.
- Nakagawa S, Nishihara K, Inui K, et al. Involvement of autophagy in the pharmacological effects of the mTOR inhibitor everolimus in acute kidney injury. Eur J Pharmacol. 2012;696(1-3):143–154. doi: 10.1016/j.ejphar.2012.09.010.
- Su L, Zhang J, Gomez H, et al. Mitochondria ROS and mitophagy in acute kidney injury. Autophagy. 2023;19(2):401–414. doi: 10.1080/15548627.2022.2084862.
- Li SR, Bu LL, Cai L. Cuproptosis: lipoylated TCA cycle proteins-mediated novel cell death pathway. Signal Transduct Target Ther. 2022;7(1):158. doi: 10.1038/s41392-022-01014-x.
- Lau A, Rahn JJ, Chappellaz M, et al. Dipeptidase-1 governs renal inflammation during ischemia reperfusion injury. Sci Adv. 2022;8(5):eabm0142. doi: 10.1126/sciadv.abm0142.
- Tsuji N, Tsuji T, Yamashita T, et al. BAM15 treats mouse sepsis and kidney injury, linking mortality, mitochondrial DNA, tubule damage, and neutrophils. J Clin Invest. 2023;133(7):e152401. doi: 10.1172/JCI152401.
- Tadagavadi R, Reeves WB. Neutrophils in cisplatin AKI-mediator or marker? Kidney Int. 2017;92(1):11–13. doi: 10.1016/j.kint.2017.03.023.
- Liu Z, Li Z, Chen Z, et al. Numb ameliorates necrosis and inflammation in acute kidney injury induced by cisplatin. Chem Biol Interact. 2020;330:109251. doi: 10.1016/j.cbi.2020.109251.
- Summers SA, Chan J, Gan PY, et al. Mast cells mediate acute kidney injury through the production of TNF. J Am Soc Nephrol. 2011;22(12):2226–2236. doi: 10.1681/ASN.2011020182.