
Abstract
Background
The severity and course of sepsis-associated acute kidney injury (SA-AKI) are correlated with the mortality rate. Early detection of SA-AKI subphenotypes might facilitate the rapid provision of individualized care.
Patients and methods
In this post-hoc analysis of a multicenter prospective study, we combined conventional kidney function variables with serial measurements of urine (tissue inhibitor of metalloproteinase-2 [TIMP-2])* (insulin-like growth factor-binding protein [IGFBP7]) at 0, 6, 12, and 24 h) and then using an unsupervised hierarchical clustering of principal components (HCPC) approach to identify different phenotypes of SA-AKI. We then compared the subphenotypes with regard to a composite outcome of in-hospital death or the initiation of renal replacement therapy (RRT).
Results
We included 184 patients presenting SA-AKI within 6 h of the initiation of catecholamines. Three distinct subphenotypes were identified: subphenotype A (99 patients) was characterized by a normal urine output (UO), a low SCr and a low [TIMP-2]*[IGFBP7] level; subphenotype B (74 patients) was characterized by existing chronic kidney disease (CKD), a higher SCr, a low UO, and an intermediate [TIMP-2]*[IGFBP7] level; and subphenotype C was characterized by very low UO, a very high [TIMP-2]*[IGFBP7] level, and an intermediate SCr level. With subphenotype A as the reference, the adjusted hazard ratio (aHR) [95%CI] for the composite outcome was 3.77 [1.92–7.42] (p < 0.001) for subphenotype B and 4.80 [1.67–13.82] (p = 0.004) for subphenotype C.
Conclusions
Combining conventional kidney function variables with urine measurements of [TIMP-2]*[IGFBP7] might help to identify distinct SA-AKI subphenotypes with different short-term courses and survival rates.
Trial registration:
Background
Sepsis-associated acute kidney injury (SA-AKI) is the leading cause of AKI in the intensive care unit and is associated with a higher mortality rate than other types of AKI [Citation1–4]. According to the Kidney Disease Improving Global Outcome (KDIGO) initiative, the definition of AKI is based on an increase in the serum creatinine (SCr) level and/or a decrease in urine output (UO) [Citation5]. However, an approach based solely on trends in functional variables might not be sufficient for the accurate categorization of patients. Recent research results have shown that serial measurements of urine levels of cell cycle arrest biomarkers (tissue inhibitor of metalloproteinase-2 [TIMP-2] and insulin-like growth factor-binding protein [IGFBP7]), mostly secreted by tubule epithelial cells) might help to stratify patients with regard to short-term changes in kidney function, the need for renal replacement therapy (RRT), and survival in septic shock [Citation6–8] and was recently used to guide a therapeutic intervention for preventing AKI progression [Citation9,Citation10]. On the same lines, an expert panel from the Acute Dialysis Quality Initiative has suggested that combining kidney stress/damage biomarkers with kidney function variables might help to better characterize AKI and enable physicians to provide individualized care as soon as possible [Citation11].
The objective of the present prospective cohort study was, therefore, to determine whether or not the combination of serial measurements of urine cell cycle arrest biomarker levels and conventional kidney function variables available within 24 h of the diagnosis of septic shock-associated AKI could distinguish between the various subphenotypes of patients.
Patients and methods
We performed a post-hoc analysis of data from the multicenter, prospective AKI-CHECK study [Citation12] conducted between September 2015 and April 2017, in which 184 patients presented with septic shock [Citation13,Citation14] and were diagnosed with AKI within 6 h of the initiation of catecholamine treatment. The objective of the AKI-CHECK study was to determine whether or not urine levels of [TIMP-2]*[IGFBP7] could rapidly distinguish between transient AKI and persistent AKI in septic shock. The main exclusion criteria were severe chronic kidney disease (CKD, defined as an estimated glomerular filtration rate (eGFR) <30 mL/min per 1.73 m2), obstructive AKI, Child C cirrhosis, a previous episode of AKI during the current hospital stay, kidney transplantation, and cardiocirculatory arrest. In view of the study’s primary objective, patients presenting anuria or having received emergency RRT on admission were not included. The study protocol was approved by an independent ethics committee (CPP Nord Ouest II, Amiens, France: reference: 2015-A01392-47). Patients and their surrogates were informed of the study’s objectives and procedures and consented to participation. The present post-hoc analysis was registered with the French National Data Protection Commission (Commission Nationale de l’Informatique et des Libertés, Paris, France: registration number: PI2022_843_0068).
Objectives
The primary objective of the present analysis was to evaluate whether the combination of serial measurements of urine levels of cell cycle arrest biomarkers and standard kidney function variables over the first 24 h following the initiation of catecholamine treatment could distinguish between SA-AKI subphenotypes. The secondary objective was to compare the subphenotypes with regard to a composite outcome of in-hospital death or the initiation of RRT.
Data
Demographic and clinical data (age, sex, comorbidities, admission pathway, and the etiology of sepsis) were recorded, together with details of how the septic shock was managed (the course of the septic shock, the stroke volume over the first 24 h, and the norepinephrine dose [every 6 h]) over the first 24 h. The severity of illness was estimated using the Simplified Acute Physiology Score (SAPS 2) [Citation15] and the Sequential Organ Failure Assessment (SOFA) score [Citation16] on inclusion. Recovery from AKI was defined as a decrease of at least one KDIGO stage over 3 d of follow-up. Patients who initiated RRT within this time period were considered to have developed persistent AKI.
Statistical analysis
Clustering
We selected 12 candidate variables, based on their association with conventionally defined AKI and the KDIGO stage: the pre-admission SCr and e-GFR (calculated according to the Modification of Diet in Renal Disease [MDRD] formula), blood urea nitrogen at 0 h; SCr at 0 h and 24 h; and the weight-corrected UO at 0, 6, 12, and 24 h (measured with a bladder catheter). The urine [TIMP-2]*[IGFBP7] value at 0, 6, 12, and 24 h was calculated automatically for a 100 mL sample of thawed urine, as described previously [Citation12]. The product of the two biomarker concentrations was divided by 1000, to yield a risk value ranging from 0.02 to 135 (ng/mL)2/1000.
Clusters were built using an unsupervised, two-step hierarchical clustering of principal components (HCPC) approach: a principal component analysis (PCA) was followed by a hierarchical clustering analysis using Euclidean distance measurements with Ward’s criterion. The use of a PCA was notably justified by the fact that all the continuous variables were reduced to a smaller number of principal components, which reduce the noise in the classification. Through scaling, this method balances the influence of all the continuous variables. The optimal number of clusters was determined by the majority rule in NbClust in R: the number of clusters indicated by the majority of the 25 indices is deemed to be the best fit. Over- or under-representations of variables in each group were assessed in a v-test within the HCPC function. The PCA and HCPC analysis were performed using the corresponding functions in the FactoMineR package 2.4 in R (version 4.0.5).
Continuous variables were expressed as the median (interquartile range [IQR]), and categorical variables were expressed as the frequency (percentage). Groups were compared using the Kruskal–Wallis rank sum test, Fisher’s exact test, or Pearson’s chi-squared test, as appropriate. The survival rates in each group (i.e., no RRT initiation or in-hospital death) were estimated using the Kaplan–Meier method and compared using two-sided log-rank tests. The adjusted surv function (adjusted curves package) in R software was used to estimate the adjusted survival rate, using direct standardization or G-computation [Citation17]. After group membership had been determined in an ordinal model with the cluster indicator variable as the dependent variable, the diagnostic performance in each cluster was estimated by calculation of the volume under an r-dimensional surface (VUS) and its 95% confidence interval (CI) [Citation18]. Predictive performances were estimated by the C-statistic, together with its 95% CI.
Results
Overall, 184 patients (median [IQR] age: 69 [58–79]) with septic-shock-associated AKI were included in the analysis (). The primary etiology/site of sepsis was a lung infection. One hundred and twelve patients (60.8%) were transferred from an emergency department or admitted directly to the intensive care unit.
Table 1. Characteristics of the study population.
Identification of subphenotypes
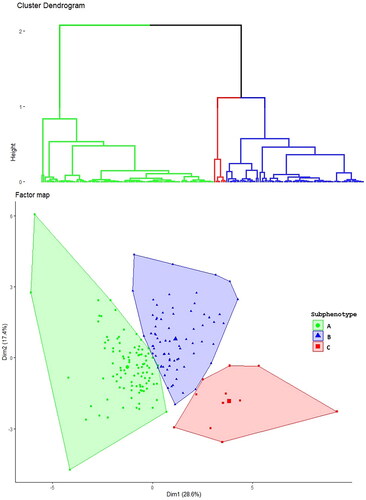
An analysis of the indices’ frequency showed that the optimal number of distinct subphenotypes was three (Supplemental Figure 1). The hierarchical clustering dendrogram is shown in , and the factor map with individuals in clusters is shown in .
Figure 1. Cluster identification. The upper figure shows the hierarchical clustering dendrogram with three clusters. The lower figure shows the factor map from the principal component analysis. Each individual is represented by label, depending on the cluster: a green circle (subphenotype A), a blue triangle (subphentopye B), or a red square (subphenotype C).
Comparison of the subphenotypes
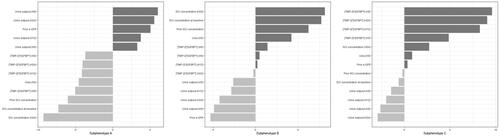
The three subphenotypes did not differ significantly with regard to the admission pathway or the etiology of the sepsis (). Vtest graphs revealed the various candidate variables that differed significantly for the subphenotypes, when compared with the study population as a whole (). Comparative data on the SCr level, UO, and [TIMP-2]*[IGFBP7] level in the various subphenotypes are shown in Supplemental Figure 2.
Figure 2. Vtest graph, showing the variables that contribute to the different subphenotypes. The Vtest graph characterizes the groups in terms of the variables whose average is lower or higher than in the total sample. Each bar represents the distance (in multiples of the standard deviation) between the within-class mean value and the total cohort mean value. TIMP-2: tissue inhibitor of metalloproteinases-2; IGFBP-7: insulin-like growth factor-binding protein 7; SCr: serum creatinine; eGFR: estimated glomerular filtration rate.
The subphenotype A group comprised 99 (53.8%) patients and was characterized by less severe AKI at admission (stage 1 AKI in 66% of the patients). Compared with the study population as a whole, subphenotype A patients presented a higher UO (median [IQR]: 1.21 [0.58–2.92] mL/kg), a lower urine [TIMP-2]*[IGFBP7] level (median [IQR]: 0.75 [0.18– 1.87] (ng/mL)2/1000 and a lower SCr level (median [IQR] 118: [93– 150] µmol/L) on inclusion. Overall, these patients were less severely ill, as indicated by a lower lactate level or a lower SOFA score on inclusion. During the first 24 h, only one patient initiated RRT, and kidney function normalized in 52 (54%) patients.
The subphenotype B group comprised 74 (40.2%) patients. This group had the highest prevalence of CKD and the worst kidney function, with a high SCr level (median [IQR]: 216 [170, 281] µmo/L) and a low UO (median [IQR]: 0.56 [0.24–1.20] mL/kg/h). The absolute urine [TIMP-2]*[IGFBP7] values and the changes in these values did not distinguish the subphenotype B group from the study population as a whole (). Relative to subphenotype A, patients with subphenotype B had a similar non-renal SOFA score at inclusion but received a higher dose of norepinephrine and a greater volume of fluids over the first 24 h. Over the first 24 h, kidney function normalized in seven (9.4%) patients, and RRT was initiated in 14 (19%).
The subphenotype C group comprised 11 (6%) patients characterized by a very low UO and a very high urine [TIMP-2]*[IGFBP7] level (median [IQR]: 6.37 [4.19–14.80] (ng/mL)2/1000). The SCr and the blood urea nitrogen level on admission did not differ significantly from the values in the study population as a whole (). Subphenotype C patients were more severely ill, with a median [IQR] nonrenal SOFA score of 11 [Citation9–12]. Over the first 24 h, urine [TIMP-2]*[IGFBP7] levels remain very high, and most of the subphenotype C patients presented a rapid worsening of kidney function and persistent oliguria. These patients were the most severely ill, with a higher lactate level and a higher non-renal SOFA score at inclusion. Over the first 24 h, these patients received a greater volume of fluids and a higher dose of norepinephrine. Seven (78%) patients developed stage 3 AKI, and RRT was initiated in three (27%) of the latter.
The short-term outcome
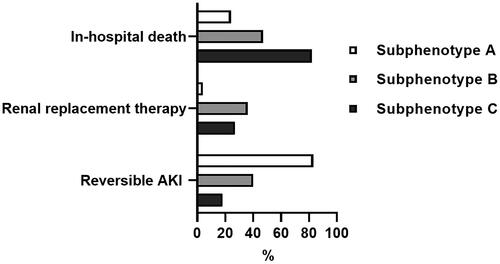
Within the first three days, 83 (84%), 30 (40%) and two (18%) patients in the subphenotype A, B and C groups presented a partial recovery (a decrement of at least one KDIGO stage) or a complete recovery of kidney function (p < 0.001). Within the first 7 d, RRT was initiated in four (4%), 27 (36%) and three (27%) patients in the subphenotype A, B, and C groups, respectively (p < 0.001). The proportions of patients with reversible AKI, RRT initiation and in-hospital death in the different subphenotype groups are shown in .
Figure 3. Proportions of patients with in-hospital death, renal replacement therapy initiation, and reversible AKI in the different subphenotype groups.
The unadjusted RRT-free survival curve is shown in . The crude 7-d RRT-free survival rate [95% CI] was, respectively, 91% [85–97], 50% [39–62], and 27% [10–72] for subphenotypes A, B, and C. After adjustment for confounding factors (age, renin–angiotensin system inhibitors, non-renal SOFA score at inclusion, lactate at inclusion, SAPS II, dobutamine support over the first 24 h, and fluid administered over the first 24 h), the 7-d RRT-free survival rate [95%CI] was, respectively, 85% [77–94], 59% [50–70], and 56% [34–79] for subphenotypes A, B, and C. The adjusted RRT-free survival curve is shown in . With subphenotype A as the reference, the adjusted hazard ratio (aHR) [95%CI] for the composite outcome (in-hospital death or RRT initiation) was 3.77 [1.92–7.42] (p < 0.001) for subphenotype B and 4.80 [1.67– 13.82] (p = 0.004) for subphenotype C.
Figure 4. Crude composite in-hospital survival (no death or RRT initiation) curve for the different subphenotypes.
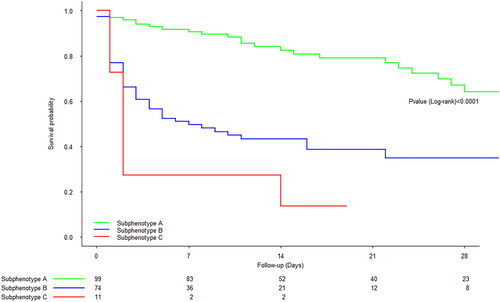
Figure 5. Adjusted composite in-hospital survival (no death or RRT initiation) curve for the different subphenotypes. With subphenotype A as the reference, the adjusted hazard ratio (aHR) [95%CI] for the composite in-hospital survival was 3.77 [1.92–7.42] (p < 0.001) for subphenotype B and 4.80 [1.67–13.82] (p = 0.004) for subphenotype C. Adjusted for age, renin–angiotensin system inhibitors, the nonrenal SOFA score at inclusion, lactate at inclusion, SAPS II, dobutamine support over the first 24 h, and fluid administered over the first 24 h.
![Figure 5. Adjusted composite in-hospital survival (no death or RRT initiation) curve for the different subphenotypes. With subphenotype A as the reference, the adjusted hazard ratio (aHR) [95%CI] for the composite in-hospital survival was 3.77 [1.92–7.42] (p < 0.001) for subphenotype B and 4.80 [1.67–13.82] (p = 0.004) for subphenotype C. Adjusted for age, renin–angiotensin system inhibitors, the nonrenal SOFA score at inclusion, lactate at inclusion, SAPS II, dobutamine support over the first 24 h, and fluid administered over the first 24 h.](/cms/asset/2a1fa822-13b7-4dc6-9c77-5e0ac905d3a3/irnf_a_2325640_f0005_c.jpg)
Respectively 24 (24%), 35 (47%) and nine (82%) patients in the subphenotype A, B, and C groups died during the hospital stay (p < 0.001). With subphenotype A as the reference and after adjustment for confounding factors, the aHR for in-hospital death was 2.07 [0.97– 4.41] (p = 0.058) for subphenotype B and 3.96 [1.37– 11.49] (p = 0.01) for subphenotype C (Supplemental Figure 2).
The biomarker’s contribution to diagnostic and predictive performances
To estimate the biomarker’s contribution to the classification process, we built another three clusters by using all the same variables other than the biomarker. Diagnostic performances were significantly better when the urine [TIMP-2]*[IGFBP7] values were integrated into the cluster-building process (VUS [95%CI]: 0.83 [0.75 − 0.91]), compared with the same process without the urine [TIMP-2]*[IGFBP7] values (VUS [95%CI]: 0.55 [0.38 − 0.71]). Including the urine [TIMP-2]*[IGFBP7] values also improved (albeit slightly) the cluster’s predictive performance (Supplemental Table 1).
Discussion
Most patients with septic shock have AKI at the time of diagnosis [Citation4,Citation19,Citation20]. In this population, the severity and course of AKI are correlated with mortality, early recovery of kidney function is associated with a better prognosis, and the progression of AKI is associated with a lower survival rate [Citation20,Citation21]. Early identification of patients with different AKI courses might enable individualized management and also better stratification in clinical trials of kidney-targeted therapies. In this study, we used an unsupervised clustering approach that combined kidney function variables and serial measurements of urine levels of an established kidney stress/damage biomarker. We identified three SA-AKI subphenotypes with different trajectories and short-term survival rates.
Subphenotype A (with a normal UO, a low SCr, a low urine [TIMP-2]*[IGFBP7] level, and a rapid improvement in kidney function) corresponds to a low likelihood of death or RRT initiation. Even though subphenotype B and subphenotype A had similar nonrenal SOFA scores, AKI was more severe and more persistent in subphenotype B patients; this led to higher RRT initiation rate and a greater likelihood of death. Subphenotype B patients might have been more susceptibility to the development of AKI – perhaps (at least in part) because of a higher baseline prevalence of conventional AKI risk factors (such as older age, underlying CKD, and previous exposure to renin–angiotensin system inhibitors [Citation22–25].
The small number of subphenotype C patients were characterized clinically by early-onset, severe oliguria but a relatively moderate elevation of SCr; this illustrates the limits of SCr-based estimations of AKI severity in patients receiving large amounts of intravenous fluids [Citation26]. There is a well-characterized association between the magnitude and duration of oliguria on one hand and the progression of SA-AKI on the other [Citation27,Citation28]. However, oliguria was also common in subphenotype B and, to a lesser extent, in subphenotype A (Supplemental Figure 2). This finding suggests that oliguria was influenced by different disease mechanisms, such as hypotension and hypovolemia [Citation29,Citation30]. The particularly high, sustained urine level of [TIMP-2]*[IGFBP7] distinguished subphenotype C from the other patients with oliguria. This elevated level might reflect very intense, prolonged kidney stress/damage as a result of more severe illness (reflected by a higher lactate level or a higher SOFA score), especially as baseline risk factors for AKI were infrequent in this group. This hypothesis is also supported by recent data showing that patients presenting greater endothelial dysfunction and a more intense inflammatory response are less likely to recover from SA-AKI in the short term [Citation31–33]. Subphenotype C had a significantly higher risk of early death (relative to phenotype A) and so could be categorized as “high risk”. Similarly, Molinari et al.’s ancillary analysis of the ProCESS study showed that with the same degree of AKI severity, a urine [TIMP-2]*[IGFBP7] level above 2.0 (ng/mL)2/1000 (the high-specificity cutoff for predicting AKI progression) was associated with a lower 30-d survival rate [Citation34]. Only continuous variables were included in this study; we reasoned that including a classification variable (the KDIGO stage, for example) or a predefined cutoff value would bias the cluster-building process. Our results suggest that a sustained, very high urine level of [TIMP-2]*[IGFBP7] is a potent warning sign of AKI progression and early death, as previously suggested by the Sapphire investigators [Citation35].
To the best of our knowledge, this study is the first to have combined functional variables with a clinically available biomarker in a clustering approach [Citation36]. Urine [TIMP-2]*[IGFBP7] is the best-studied biomarker in AKI. Even the individual performances of this biomarker did not improve prediction of persistent AKI in AKI-CHECK, other studies (including some conducted by our group) showed good levels of performance for predicting progression to severe AKI in various settings – including sepsis. In our cluster-building process, adding urine [TIMP-2]*[IGFBP7] improved the overall precision of classification and notably helped to discriminate between patients with seemingly similar AKI stages (based on the KDIGO criteria) but potentially different trajectories and prognoses, depending on the cluster to which they belonged. We identified various SA-AKI profiles with potentially different underlying disease mechanisms and outcomes, such as greater susceptibility to kidney damage in subphenotype B and more intense kidney damage in subphenotype C. The subphenotype was still associated with major adverse kidney events (RRT and in-hospital death) after adjustment for variables reflecting extrarenal organ dysfunction, such as the SOFA score and the SAPS-II. Sepsis is nevertheless a complex condition, and kidney-function-limited subphenotypes might not wholly reflect all the various organ dysfunction patterns involved in the patient’s prognosis [Citation37,Citation38].
Our study had several limitations. First, it was an unplanned analysis of previously collected data. Second, our study population was relatively small. This might have limited our ability to detect differences in survival rates in the subphenotype B in the adjusted analysis. Third, the fact that the study population presented AKI within 6 h of the diagnosis of septic shock (i.e., with the exclusion of those who developed AKI later than that) limits the generalizability of our results. Given the difficulty in determining the onset of sepsis and the resulting AKI, it is impossible to estimate the time window between the onset of kidney injury and the diagnosis of AKI. This time window probably affects the values and time course of the functional variables and the biomarker in our population. Although a full description of change in kidney function was not available after day 3, most patients who recover from AKI do so within 3 d [Citation39]. TIMP-2 and IGFBP7 assays are not available in all hospitals, which limit the use of our clustering approach in routine clinical practice. Lastly, the study results were not validated externally in another cohort.
In conclusion, we identified three distinct SA-AKI subphenotypes (with different short-term trajectory and survival rates) by combining conventional kidney function indicators with urine measurements of a cell-cycle arrest biomarker.
This approach might be useful for better-stratifying patients in the early phases of septic shock but needs to be confirmed in a larger, independent cohort.
Ethics approval and consent to participate
The study protocol was approved by an independent ethics committee (CPP Nord Ouest II, Amiens, France; reference: 2015-A01392-47). Patients and their surrogates were informed of the study’s objectives and procedures and consented to participation.
Consent for publication
Not applicable.
Author contributions
Conception and design of the study: DTB and JM. Inclusion and acquisition of data: DTB, JM, DD, LVV, GB, CB, KK, and CV. Analysis and interpretation of data: DTB, MD, JM, and YZ. Preparation of the manuscript: DTB and JM. All authors read and approved the final manuscript.
Availability of data and material
The datasets used and/or analyzed in this study are available from the corresponding author on request.
Supplemental Material
Download PDF (136.1 KB)Acknowledgments
Some of these results were presented as an e-Poster at the ESICM 2023 Congress. An earlier version of the manuscript has been posted as a preprint at https://doi.org/10.21203/rs.3.rs-2894389/v1.
Disclosure statement
The authors declare that they have no competing interests.
References
- Uchino S, Kellum JA, Bellomo R, et al. Acute renal failure in critically ill patients: a multinational, multicenter study. JAMA. 2005;294(7):1–10. doi: 10.1001/jama.294.7.813.
- Hoste EAJ, Schurgers M. Epidemiology of acute kidney injury: how big is the problem? Crit Care Med. 2008;36(4):S146–S151. doi: 10.1097/CCM.0b013e318168c590.
- Hoste EAJ, Bagshaw SM, Bellomo R, et al. Epidemiology of acute kidney injury in critically ill patients: the multinational AKI-EPI study. Intensive Care Med. 2015;41(8):1411–1423. doi: 10.1007/s00134-015-3934-7.
- Peters E, Antonelli M, Wittebole X, et al. A worldwide multicentre evaluation of the influence of deterioration or improvement of acute kidney injury on clinical outcome in critically ill patients with and without sepsis at ICU admission: results from the intensive care over nations audit. Crit Care. 2018;22(1):188. doi: 10.1186/s13054-018-2112-z.
- Kellum JA, Lameire N. Diagnosis, evaluation, and management of acute kidney injury: a KDIGO summary (part 1). Crit Care. 2013;17(1):204. doi: 10.1186/cc11454.
- Honore PM, Nguyen HB, Gong M, et al. Urinary tissue inhibitor of metalloproteinase-2 and insulin-like growth factor-binding protein 7 for risk stratification of acute kidney injury in patients with sepsis. Crit Care Med. 2016;44(10):1851–1860. doi: 10.1097/CCM.0000000000001827.
- Maizel J, Daubin D, Vong LV, et al. Urinary TIMP2 and IGFBP7 identifies high risk patients of short-term progression from mild and moderate to severe acute kidney injury during septic shock: a prospective cohort study. Dis Markers. 2019;2019:3471215–3471218. doi: 10.1155/2019/3471215.
- Fiorentino M, Xu Z, Smith A, et al. Serial measurement of cell-cycle arrest biomarkers [TIMP-2] · [IGFBP7] and risk for progression to death, dialysis, or severe acute kidney injury in patients with septic shock. Am J Respir Crit Care Med. 2020;202(9):1262–1270. doi: 10.1164/rccm.201906-1197OC.
- Meersch M, Schmidt C, Hoffmeier A, et al. Prevention of cardiac surgery-associated AKI by implementing the KDIGO guidelines in high risk patients identified by biomarkers: the PrevAKI randomized controlled trial. Intensive Care Med. 2017;43(11):1551–1561. doi: 10.1007/s00134-016-4670-3.
- Göcze I, Jauch D, Götz M, et al. Biomarker-guided intervention to prevent acute kidney injury after major surgery: the prospective randomized BigpAK study. Ann Surg. 2018;267(6):1013–1020. doi: 10.1097/SLA.0000000000002485.
- Ostermann M, Zarbock A, Goldstein S, et al. Recommendations on acute kidney injury biomarkers from the acute disease quality initiative consensus conference: a consensus statement. JAMA Netw Open. 2020;3(10):e2019209. doi: 10.1001/jamanetworkopen.2020.19209.
- Titeca-Beauport D, Daubin D, Van Vong L, et al. Urine cell cycle arrest biomarkers distinguish poorly between transient and persistent AKI in early septic shock: a prospective, multicenter study. Crit Care. 2020;24(1):280. doi: 10.1186/s13054-020-02984-6.
- Bone RC, Balk RA, Cerra FB, et al. Definitions for sepsis and organ failure and guidelines for the use of innovative therapies in sepsis. The ACCP/SCCM consensus conference committee. American college of chest physicians/society of critical care medicine. Chest. 1992;101(6):1644–1655. doi: 10.1378/chest.101.6.1644.
- Singer M, Deutschman CS, Seymour CW, et al. The third international consensus definitions for sepsis and septic shock (sepsis-3). JAMA. 2016;315(8):801–810. doi: 10.1001/jama.2016.0287.
- Le Gall JR, Lemeshow S, Saulnier F. A new simplified acute physiology score (SAPS II) based on a European/North American multicenter study. JAMA. 1993;270(24):2957–2963. doi: 10.1001/jama.270.24.2957.
- Vincent JL, Moreno R, Takala J, et al. The SOFA (sepsis-related organ failure assessment) score to describe organ dysfunction/failure. On behalf of the working group on sepsis-related problems of the European Society of Intensive Care Medicine. Intensive Care Med. 1996;22(7):707–710. doi: 10.1007/BF01709751.
- Denz R, Klaaßen-Mielke R, Timmesfeld N. A comparison of different methods to adjust survival curves for confounders. Stat Med. 2023;42(10):1461–1479. doi: 10.1002/sim.9681.
- Waegeman W, De Baets B, Boullart L. ROC analysis in ordinal regression learning. Pattern Recog Lett. 2008;29(1):1–9. doi: 10.1016/j.patrec.2007.07.019.
- Bagshaw SM, Uchino S, Bellomo R, et al. Septic acute kidney injury in critically ill patients: clinical characteristics and outcomes. Clin J Am Soc Nephrol. 2007;2(3):431–439. doi: 10.2215/CJN.03681106.
- Sood MM, Shafer LA, Ho J, et al. Early reversible acute kidney injury is associated with improved survival in septic shock. J Crit Care. 2014;29(5):711–717. doi: 10.1016/j.jcrc.2014.04.003.
- Truche AS, Ragey SP, Souweine B, et al. ICU survival and need of renal replacement therapy with respect to AKI duration in critically ill patients. Ann Intensive Care. 2018;8(1):127. doi: 10.1186/s13613-018-0467-6.
- Bagshaw SM, George C, Bellomo R. Early acute kidney injury and sepsis: a multicentre evaluation. Crit Care. 2008;12(2):R47. doi: 10.1186/cc6863.
- Bagshaw SM, Lapinsky S, Dial S, et al. Acute kidney injury in septic shock: clinical outcomes and impact of duration of hypotension prior to initiation of antimicrobial therapy. Intensive Care Med. 2009;35(5):871–881. doi: 10.1007/s00134-008-1367-2.
- Plataki M, Kashani K, Cabello-Garza J, et al. Predictors of acute kidney injury in septic shock patients: an observational cohort study. Clin J Am Soc Nephrol. 2011;6(7):1744–1751. doi: 10.2215/CJN.05480610.
- Flannery AH, Kiser AS, Behal ML, et al. RAS inhibition and sepsis-associated acute kidney injury. J Crit Care. 2022;69:153986. doi: 10.1016/j.jcrc.2022.153986.
- Macedo E, Bouchard J, Soroko SH, et al. Fluid accumulation, recognition and staging of acute kidney injury in critically-ill patients. Crit Care. 2010;14(3):R82. doi: 10.1186/cc9004.
- Macedo E, Malhotra R, Bouchard J, et al. Oliguria is an early predictor of higher mortality in critically ill patients. Kidney Int. 2011;80(7):760–767. doi: 10.1038/ki.2011.150.
- Leedahl DD, Frazee EN, Schramm GE, et al. Derivation of urine output thresholds that identify a very high risk of AKI in patients with septic shock. Clin J Am Soc Nephrol. 2014;9(7):1168–1174. doi: 10.2215/CJN.09360913.
- Prowle JR, Liu YL, Licari E, et al. Oliguria as predictive biomarker of acute kidney injury in critically ill patients. Crit Care. 2011;15(4):R172. doi: 10.1186/cc10318.
- Klein SJ, Lehner GF, Forni LG, et al. Oliguria in critically ill patients: a narrative review. J Nephrol. 2018;31(6):855–862. doi: 10.1007/s40620-018-0539-6.
- Bhatraju PK, Zelnick LR, Herting J, et al. Identification of acute kidney injury subphenotypes with differing molecular signatures and responses to vasopressin therapy. Am J Respir Crit Care Med. 2019;199(7):863–872. doi: 10.1164/rccm.201807-1346OC.
- Wiersema R, Jukarainen S, Vaara ST, et al. Two subphenotypes of septic acute kidney injury are associated with different 90-day mortality and renal recovery. Crit Care. 2020;24(1):150. doi: 10.1186/s13054-020-02866-x.
- Uhel F, Peters-Sengers H, Falahi F, the MARS consortium., et al. Mortality and host response aberrations associated with transient and persistent acute kidney injury in critically ill patients with sepsis: a prospective cohort study. Intensive Care Med. 2020;46(8):1576–1589. doi: 10.1007/s00134-020-06119-x.
- Molinari L, Del Rio-Pertuz G, Smith A, et al. Utility of biomarkers for sepsis-associated acute kidney injury staging. JAMA Netw Open. 2022;5(5):e2212709. doi: 10.1001/jamanetworkopen.2022.12709.
- Kashani K, Al-Khafaji A, Ardiles T, et al. Discovery and validation of cell cycle arrest biomarkers in human acute kidney injury. Crit Care. 2013;17(1):R25. doi: 10.1186/cc12503.
- Vaara ST, Bhatraju PK, Stanski NL, et al. Subphenotypes in acute kidney injury: a narrative review. Crit Care. 2022;26(1):251. doi: 10.1186/s13054-022-04121-x.
- Knox DB, Lanspa MJ, Kuttler KG, et al. Phenotypic clusters within sepsis-associated multiple organ dysfunction syndrome. Intensive Care Med. 2015;41(5):814–822. doi: 10.1007/s00134-015-3764-7.
- Seymour CW, Kennedy JN, Wang S, et al. Derivation, validation, and potential treatment implications of novel clinical phenotypes for sepsis. JAMA. 2019;321(20):2003–2017. doi: 10.1001/jama.2019.5791.
- Uchino S, Bellomo R, Bagshaw SM, et al. Transient azotaemia is associated with a high risk of death in hospitalized patients. Nephrol Dial Transplant. 2010;25(6):1833–1839. doi: 10.1093/ndt/gfp624.