
Abstract
Background
Renal dysfunction leads to poor prognosis of patients with coronary artery disease (CAD). Current studies have reported the prognosis or mortality of various diseases using different estimated glomerular filtrate rate (eGFR) formulas, while the performance of these equations is unclear in CAD patients. We aim to evaluate the predict effect of creatinine-based eGFR (eGFRcr), cystatin C-based eGFR (eGFRcys), and both creatinine and cystatin C-based eGFR (eGFRcr-cys) in CAD patients.
Methods
A total of 23,178 patients with CAD were included from CIN-II cohort study. The association of eGFRcr, eGFRcys and eGFRcr-cys with cardiovascular and all-cause mortality was detected by Cox regression analysis. The predictive effect of eGFRcr, eGFRcys and eGFRcr-cys on mortality was assessed.
Results
During a median follow up of 4.3 years, totally 2051 patients (8.8%) experience all-cause mortality, of which 1427 patients (6.2%) died of cardiovascular disease. For the detection of cardiovascular mortality among CAD patients, eGFRcr-cys had high discriminatory capacity with area under the curve (AUC) in receiver operator characteristic analysis of 0.730, which was significantly better than eGFRcr (AUC = 0.707, p < 0.001) and eGFRcys (AUC = 0.719, p < 0.001). Similar results were observed in all-cause mortality. Restricted cubic spline showed a U-shaped association between eGFRcr and all outcomes in patients with both reduced and supranormal eGFR levels, while a L-shaped association in eGFRcys and eGFRcr-cys.
Conclusions
Estimated GFR based on both creatinine and cystatin C has highest predictive effect for cardiovascular and all-cause mortality among CAD patients. Meanwhile, supranormal eGFRcr may indicate a higher risk of mortality.
Introduction
Coronary artery disease (CAD) is a leading cause of global mortality and a major contributor to morbidity [Citation1]. Impaired renal function is a major risk factor for CAD, with high prevalence and often accompanying by other risk factors, which further causes the poor prognosis [Citation2].
Assessment of renal function in CAD is essential for patients’ outcomes, and glomerular filtrate rate (GFR) is the most useful index of renal function. GFR plays a central role in chronic kidney disease (CKD) diagnosis and management as well as in appropriate medication dosing [Citation3]. The gold standard for evaluating renal function is directly measured GFR (mGFR), while this method is invasive and may be too impractical and costly for large-scale application [Citation4]. Currently, estimated GFR (eGFR) is commonly used as a surrogate for mGFR in clinical practice, and most extensively used eGFR is calculated by serum creatinine (eGFRcr).
All along, studies have pointed out eGFRcr will affect by muscle mass, protein consumption, physical activity and ethnicity, and have proposed using eGFR based on the cystatin C (eGFRcys) as an alternative to eGFRcr [Citation5,Citation6]. However, steroid use, thyroid disease, diabetes, systemic inflammation and adiposity will affect the eGFRcys levels. Therefore, some studies suggest that an eGFR by combining the creatinine and cystatin C levels (eGFRcr-cys) can be a better assess for the status of renal function in old subjects or African participants [Citation7–9].
Currently, there is uncertainty as to which estimating equation should guide clinical practice in situations of large discordances in CAD patients. Therefore, we aim to conduct this study to assess the performance of eGFRcys (CKD-EPI 2012) and eGFRcr-cys (CKD-EPI 2012) against eGFRcr (CKD-EPI 2009) in predicting all-cause and cardiovascular mortality in patients with CAD.
Methods
Study design and population
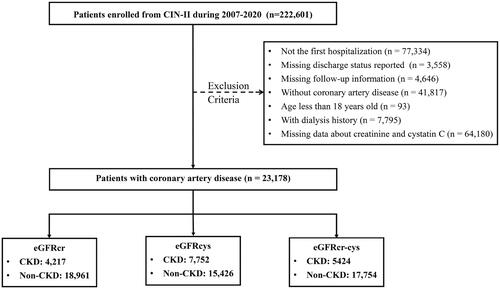
This retrospective and multi-center study included patients from the registry cohort of Cardiorenal ImprovemeNt II (CIN-II, NCT05050877) during 2007 to 2020 in five south Chinese tertiary teaching hospitals, which covered 145,267 subjects undergoing coronary catheterization [Citation10]. Patients meeting the following criteria were included: 1) age ≥18 years; 2) with CAD; 3) hospitalized for the first time. Patients meeting the following criteria were excluded: 1) death in the hospital; 2) with dialysis; 3) insufficient or missing important laboratory data (creatinine and cystatin C); 4) missing follow-up information. Finally, 23,178 CAD patients were included in final analysis (see ).
Figure 1. Flow diagram.
Abbreviation: CKD: chronic kidney disease; eGFR: estimated glomerular filtration rate; eGFRcr: creatinine-based eGFR; eGFRcys: cystatin C-based eGFR; eGFRcr-cys: creatinine and cystatin C–based eGFR
The study protocol was approved by the Guangdong Provincial People’s Hospital ethics committee (No.GDREC2019-555H-2), all participating sites received institutional review board approval from their own ethics committees, and the study was performed according to the declaration of Helsinki.
Data collection
The in-hospital patient data was collected from the Electronic Clinical Management System, mainly including six sections: demographic information, medical history, laboratory examination, operations, medication, and discharge status. Creatinine and cystatin C data extracted at initial admission were analyzed, and measured using the same laboratory methods. The creatinine assay was calibrated to the isotope Dilution Mass Spectroscopy (IDMS) method using the National Institute of Standards and Technology (NIST) Reference material SRM 967 (Beckman Coulter AU5800, Brea CA, USA), and cystatin C can be traceable to reference material GBW(E)090437 (Beckman Coulter AU5800, Brea CA, USA). The follow-up information was obtained by matching the survival information from Centers for Disease Control and Prevention. Senior cardiologists periodically carried out data quality control.
Outcomes and measurements
The main outcome of the study were all-cause mortality and cardiovascular mortality (ICD-10. codes: I00-I99, Q20-Q28, N00-N08, N10-N16, N17-N19), which is obtained from the system of survival. eGFR was calculated using Chronic Kidney Disease Epidemiology Collaboration (CKD-EPI) (Supplemental Table 1) [Citation11]. CAD was confirmed by coronary angiography and discriminated according to the 10th Revision Codes of the International Classification of Diseases. Congestive heart failure was defined as the discharge diagnosis and New York Heart Association class >2 or Killip class >1 [Citation12]. CKD was defined by eGFR ≤60 mL/min/1.73m2 [Citation13]. Anemia was defined using baseline hematocrit value <39% for men and <36% for women according to World Health Organization criteria [Citation14]. Renal hyperfiltration was defined as eGFR >95th percentile after stratification for sex and age for healthy subjects (Supplemental Figure 1) [Citation15,Citation16]. Diabetes mellitus (DM) was assessed based on the discharge diagnosis, glycated hemoglobin (HbA1c) levels of ≥ 6.5%, or the use of a hypoglycemic agent or insulin for treatment. Acute myocardial infarction (AMI) and hypertension (HT) were defined based on the criteria outlined in the ICD-10 classification system.
Statistical analysis
These patients were divided into 3 groups according to their eGFR level, which was defined by eGFRcr, eGFRcys or eGFRcr-cys: 1). >90 mL/min/1.73m2; 2). eGFR between 60-90 mL/min/1.73m2; 3). eGFR between 30–60 mL/min/1.73m2; 4). eGFR between ≤30 mL/min/1.73m2.
The continuous variables were described by means ± standard deviation (SD) or median [interquartile ranges (IQRs)], and categorical variables were presented as counts and proportions. One-way anova, Kruskal-Wallis and chi-square tests were used to compare the differences between groups as appropriate.
Restricted cubic spline and multivariable cox proportion hazard regression analyses were performed to determine the relationship between eGFR and study outcomes. Characteristic variables with significant univariable analysis differences and clinical significance were adjusted in final multivariable regression models, including age, gender, hypertension, diabetes mellitus, congestive heart failure, atrial fibrillation, stroke, anemia, percutaneous coronary intervention and low density lipoprotein cholesterol. The hazard ratio (HR) with 95% confidence interval (CI) and P-values were calculated. Receiver operating characteristic curves (ROC) were to determine the prediction of eGFR for outcomes. DeLong’s test was performed to determine the difference between the prediction for the risk of mortality of eGFRcr, eGFRcys and eGFRcr-cys. Besides, sensitive analysis was conducted to explore the association between glomerular hyperfiltration status and the risk of mortality. Given the strong association between obesity and hyperfiltration, we further adjusted BMI as confounders to assess the association between eGFR and mortality. (Supplemental Table 3) Two-sided P-value <0.05 indicated significance for all analyses. All statistical analyses were performed using R version 4.0.3 software.
Results
Baseline characteristics
Of the 23,178 participants were included (5646 female [24.4%]; mean age ± SD: 63.6 ± 11.0 years, age range from 19 to 98 years). Totally 8026 (34.6%) patients were diagnosed as diabetes mellitus, 7065 (30.8%) with anemia, 6351 (27.4%) with acute myocardial infarction and 13,044 (56.3%) with hypertension. According to eGFRcr, eGFRcys and eGFRcr-cys, the mean values of eGFR were 79.0, 71.6 and 75.1 respectively. (Supplemental Table 2)
Based on eGFRcr, 3714 (16.0%) patients were diagnosed with eGFR 30-60 mL/min/1.73m2, and 503 (2.2%) patients were diagnosed with eGFR ≤30 mL/min/1.73m2. According to eGFRcys, a larger group of 6823 (29.4%) patients were diagnosed with eGFR 30–60 mL/min/1.73m2, and 929 (4.0%) patients were diagnosed with eGFR ≤30 mL/min/1.73m2. Using eGFRcr-cys, 4806 (20.7%) patients were diagnosed with eGFR 30-60 mL/min/1.73m2, and 618 (2.7%) patients were diagnosed with eGFR ≤30 mL/min/1.73m2. With the progression of CKD, the incidence of comorbidities increased significantly, such as congestive heart failure, hypertension and diabetes, regardless of the eGFR equations. Detailed information was provided in .
Table 1. Baseline characteristics of CAD patients based on eGFR level.
The association of the eGFR with the risk of the mortality
During a median follow up of 4.3 years, 2051 (8.8%) experienced all-cause mortality, of which 1427 (6.2%) died for cardiovascular disease. With CKD progress, patients had higher cardiovascular and all-cause mortality. The HRs of cardiovascular mortality were 1.26 (p < 0.001) for per 10 units eGFRcr decrease, 1.27 (p < 0.001) for per 10 units eGFRcys decrease, and 1.31 (p < 0.001) for per 10 units eGFRcr-cys decrease. In addition, compared to patients with eGFR > 90 mL/min/1.73m2, patients with eGFR between 60-90 mL/min/1.73m2 (for eGFRcr: HR = 1.47, p < 0.001; for eGFRcys: HR = 1.43, p < 0.001; for eGFRcr-cys: HR = 1.64, p < 0.001), eGFR between 30–60 mL/min/1.73m2 (for eGFRcr: HR = 2.60, p < 0.001; for eGFRcys: HR = 2.61, p < 0.001; for eGFRcr-cys: HR = 3.28, p < 0.001) and eGFR ≤ 30 mL/min/1.73m2 (for eGFRcr: HR = 5.65, p < 0.001; for eGFRcys: HR = 5.78, p < 0.001; for eGFRcr-cys: HR = 7.44, p < 0.001) had higher risk of cardiovascular mortality. Similar results were observed in all-cause mortality ().
Table 2. Association of eGFRcr, eGFRcys and eGFRcr-cys with mortality.
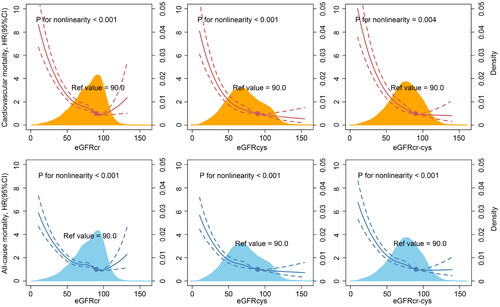
The restricted cubic splines curves showed a U-shape relationship between eGFRcr and the risks of cardiovascular and all-cause mortality in the whole CAD patients. Conversely, eGFRcys and eGFRcr-cys demonstrated a L-shaped relationship (). Therefore, we preformed sensitive analysis to observe the association between renal hyperfiltration and outcomes. Patients with renal hyperfiltration had a higher risk cardiovascular mortality (HR = 1.29, p = 0.001) and all-cause mortality (HR = 1.14, p = 0.029) than those without renal hyperfiltration and eGFRcr >60 mL/min/1.73m2. However, there was no significant difference in renal hyperfiltration defined by eGFRcys and eGFRcr-cys. (Supplemental Table 5)
Figure 2. Association between eGFR with cardiovascular and all-cause mortality.
Abbreviation: eGFRcr, creatinine-based eGFR; eGFRcys, cystatin C-based eGFR; eGFRcr-cys, creatinine and cystatin C–based eGFR
The prediction of the eGFR for the risk of the mortality
The area under the curves (AUC) of eGFRcr and eGFRcys for predicting cardiovascular mortality were 0.707 (95% CI: 0.693–0.721) and 0.719 (95% CI: 0.706–0.734), respectively. When creatinine and cystatin C were combined to calculate eGFR, the AUC for predicting cardiovascular mortality was 0.730 (95%CI: 0.717–0.743), and the differences in AUC between eGFRcr, eGFRcys, and eGFRcr-cys in pairwise comparisons were statistically significant (p < 0.001). Similar results were observed in all-cause mortality ().
Table 3. Predictive effect of eGFRcr, eGFRcys and eGFRcr-cys on mortality.
Discussion
In this study, our findings reveal that decrease eGFR is associated with the risk of cardiovascular and all-cause mortality among CAD patients, regardless the equations. However, compared to eGFR calculated by creatinine or cystatin C alone, eGFRcr-cys has better effect on predicting mortality. Furthermore, we observe a U-shaped association between eGFRcr and mortality, which may mean that eGFRcr can better reflect the prognosis of patients with hyperfiltration.
Renal function impairment is common in patients with CAD, while the risks are often underestimated [Citation2]. In our study, we include patients with CAD and assess the efficacy of different equations of eGFR in predicting mortality. We identify eGFRcr-cys as a better predictor of mortality compared with eGFRcr or eGFRcys. In addition, patients are classified in the eGFR level, and the hazard ratio for cardiovascular and all-cause mortality increases with eGFR decline linearly. Regardless of the equations, the reduction in eGFR is associated with an increased risk of mortality.
Currently, due to the high medical cost of mGFR, it cannot be used in clinical practice on a large scale, and eGFRcr has been widely used as an alternative indicator. Results from our study showed eGFRcr-cys can be a better predictor for cardiovascular and all-cause mortality among CAD patients compared with eGFRcr. These results are consistent with previous studies among patients with CAD or heart failure [Citation17,Citation18]. However, in these studies, GFR is estimated by Cockcroft–Gault and MDRD equations. Considering the situation of GFR estimation in Chinese hospitals, we evaluate the predictive effect on cardiovascular and all-cause mortality in patients with CAD using eGFRcr (CKD-EPI 2009), eGFRcys (CKD-EPI 2012) and eGFRcr-cys (CKD-EPI 2012).
Beyond our expectation, according to the RCS curves and subgroup analysis, eGFRcr shows a U-shaped association with cardiovascular and all-cause mortality. This result may mean CAD patients with supranormal eGFRcr levels, i.e. hyperfiltration state, also have high risk of mortality, which is consistent with previous reports [Citation19,Citation20]. Furthermore, given that this U-shaped association may be caused by the overestimation of GFR in patients with low muscle mass, such as in those with chronic inflammation and malnutrition, Park et al. adjusted for muscle mass and still found that hyperfiltration can increase the risk of all-cause mortality [Citation16,Citation21]. Glomerular hyperfiltration has been reported as a possible risk factor for coronary artery calcification in patients with CAD, while high GFR is also associated with total carotid plaque area and left ventricular hypertrophy, which increases the risk of mortality [Citation22,Citation23]. Therefore, we speculate that eGFRcr may better reflect the prognosis of patients in hyperfiltration state than the other two indicators.
Notably, our study only includes Chinese patients, and do not consider the effect of other races on the eGFR equation. In fact, eGFRcr will affect by patients’ races, which makes it not a consistent predictor across races [Citation5]. In patients from European countries, a considerable difference exists in point estimates of creatinine- and cystatin C-based CKD definition, and eGFRcys shows more accurate risk estimates and has better prognostic value compared to eGFRcr [Citation24]. However, in African populations, creatinine-based equations perform slightly better in patients with CKD than cystatin C [Citation25]. Results of our study evaluate the predictive effect of creatinine- and cystatin C- based eGFR equations for mortality in a Chinese population of patients with CAD.
Our study demonstrated that GFR equation on the basis of both creatinine and cystatin C is better than equation defined by single index among CAD patients. Although current clinical recommendations for GFR evaluation include measurement of serum creatinine and use of a GFR estimating equation for most patients, additional confirmation with combined cystatin C is recommended for groups in whom creatinine-based eGFR is known to be less accurate, especially when it is likely to influence important clinical decisions. In addition, for patients in hyperfiltration state, eGFRcr may better predicator on prognosis than the other two indicators. Further studies are merited to assess the overall cost-benefit balance of measuring cystatin C for all patients with CAD.
Limitation
This study has some limitations. Firstly, due to the nature of retrospective analysis, this study lacks data on potential confounders such as body mass index. Secondly, only single creatinine or cystatin C measurements at first admission are used to define eGFR without the data about the follow-up change. Still, the unaffected data collected at the time of admission is more representative. In addition, we are limited by the lack of baseline mGFR, and cannot compare estimating equations to a ‘gold standard’. However, the aim of this study is to assess primarily the predictive effect of estimating equations on cardiovascular and all-cause mortality in Chinese hospital, where few people have a measured GFR, rather than the accuracy of the estimating equations.
Conclusion
Among CAD patients, eGFRcr-cys has highest predictive capability for cardiovascular and all-cause mortality, while eGFRcr may reflect the risk of cardiovascular and all-cause mortality among patients with CAD in the hyperfiltration state. Further studies are needed to verify the accuracy of the estimating equations among CAD patients.
Ethical approval
The study protocol was approved by the Guangdong Provincial People’s Hospital ethics committee (No.GDREC2019-555H-2), all participating sites received institutional review board approval from their own ethics committees, and the study was performed according to the declaration of Helsinki. All the data used in this study were anonymized before its use. Since our study included retrospective cases, there was no additional intervention, and all patient information was desensitized.
Authors’ contributions
SQC and YL and were responsible for the study concept and data collection. YL, XG and DMW were responsible for study design. Data extraction was undertaken by SQC and ZGH. YZ, GXL and WYW were responsible for data analysis and intellectual direction. Drafting of the manuscript: YZ, GXL, LLS and YWG. All authors read and approved the final manuscript.
Supplemental Material
Download MS Word (611.1 KB)Acknowledgement
None.
Disclosure statement
No potential conflict of interest was reported by the author(s).
Data availability statement
The datasets used and/or analyzed during the current study are available from the corresponding author on reasonable request.
Additional information
Funding
References
- Roth GA, Mensah GA, Johnson CO, et al. Global burden of cardiovascular diseases and risk factors, 1990-2019: update from the GBD 2019 study. J Am Coll Cardiol. 2020;76(25):1–8. doi: 10.1016/j.jacc.2020.11.010.
- Sarnak MJ, Amann K, Bangalore S, et al. Chronic kidney disease and coronary artery disease: JACC state-of-the-Art review. J Am Coll Cardiol. 2019;74(14):1823–1838. doi: 10.1016/j.jacc.2019.08.1017.
- Zou LX, Sun L, Nicholas SB, et al. Comparison of bias and accuracy using cystatin C and creatinine in CKD-EPI equations for GFR estimation. Eur J Intern Med. 2020;80:29–34. doi: 10.1016/j.ejim.2020.04.044.
- Fabian J, Kalyesubula R, Mkandawire J, et al. Measurement of kidney function in Malawi, South Africa, and Uganda: a multicentre cohort study. Lancet Glob Health. 2022;10(8):e1159–e69. doi: 10.1016/S2214-109X(22)00239-X.
- Stevens KI, Lees JS. Measure and risk: cystatin C, creatinine and controversy in CKD. Nephrol Dial Transplant. 2023;38(8):1785–1788. doi: 10.1093/ndt/gfad113.
- Khan I, Khan AH, Adnan AS, et al. Comparison of cystatin C and creatinine-based estimated glomerular filtration rate equations among elderly chronic kidney disease patients attending a tertiary care hospital: a prospective cross-sectional study. Clin Nephrol. 2020;93(5):217–226. doi: 10.5414/CN109573.
- Fan L, Levey AS, Gudnason V, et al. Comparing GFR estimating equations using cystatin C and creatinine in elderly individuals. J Am Soc Nephrol. 2015;26(8):1982–1989. doi: 10.1681/ASN.2014060607.
- Fu EL, Levey AS, Coresh J, et al. Accuracy of GFR estimating equations in patients with discordances between creatinine and cystatin C-based estimations. J Am Soc Nephrol. 2023;34(7):1241–1251. doi: 10.1681/ASN.0000000000000128.
- Nateghi Haredasht F, Viaene L, Vens C, et al. Comparison between cystatin C- and creatinine-based estimated glomerular filtration rate in the follow-up of patients recovering from a stage-3 AKI in ICU. J Clin Med. 2022;11(24):7264. doi: 10.3390/jcm11247264.
- Chen SQ, Liu J, Zhou Y, et al. Sex differences in characteristics, treatments, and in-hospital outcomes of patients undergoing coronary angiography or intervention. Front Cardiovasc Med. 2022;9:878566. doi: 10.3389/fcvm.2022.878566.
- Inker LA, Schmid CH, Tighiouart H, et al. Estimating glomerular filtration rate from serum creatinine and cystatin C. N Engl J Med. 2012;367(1):20–29. doi: 10.1056/NEJMoa1114248.
- McKee PA, Castelli WP, McNamara PM, et al. The natural history of congestive heart failure: the Framingham study. N Engl J Med. 1971;285(26):1441–1446. doi: 10.1056/NEJM197112232852601.
- Levey AS, Stevens LA, Schmid CH, et al. A new equation to estimate glomerular filtration rate. Ann Intern Med. 2009;150(9):604–612. doi: 10.7326/0003-4819-150-9-200905050-00006.
- Nutritional anaemias. Report of a WHO scientific group. World Health Organ Tech Rep Ser. 1968;405:5–37.
- Helal I, Fick-Brosnahan GM, Reed-Gitomer B, et al. Glomerular hyperfiltration: definitions, mechanisms and clinical implications. Nat Rev Nephrol. 2012;8(5):293–300. doi: 10.1038/nrneph.2012.19.
- Park M, Yoon E, Lim YH, et al. Renal hyperfiltration as a novel marker of all-cause mortality. J Am Soc Nephrol. 2015;26(6):1426–1433. doi: 10.1681/ASN.2014010115.
- Ix JH, Shlipak MG, Chertow GM, et al. Association of cystatin C with mortality, cardiovascular events, and incident heart failure among persons with coronary heart disease: data from the heart and soul study. Circulation. 2007;115(2):173–179. doi: 10.1161/CIRCULATIONAHA.106.644286.
- Naruse H, Ishii J, Kawai T, et al. Cystatin C in acute heart failure without advanced renal impairment. Am J Med. 2009;122(6):566–573. doi: 10.1016/j.amjmed.2008.10.042.
- Dupuis ME, Nadeau-Fredette AC, Madore F, et al. Association of glomerular hyperfiltration and cardiovascular risk in Middle-Aged healthy individuals. JAMA Netw Open. 2020;3(4):e202377. doi: 10.1001/jamanetworkopen.2020.2377.
- Yoo KD, Yoon HJ, Hwang SS, et al. Different association between renal hyperfiltration and mortality by sex. Nephrology (Carlton). 2017;22(10):804–810. doi: 10.1111/nep.12857.
- Astor BC, Levey AS, Stevens LA, et al. Method of glomerular filtration rate estimation affects prediction of mortality risk. J Am Soc Nephrol. 2009;20(10):2214–2222. doi: 10.1681/ASN.2008090980.
- Eriksen BO, Løchen ML, Arntzen KA, et al. Subclinical cardiovascular disease is associated with a high glomerular filtration rate in the nondiabetic general population. Kidney Int. 2014;86(1):146–153. doi: 10.1038/ki.2013.470.
- Choi HM, Hyun YY, Lee KB, et al. High estimated glomerular filtration rate is associated with coronary artery calcification in middle-aged Korean men without chronic kidney disease. Nephrol Dial Transplant. 2015;30(6):996–1001. doi: 10.1093/ndt/gfv109.
- Rothenbacher D, Rehm M, Iacoviello L, et al. Contribution of cystatin C- and creatinine-based definitions of chronic kidney disease to cardiovascular risk assessment in 20 population-based and 3 disease cohorts: the BiomarCaRE project. BMC Med. 2020;18(1):300. doi: 10.1186/s12916-020-01776-7.
- Bukabau JB, Yayo E, Gnionsahé A, et al. Performance of creatinine- or cystatin C-based equations to estimate glomerular filtration rate in Sub-Saharan african populations. Kidney Int. 2019;95(5):1181–1189. doi: 10.1016/j.kint.2018.11.045.