
Abstract
Iguratimod is a novel synthetic, small-molecule immunosuppressive agent used to treat rheumatoid arthritis. Through ongoing exploration of its role and mechanisms of action, iguratimod has been observed to have antifibrotic effects in the lung and skin; however, its effect on renal fibrosis remains unknown. This study aimed to investigate whether iguratimod could affect renal fibrosis progression. Three different concentrations of iguratimod (30 mg/kg/day, 10 mg/kg/day, and 3 mg/kg/day) were used to intervene in unilateral ureteral obstruction (UUO) model mice. Iguratimod at 10 mg/kg/day was observed to be effective in slowing UUO-mediated renal fibrosis. In addition, stimulating bone marrow-derived macrophages with IL-4 and/or iguratimod, or with TGF-β and iguratimod or SRC inhibitors in vitro, suggested that iguratimod mitigates the progression of renal fibrosis in UUO mice, at least in part, by inhibiting the IL-4/STAT6 signaling pathway to attenuate renal M2 macrophage infiltration, as well as by impeding SRC activation to reduce macrophage–myofibroblast transition. These findings reveal the potential of iguratimod as a treatment for renal disease.
1. Introduction
Renal fibrosis is a common pathway for chronic kidney diseases (CKD), progressing to end-stage renal failure [Citation1]. Moreover, the accumulation of interstitial macrophages is considered to be an important cause of the occurrence and progression of fibrosis [Citation2]. Tissue macrophages characterized by heterogeneity and plasticity play a critical role in maintaining renal homeostasis and contributing to renal inflammation and fibrosis [Citation3]. Macrophages, responsive to the local microenvironment, are classified into two types: classically activated (M1) macrophages and alternatively activated (M2) macrophages [Citation4]. M1 macrophages play a vital role in inflammatory diseases, and their activation is usually accompanied by increased production of pro-inflammatory cytokines (including TNF-α, IL-1, and IL-6), reactive nitrogen species, and reactive oxygen species [Citation5]. Conversely, M2 macrophages are stimulated by macrophage colony-stimulating factors, IL-4, IL-13, and IL-10, and are involved in immune regulation, anti-inflammation, repair and regeneration, and fibrosis [Citation6]. Previous studies have confirmed that accumulated M2 macrophages promote renal fibrosis by inducing overproduction of extracellular matrix (ECM) components and secretion of profibrotic factors [Citation7].
Myofibroblasts, a key ECM-secreting cell type involved in renal fibrosis, can be produced through multiple pathways, including epithelial–mesenchymal transition [Citation8] and endothelial–mesenchymal transition [Citation9] and proliferation of fibroblasts (circulating or local) or pericytes [Citation10–12]. Macrophage–myofibroblast transition (MMT) has been identified another method for renal myofibroblast formation, involving the transformation of macrophages into myofibroblasts in response to inflammatory stimuli [Citation13]. The occurrence of MMT has been confirmed in the unilateral ureteral obstruction (UUO) mouse model [Citation14], and this process plays a crucial role in renal fibrosis [Citation15]. Bone marrow-derived monocytes/macrophages transform into myofibroblasts to produce ECM in patients with CKD [Citation16] or progressive CKD (patients with immunoglobulin A neuropathy) and in UUO mice [Citation17].
Iguratimod is a novel, small-molecule drug that is widely used in Asia as a disease-modifying anti-rheumatoid arthritis medication with strong anti-inflammatory effects [Citation18]. Continuous advancements in both basic and clinical research have revealed its potent anti-inflammatory and immune-regulatory properties. The drug has demonstrated efficacy in treating rheumatic autoimmune diseases, such as lupus nephritis [Citation19], Sjögren’s syndrome [Citation20], ankylosing spondylitis [Citation21], IgG4-related disease [Citation22], systemic sclerosis [Citation23], and cancer [Citation24]. Recent research has revealed that iguratimod can improve conditions such as rheumatoid arthritis-related interstitial lung fibrosis [Citation25] and systemic sclerosis-related skin or pulmonary fibrosis [Citation26,Citation27]. However, the kidney is another organ that is often affected by fibrosis in rheumatic immune diseases. Previous studies have indicated that iguratimod attenuates nephritis and renal interstitial injury in several murine models of lupus [Citation28–30]. Nevertheless, it remains unclear whether iguratimod can delay the progression of renal fibrosis.
Therefore, this study aimed to investigate the effect of iguratimod in the classical renal fibrosis model (UUO-induced renal fibrosis in mice) and to explore whether iguratimod can affect the progression of renal fibrosis by modulating macrophage polarization and its function.
2. Materials and methods
2.1. Animal surgery and experimental protocols
Wild-type 9-week-old male C57BL/6 mice (22–25 g) were purchased from SLAC Laboratories (Changsha, China). The mice were housed in the animal care facility of the Xiangya Medical College of Central South University and had access to food and water ad libitum for the duration of the study. All animal protocols were reviewed and approved by the Institutional Animal Welfare Committee of Central South University (Number: 2019030128).
We performed Sham (free ureter) or UUO surgery in mice [Citation31]. The C57BL/6 mice were randomly divided into six groups (six mice per group): the Sham group was injected intraperitoneally with 80 μL of the vehicle (5% DMSO + 40% PEG300 + 5% Tween80 + ddH2O) or 10 mg/kg/day of iguratimod (A20-220601, 99.99%, Simcere), and UUO mice were injected intraperitoneally with 80 μL of the vehicle or along with 3 mg/kg/day, 10 mg/kg/day, or 30 mg/kg/day of iguratimod [Citation29], once a day. All mice in each group were euthanized after 14 days (from the first day of modeling) of continuous injection of the corresponding drugs. Notably, the kidney tissue was longitudinally cut, with half embedded in paraffin and the other half frozen at −80 °C. The left kidney and peripheral blood (eye blood sampling) were collected for subsequent molecular biology experiments.
2.2. Histopathological assessment
Formalin-fixed left kidneys were embedded in paraffin, and 4-μm-thick sections were prepared for hematoxylin–eosin (HE) and Masson trichrome staining. Renal interstitial injury and interstitial fibrosis were scored separately on HE- and Masson-stained sections of the kidney, as previously described [Citation32,Citation33]. Specific scoring details can be found in Supplemental Material 1.
2.3. Real-time quantitative polymerase chain reaction analysis
Total RNA was extracted from the kidney tissue using Trizol reagent (Life Technologies, Carlsbad, CA, USA) according to the manufacturer’s instructions. cDNA was synthesized from 2 μg of total RNA in a 20-μL reaction system using a PrimeScript™ RT reagent kit (TaKaRa, RR037A). Quantitative real-time polymerase chain reaction (qPCR) was used to measure the expression of specific target mRNAs. This was conducted using a QuantStudio 5 Real-Time PCR detection biosystem and a fluorescent qPCR reagent (TaKaRa, RR430B). The amounts of specific mRNAs in each sample were calculated based on the cycle threshold (CT) values, which were standardized with the quantity of the housekeeping gene GAPDH. Further calculations and statistical analyses were based on the comparative 2-ΔΔCT method. Primers used for qPCR are listed in Supplemental Material 2.
2.4. Western blot analysis
Kidney tissues or bone marrow-derived macrophages (BMDMs) were homogenized in cold radioimmunoprecipitation assay buffer (Beyotime, Jiangsu, China) containing a 1% proteinase inhibitor cocktail (Servicebio, G2006). Thirty micrograms of protein were separated by 10% sodium dodecyl sulfate-polyacrylamide gel electrophoresis and subsequently transferred to polyvinylidene fluoride membranes (Millipore Crop. Billerica, MA, USA). Subsequently, the membranes were blocked in Tris-buffered saline containing 0.1% Tween-20 and 5% skimmed milk powder for 1.5 h at room temperature. Membranes were incubated with primary antibodies against GAPDH (Santa Cruz Biotechnology, sc-32233, 1:1000), fibronectin (Proteintech Group,15613-1-AP, 1:500), alpha-smooth muscle actin (α-SMA) (Cell Signaling Technology, #19245, 1:1000), signal transducer and activator of transcription 6 (STAT6; Cell Signaling Technology, #5397, 1:1000), phospho-STAT6 (p-STAT6; Cell Signaling Technology, #56554, 1:1000), SRC (Cell Signaling Technology, #2109, 1:1000), and phospho-SRC (p-SRC; Cell Signaling Technology, #6943, 1:1000) at 4 °C overnight, followed by incubation with a secondary horseradish peroxidase-conjugated IgG (1:1000, Santa Cruz) for 1 h at room temperature. Immunoreactive proteins were visualized using a chemiluminescence imaging system (Bio-Rad, Hercules, CA, USA). The staining intensity of the bands was measured using ImageJ (NIH) software.
2.5. Immunohistochemistry
Immunohistochemical staining for α-SMA (Cell Signaling Technology, #19245, 1:200, incubated overnight) was performed using 4-μm-thick paraffin sections of the left kidney. Five fields-of-view of kidney slices, taken at 200× magnification, were randomly selected in each slice. Images were captured under uniform conditions using a microscope (Leica, Wetzlar, Germany) and were analyzed using Image-Pro Plus 6.0 software (https://image-pro-plus.software.informer.com/6.0/). The ratio of the integrated optical density to the area (average optical density value) in the measurement region was used as a semi-quantitative value of α-SMA expression.
2.6. Immunofluorescence staining
Kidneys were snap-frozen and embedded in optimum cutting temperature formulation (Sakura Finetek, Staufen, Germany). Cryosections of 6-8μm-thickness were prepared using a Leica Cryostat CM3050 (Wetzlar, Germany) and placed on silane-coated cover slides. Frozen sections or BMDMs in 24-well plates were fixed (4% polyformaldehyde) and incubated overnight at 4 °C with antibodies against F4/80 (Abcam, ab6640) at 1:100 dilution, CD206 (R&D Systems, AF2535) at 1:150 dilution, or inducible nitric oxide synthase (iNOS) (Servicebio, GB11119) at 1:100 dilution, or α-SMA (Cell Signaling Technology, #19245) at 1:300 dilution. Following incubation with CY3-conjugated secondary antibodies (Servicebio, GB21301, 1:100) or FITC-conjugated secondary antibodies (Abcam, ab150157, 1:200) for 1 h in the dark, the nuclei were stained with DAPI (Servicebio, Wuhan, China) for 5 min before microscopic analysis (Leica DFC500, Wetzlar, Germany and Nikon Ts2, Tokyo, Japan). As a negative control, the primary antibodies were replaced with pre-immune IgG from the same species, with little or no nonspecific staining. The F4/80-positive areas were quantified by capturing random kidney section images (original magnification power × 400, five fields per kidney slice) from each mouse (n = 6) and counting fluorescence intensity in every microscopic field using ImageJ (NIH, Bethesda, MD, USA). We randomly selected five high-magnification field of fluorescence-stained images (400× for tissue image, 100× for cell image), and the number of double-stained cells (M1: F4/80+iNOS+ cells; M2: F4/80+CD206+ cells; MMT: F4/80+α-SMA+ cells) were counted using ImageJ software.
2.7. Enzyme-linked immunosorbent assays and biochemical detection
The level of IL-4 in obstructed kidney tissue was measured using an enzyme-linked immunosorbent assay kit (CUSABIO, CSB-E04634m). Kidney tissues were homogenized in cold radioimmunoprecipitation assay buffer (Beyotime, Jiangsu, China) supplemented with a 1% proteinase inhibitor cocktail (Servicebio, G2006). Initially, we determined the protein concentration of the samples (ranging between 3-11 mg/mL), followed by IL-4 concentration detection using the kit. The IL-4 concentration of the samples divided by the protein concentration of the samples yields the final IL-4 concentration (pg/mg protein) of the samples. The serum creatinine (Scr), blood urea nitrogen (BUN), and blood uric acid (BUA) levels in the mice were measured using an automated biochemical analyzer (AU5400, Olympus, Tokyo, Japan).
2.8. Cell extraction, stimulation and cultivation procedures
We isolated BMDMs from 8-week-old male C57BL/6 mice (SLAC Laboratories, Changsha, China). The cells were cultured in Dulbecco’s Modified Eagle Medium (DMEM) containing 10% Fetal Bovine Serum (FBS) complemented with 1% penicillin/streptomycin and 10 ng/ml Macrophage Colony-Stimulating Factor (M-CSF, Peprotech, #315-02) for 7 days, as described previously [Citation34,Citation35]. The polarization of BMDMs into M2-type macrophages was stimulated by incubation in DMEM containing 1%FBS and IL-4(20 ng/mL [Citation36], SinoBiological, #51084) and meanwhile being treated with different concentrations of iguratimod (10、20、30μg/mL, Simcere) [Citation37] for 12 h. Additionally, BMDMs were stimulated with transforming growth factor-beta (TGF-β, 5 ng/mL, Peprotech, #100-21) to undergo MMT [Citation38], and were meanwhile treated with iguratimod (20 μg/mL, Simcere) and/or SRC inhibitors (5 μM [Citation39,Citation40], MedChemExpress, #HY-101053) for 12 h.
2.9. Statistical analysis
Data are expressed as mean ± SEM. SPSS 20 (IBM Corp, Armonk, NY, USA) and GraphPad Prism 9 (GraphPad Software, La Jolla, CA, USA) were used to perform statistical analyses and create the graphs in this study, respectively. Statistical comparisons between two groups were performed using a two-tailed Student’s t-test. One-way analysis of variance (ANOVA) with Dunnett’s multiple comparisons test or Brown–Forsythe and Welch’s ANOVA with Dunnett’s T3 multiple comparisons test was performed to compare multiple groups. A value of p < 0.05 was considered statistically significant.
3. Results
3.1. Iguratimod attenuates tissue damage and fibrosis in obstructed kidneys of UUO model mice
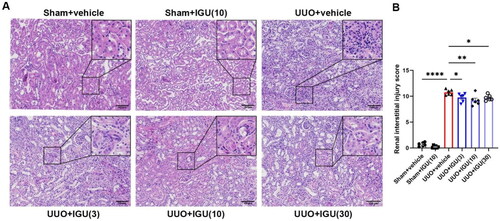
We assessed the effects of iguratimod intervention in UUO model mice at doses of 3 mg/kg/day, 10 mg/kg/day, and 30 mg/kg/day. As shown in , by scoring renal tubulointerstitial injury on HE-stained sections of the obstructed kidneys of UUO model mice, we observed that iguratimod at 3 mg/kg/day, 10 mg/kg/day, and 30 mg/kg/day reduced the renal tubular interstitial injury score from 10.77 to 9.75 (p = 0.0428), 9.22 (p = 0.0012), and 9.7 (p = 0.0313), respectively. The improved renal injury was demonstrated by the reduction in atrophy and dilatation of renal tubules, tubular casts, and infiltrated inflammatory cells in the iguratimod-treated UUO mice.
Figure 1. Iguratimod attenuates tissue damage in obstructed kidneys of UUO mice.
Mice that underwent Sham surgery were treated with vehicle or iguratimod (10 mg/kg/day), and those that underwent UUO surgery were treated with vehicle or iguratimod (30, 10, or 3 mg/kg/day). (A) Hematoxylin and eosin staining of renal tissues. (B) The tubulointerstitial injury score. IGU: iguratimod; UUO: unilateral ureteral obstruction. The numbers in parentheses are drug concentrations. Scale bar (at the bottom right of the image) = 100 μm. Data are expressed as mean ± SEM, n = 5–7, *p < 0.05, **p < 0.01, ****p < 0.0001.
By performing fibrosis scoring after Masson staining of the sections (), we observed that 3 mg/kg/day, 10 mg/kg/day, and 30 mg/kg/day of iguratimod reduced the fibrosis scores in UUO model mice from 1.41 to 1.11 (p = 0.009), 0.89 (p < 0.0001), and 0.93 (p < 0.0001), respectively, with the most significant reduction observed with 10 mg/kg/day of iguratimod. This reduction was demonstrated by a substantial decrease in collagen deposition (blue area) in kidney sections.
Figure 2. Iguratimod attenuates tissue fibrosis in obstructed kidneys of UUO mice.
Mice that underwent Sham surgery were treated with vehicle or iguratimod (10 mg/kg/day), and those that underwent UUO surgery were treated with vehicle or iguratimod (3, 10, or 30 mg/kg/day). (A) Masson’s trichrome staining of renal tissues. (B) The tubulointerstitial fibrosis score. The mRNA levels of collagen I (C), FN (D), α-SMA (E) in the kidneys of mice. Representative images of protein immunoblots (F) and the grayscale value analysis plots (G and H) of α-SMA and fibronectin in kidneys of mice. Immunohistochemical staining of α-SMA (J) in kidneys of mice and its semi-quantitative analysis graph (I). IGU: iguratimod; UUO: unilateral ureteral obstruction; α-SMA: alpha-smooth muscle actin; FN: fibronectin. The numbers in parentheses are drug concentrations. Scale bar (at the bottom right of the image) = 100 μm. Data were expressed as mean ± SEM, n = 5–7, *p < 0.05, **p < 0.01, ***p < 0.001, ****p < 0.0001.
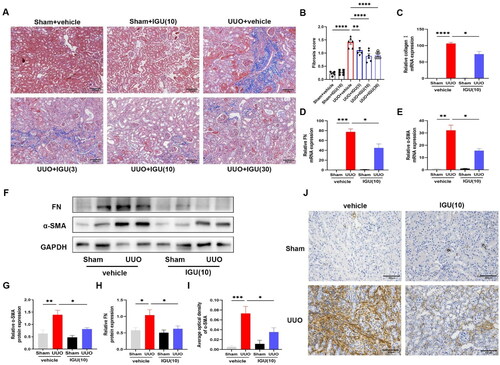
Furthermore, we found that the mRNA expression levels of Collagen I, Fibronectin, and α-SMA, which were highly expressed in mouse kidneys after UUO, were decreased (p = 0.0226; p = 0.0301; p = 0.0219) by iguratimod intervention (). Similarly, the protein expression levels of Fibronectin and α-SMA () were increased in the kidneys of UUO model mice and decreased (p = 0.0420; p = 0.0127) after iguratimod treatment. Moreover, immunohistochemical staining and semi-quantitative analysis showed a reduction (p = 0.0330) in the abundance of α-SMA expression in the renal interstitium of UUO mice following iguratimod treatment (). These reduction in expression levels of the above-mentioned fibrosis-related indicators confirmed the ability of iguratimod to inhibit renal fibrosis.
3.2. Iguratimod reduces BUA levels in UUO model mice
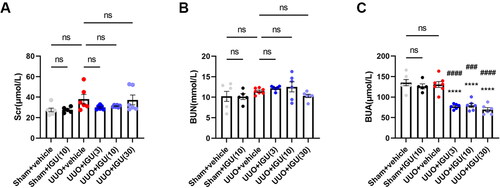
As shown in , compared to the control group (Sham-operated mice treated with vehicle), the Scr levels in the vehicle-treated UUO model mice were slightly elevated (27.50 vs. 37.98 μmol/L, p = 0.112); nevertheless, the elevation was not statistically significant. Additionally, UUO model mice injected with any of the three different doses of iguratimod (3 mg/kg/day, 10 mg/kg/day, and 30 mg/kg/day) showed no significant differences in Scr levels compared with vehicle-treated UUO model mice (37.98 vs. 30.00, 31.20, or 37.27 μmol/L, respectively; all p > 0.05). Furthermore, no significant difference was observed in BUN levels among the Sham groups, vehicle-treated UUO mice, and iguratimod-treated UUO mice (all p > 0.05) (). Doses of 3 mg/kg/day, 10 mg/kg/day, and 30 mg/kg/day of iguratimod all significantly reduced BUA levels in UUO model mice compared with vehicle-treated UUO model mice (130.8 vs. 77.07, 79.67, or 69.38 μmol/L, respectively; all p < 0.0001; ). These levels were even lower than those in iguratimod-treated Sham-surgery mice (126.3 μmol/L vs. 77.07 μmol/L, p < 0.0001; 126.3 μmol/L vs. 79.67 μmol/L, p = 0.0002; 126.3 μmol/L vs. 69.38 μmol/L, p < 0.0001, respectively; ).
Figure 3. Iguratimod reduces BUA levels in UUO model mice.
Mice that underwent Sham surgery were treated with vehicle or iguratimod (10 mg/kg/day), and those that underwent UUO surgery were treated with vehicle or iguratimod (30, 10, or 3 mg/kg/day). The serum levels of Scr (A), BUN (B), and BUA (C) in mice. IGU: iguratimod; UUO: unilateral ureteral obstruction; Scr: serum creatinine; BUN: blood urea nitrogen; BUA: blood uric acid. The numbers in parentheses are drug concentrations. Data were expressed as mean ± SEM, n = 5–7, vs. UUO+vehicle, ****p < 0.0001; vs. Sham+IGU(10), ###P <0.001, ####P < 0.0001.
3.3. Iguratimod inhibits macrophage infiltration, particularly M2 macrophages, in obstructed kidneys of UUO model mice
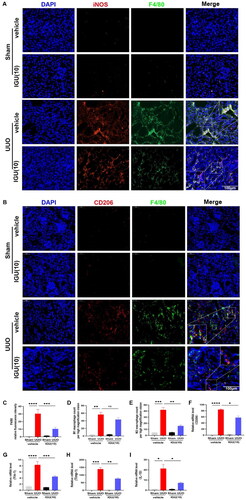
We investigated the effect of iguratimod on macrophage infiltration in kidneys of UUO model mice. As illustrated in , it is evident that infiltrating macrophages (F4/80+) were increased in the kidneys of UUO mice and were decreased (p = 0.0004) after iguratimod treatment. The results of immunofluorescence staining and quantification demonstrated that iguratimod treatment contributed to a relative reduction in M1 macrophage (F4/80+/iNOS+) infiltration in the kidneys of UUO model mice, but this reduction was not statistically significant (p = 0.4468; ). However, compared with the kidneys of vehicle-treated UUO model mice, the kidneys of mice treated with iguratimod (10 mg/kg/day) exhibited reduced M2 macrophage infiltration (F4/80+/CD206+; p = 0.0023; ). Moreover, compared with the vehicle-treated UUO mice, the mRNA levels of M2 macrophage markers CD206 (p = 0.0115; ), chitinase 3-like 3 (Ym-1; p = 0.0004; ), tissue inhibitor of metalloproteinases-1 (Timp-1; p = 0.0034; ), and IL-10 (p = 0.0495; ) were decreased after iguratimod intervention, which further verified the inhibitory effect of iguratimod on M2 macrophages.
Figure 4. Iguratimod inhibits M2 macrophage infiltration in obstructed kidneys of UUO mice.
Mice that underwent Sham or UUO surgery were treated with vehicle or iguratimod (10 mg/kg/day). Immunofluorescence staining of M1 (F4/80+/iNOS+, A) and M2 (F4/80+/CD206+, B) macrophages in the kidneys of mice. C. Quantitative analysis of relative fluorescence intensity for F4/80 positive staining. The number of infiltrated M1 (D) and M2 (E) macrophages per high magnification field in kidneys of mice. The mRNA levels of M2 macrophage-related markers CD206 (F), Ym-1 (G), Timp-1 (H), and IL-10 (I) in the kidneys of mice. IGU: iguratimod; UUO: unilateral ureteral obstruction; iNOS: inducible nitric oxide synthase; Ym-1: chitinase 3-like 3; Timp-1: tissue inhibitor of metalloproteinases-1. The numbers in parentheses are drug concentrations. The orange color in the Merge plot indicates positive co-localization staining. The image in the large rectangle is a zoomed-in version of the small rectangle image. Scale bar (at the bottom right of the image) = 100 μm. Data were expressed as mean ± SEM, n = 5–7, *p < 0.05, **p < 0.01, ***p < 0.001, ****p < 0.0001.
3.4. Iguratimod inactivates the IL-4/STAT6 signaling pathway, subsequently inhibiting M2 macrophage infiltration into obstructed kidneys of UUO model mice
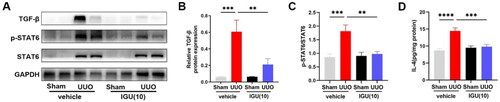
We aimed to elucidate the molecular mechanism underlying M2 macrophage inhibition by iguratimod. The results of immunoblotting () and enzyme-linked immunosorbent assay () showed that mice exhibited elevated p-STAT6/STAT6 (p = 0.0007), TGF-β (p = 0.0005) and IL-4 (p < 0.0001) protein levels in the kidneys after UUO surgery. However, the expression of p-STAT6/STAT6 (p = 0.0024; ) and IL-4 (14.46 vs 9.801 pg/mg, p = 0.0002; ) were reduced in the kidneys of iguratimod-treated mice compared with vehicle-treated UUO mice. In addition, we found that the expression of TGF-β, which was elevated (p = 0.0005) in the kidneys of UUO mice compared with Sham mice, decreased (p = 0.0077) after iguratimod treatment ().
Figure 5. Iguratimod inhibits M2 macrophage infiltration by inactivating the IL-4/STAT6 signaling pathway in obstructed kidneys of UUO mice.
Mice that underwent Sham or UUO surgery were treated with vehicle or iguratimod (10 mg/kg/day). Representative protein immunoblots (A) and analysis of the grayscale values of p-STAT6, STAT6 and TGF-β (B and C) in the kidneys of mice. D. The levels of IL-4 in the kidneys of mice. IGU: iguratimod; UUO: unilateral ureteral obstruction; p-STAT6: phospho-signal transducer and activator of transcription 6; TGF-β: transforming growth factor-beta. The numbers in parentheses are concentrations of iguratimod (10 mg/kg/day). Data were expressed as mean ± SEM, n = 5–7, **p < 0.01, ***p < 0.001, ****p < 0.0001.
3.5. Iguratimod inhibits SRC activation and prevents MMT in obstructed kidneys of UUO model mice
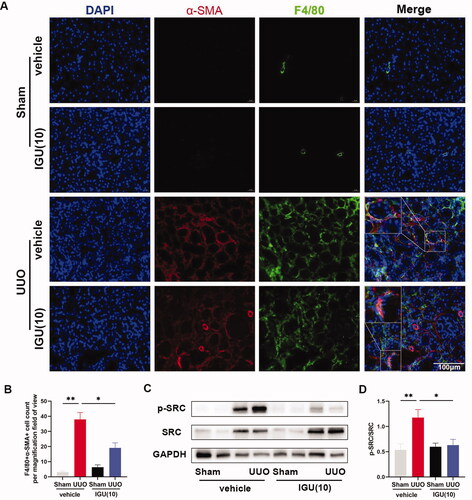
Immunofluorescence staining and semi-quantitative analysis showed that the number of F4/80+/α-SMA+ cells per high-magnification field-of-view was increased in the kidneys of UUO model mice treated with vehicle compared to controls (3.1 vs 37.90, p = 0.0018), whereas the number of F4/80+/α-SMA+ cells was significantly reduced in the kidneys of mice treated with iguratimod (37.90 vs 19.13, p = 0.0252; ). Additionally, our protein immunoblotting results showed that SRC was activated in the kidneys of UUO model mice compared to the vehicle-treated Sham group (p = 0.0034; ), and the ratio of p-SRC/SRC was reduced in the kidneys of mice treated with iguratimod (p = 0.0119; ).
Figure 6. Iguratimod inhibits MMT by suppressing the activation of SRC in the obstructed kidneys of UUO mice.
Mice that underwent Sham or UUO surgery were treated with vehicle or iguratimod (10 mg/kg/day). A. Immunofluorescence staining of F4/80+/α-SMA+ cells in the kidneys of mice. B. The number of F4/80+/α-SMA+ cells per high magnification field in the kidneys of mice. Representative protein immunoblots (C) and analysis of the grayscale values (D) of p-SRC and SRC in kidneys of mice. The numbers in parentheses are drug concentrations. The orange color in the Merge plot indicates positive co-localization staining. The image in the large rectangle is a zoomed-in version of the small rectangle image. Scale bar (at the bottom right of the image) = 100 μm. IGU: iguratimod; UUO: unilateral ureteral obstruction; MMT: macrophage–myofibroblast transition; α-SMA: alpha-smooth muscle actin. Data were expressed as mean ± SEM, n = 5–7, *p < 0.05, **p < 0.01.
3.6. Iguratimod inhibits M2 macrophage polarization in vitro by suppressing the STAT6 signaling pathway
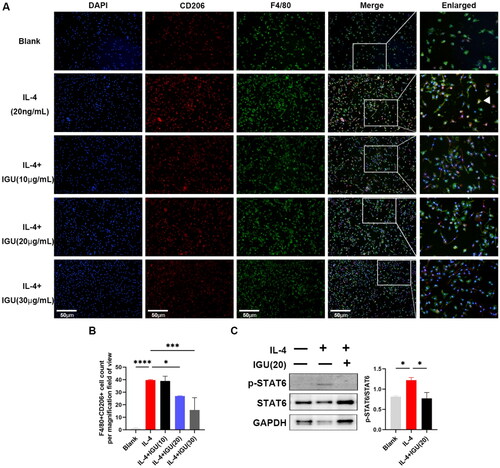
As shown in , polarization of BMDMs toward M2 macrophages increased (p < 0.0001) under IL-4 stimulation. However, iguratimod at 20 μg/mL (p = 0.0470) and 30 μg/mL (p = 0.0009) reduced the number of M2 macrophages derived from BMDMs under IL-4 stimulation. Additionally, the increased (p = 0.0263, compared to the Blank) ratio of p-STAT6/STAT6 in BMDMs mediated by IL-4 was reduced (p = 0.0396) after iguratimod treatment ().
Figure 7. Iguratimod may inhibit M2 macrophage polarization in vitro by suppressing the STAT6 signaling pathway.
BMDMs pre-stimulated with M-CSF (10ng/mL) were stimulated with IL-4 (20ng/mL) and iguratimod (10μg/mL, 20μg/mL, 30μg/mL) for 12h. Immunofluorescence staining images of M2 macrophages (A) and their quantitative analysis (B). C. Representative protein immunoblots and analysis of the grayscale values of p-STAT6 and STAT6 in macrophages. The orange color in the Merge plot indicates positive co-localization staining. The image in the right is a zoomed-in version of the small rectangle image. Scale bar (at the bottom left of the image) = 50 μm. IGU: Iguratimod; p-STAT6: phospho-signal transducer and activator of transcription 6; BMDMs: Bone Marrow-Derived Macrophages; M-CSF: Macrophage Colony-Stimulating Factor. Data were expressed as mean ± SEM, n = 3, *p < 0.05, ***p < 0.001, ****p < 0.0001.
3.7. Iguratimod inhibits MMT in vitro by inhibiting the SRC signaling pathway
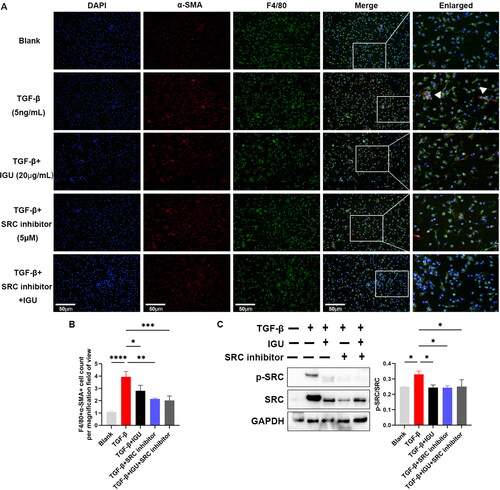
As shown in , the MMT of BMDMs increased under TGF-β stimulation, manifested by the increased number of F4/80+α-SMA+ cells (p < 0.0001). Iguratimod (20 μg/mL, p = 0.0453) or iguratimod together with SRC inhibitor (5 μM, p = 0.0009) or SRC inhibitor alone (5 μM, p = 0.0015) can decrease the number of F4/80+α-SMA+ cells derived from BMDMs stimulated by TGF-β. Furthermore, iguratimod (p = 0.0196) or iguratimod together with SRC inhibitor (p = 0.0185) or SRC inhibitor alone (p = 0.0307) reduced the increased (p = 0.0270, compared to the Blank) ratio of p-SRC/SRC in BMDMs mediated by TGF-β ().
Figure 8. Iguratimod inhibits MMT in vitro by inhibiting the SRC signaling pathway.
BMDMs pre-stimulated with M-CSF (10ng/mL) were stimulated with TGF-β (5ng/mL) togather with or without iguratimod (20μg/mL) and/or SRC inhibitor (5μM) for 12h. Immunofluorescence staining of MMT (A) and their quantitative analysis (B). C. Representative protein immunoblots and analysis of the grayscale values of p-SRC and SRC in macrophages. The orange color in the Merge plot indicates positive co-localization staining. The image in the right is a zoomed-in version of the small rectangle image. Scale bar (at the bottom left of the image) = 50 μm. IGU: Iguratimod; BMDMs: Bone Marrow-Derived Macrophages; MMT: macrophage–myofibroblast transition; M-CSF: Macrophage Colony-Stimulating Factor; TGF-β: transforming growth factor-beta. Data were expressed as mean ± SEM, n = 3, *p < 0.05, **p < 0.01, ***p < 0.001, ****p < 0.0001.
4. Discussion
Iguratimod is a small-molecule drug with potent anti-inflammatory and therapeutic effects on certain kidney diseases. Studies demonstrated that iguratimod reduced renal injury in lupus model mice by regulating peripheral B-cell differentiation [Citation30] or inhibiting epithelial-to-mesenchymal transition [Citation28]. Moreover, iguratimod reduced immune rejection in kidney transplant patients [Citation41,Citation42]. Complete resolution of hematuria, renal injury, and hydronephrosis was reported in a patient with rheumatoid arthritis combined with urinary tract obstruction and acute kidney injury after treatment with prednisone, iguratimod, and leflunomide [Citation43]. However, it must be noted that iguratimod was not necessarily the drug that exerted the primary therapeutic effect in this case. The antifibrotic effects of iguratimod have been revealed through extensive exploration of its effectiveness in treating rheumatoid immune diseases [Citation26,Citation44–46]. Since CKD is a frequent complication in many rheumatic immune diseases, including rheumatoid arthritis, systemic lupus erythematosus, and systemic sclerosis, we explored the role of iguratimod intervention on renal fibrosis. We observed that iguratimod attenuated UUO-mediated renal injury and fibrosis. Moreover, no significant difference was observed in Scr and BUN levels among Sham, vehicle-treated UUO, and iguratimod-treated UUO mice. This finding could be attributed to the robust compensatory effect of the unaffected kidney in the UUO model. Interestingly, our study revealed a significant decrease in BUA levels in UUO model mice after iguratimod treatment, while iguratimod had no significant effect on BUA levels in Sham mice. Since BUA levels may undergo changes over a relatively short period, this phenomenon could be random, but we speculate it might also be due to UUO affecting the excretion of certain metabolites of iguratimod, thus influencing BUA levels. Further investigation is required to determine the impact of iguratimod on BUA levels.
To investigate the specific mechanism of iguratimod in treating renal fibrosis, we assessed its effects on macrophages, which are classical inflammatory cells and play a significant role in organ fibrosis [Citation2]. Previous studieshad found that iguratimod inhibited macrophage infiltration and microglial activation [Citation47], M1 macrophage polarization [Citation41], and osteoclast differentiation and migration of RAW 264.7 cells [Citation48]. Our study similarly demonstrated that iguratimod inhibited UUO-induced macrophage infiltration into the renal interstitium. In addition, our study revealed that UUO-induced renal M2 macrophage infiltration was accompanied by activation of the IL-4/STAT6 signaling pathway, and we observed that iguratimod treatment inhibited the activation of this pathway and reduced the number of infiltrating M2 macrophages in the renal interstitium. In vitro intervention of BMDMs with IL-4 and/or iguratimod also validated that iguratimod may suppress M2 macrophage polarization by inhibiting the STAT6 signaling pathway. Consistent with our findings, STAT6 in CD11b cells was observed to increase M2 myeloid cells through upregulation of IL-4 [Citation49]. Blocking IL-4- and IL-13-mediated STAT6 phosphorylation reduced macrophage polarization toward M2 [Citation50]. Moreover, IL-4 deficiency inhibited STAT6 activation and attenuated myeloid fibroblast activation, M2 macrophage polarization in folic acid nephropathy and renal fibrosis after UUO injury [Citation51]. Iguratimod was found to inhibit the epithelial-to-mesenchymal transition process in mice with bleomycin-induced pulmonary fibrosis [Citation27], and inhibit pulmonary and cutaneous fibrosis by impeding the conversion of fibroblasts to myofibroblasts [Citation46,Citation52]. Moreover, the importance of MMT in renal fibrosis was confirmed, and notably, that the M2 macrophage phenotype was the predominant phenotype undergoing MMT in both human and murine renal fibrosis [Citation13]. Previous studies further revealed that SRC can act as a direct target gene of SMAD3 and play a central role in the MMT process and tissue fibrosis [Citation38]. Selective inhibition or silencing of SRC expression in renal interstitial fibroblasts attenuated ECM protein deposition [Citation53]. Similarly, our study demonstrated increased numbers of MMT cells in the renal interstitium of UUO model mice, accompanied by SRC activation, whereas MMT and SRC were suppressed after iguratimod administration in vivo and in vitro.
However, one study showed that the IL-4–SRC–STAT6 pathway played a major role in the production of M2 macrophages, though the study emphasized the anti-inflammatory effects of M2 macrophages [Citation54], which led us to speculate on the centrality of SRC proteins in renal fibrosis. The effect of SRC on the IL-4/STAT6 signaling pathway and M2 macrophage polarization in UUO model mice should be investigated in future studies.
Conclusively, the therapeutic effect of iguratimod on UUO-induced renal injury and fibrosis is exerted partially through the inhibition of IL-4/STAT6 signaling pathway and SRC activation, reducing M2 macrophage infiltration and MMT, respectively. Therefore, iguratimod has the potential as a prospective therapeutic drug in reducing the progression of renal fibrosis. However, further clinical researches are still required.
Authors’ contributions
Yueyuan Zhou: Data curation, Investigation, Methodology, Visualization, Writing – original draft, and Writing – review & editing; Zhilan Li: Validation and Investigation; Shenyi Yu: Investigation; Xuan Wang: Writing – review & editing; Tingting Xie: Methodology; Weiru Zhang: Conceptualization and Funding acquisition.
Supplemental Material
Download Zip (24.3 KB)Acknowledgments
We thank Prof. Xiaoyan Zhu of the Naval Military Medical University for providing guidance on our study. We are grateful to Simcere for providing us with iguratimod and part of the research funding, and to Editage for the English language editing services. Additionally, we sincerely appreciate Professor Xin Ni from the International Joint Research Center of Medical Metabolomics at Xiangya Hospital, Central South University, for providing us with research platforms and material assistance during the experimental supplementation phase.
Disclosure statement
No potential conflict of interest was reported by the author(s).
Data availability statement
The data that support the findings of this study are available from the corresponding author on reasonable request.
Additional information
Funding
References
- Panizo S, Martínez-Arias L, Alonso-Montes C, et al. Fibrosis in chronic kidney disease: pathogenesis and consequences. Int J Mol Sci. 2021;22(1):1. doi:10.3390/ijms22010408.
- Tang PM, Nikolic-Paterson DJ, Lan HY. Macrophages: versatile players in renal inflammation and fibrosis. Nat Rev Nephrol. 2019;15(3):144–14. doi:10.1038/s41581-019-0110-2.
- Locati M, Curtale G, Mantovani A. Diversity, mechanisms, and significance of macrophage plasticity. Annu Rev Pathol. 2020;15(1):123–147. doi:10.1146/annurev-pathmechdis-012418-012718.
- Martinez FO, Sica A, Mantovani A, et al. Macrophage activation and polarization. Front Biosci. 2008;13(13):453–461. doi:10.2741/2692.
- Liu YC, Zou XB, Chai YF, et al. Macrophage polarization in inflammatory diseases. Int J Biol Sci. 2014;10(5):520–529. doi:10.7150/ijbs.8879.
- Chen T, Cao Q, Wang Y, et al. M2 macrophages in kidney disease: biology, therapies, and perspectives. Kidney Int. 2019;95(4):760–773. doi:10.1016/j.kint.2018.10.041.
- Braga TT, Agudelo JS, Camara NO. Macrophages during the fibrotic process: m 2 as friend and foe. Front Immunol. 2015;6:602. doi:10.3389/fimmu.2015.00602.
- Iwano M, Plieth D, Danoff TM, et al. Evidence that fibroblasts derive from epithelium during tissue fibrosis, the. J Clin Invest. 2002;110(3):341–350. doi:10.1172/JCI0215518.
- Zeisberg EM, Potenta SE, Sugimoto H, et al. Fibroblasts in kidney fibrosis emerge via endothelial-to-mesenchymal transition. J Am Soc Nephrol. 2008;19(12):2282–2287. doi:10.1681/ASN.2008050513.
- Grgic I, Duffield JS, Humphreys BD. The origin of interstitial myofibroblasts in chronic kidney disease. Pediatr Nephrol. 2012;27(2):183–193. doi:10.1007/s00467-011-1772-6.
- Humphreys BD, Lin SL, Kobayashi A, et al. Fate tracing reveals the pericyte and not epithelial origin of myofibroblasts in kidney fibrosis. Am J Pathol. 2010;176(1):85–97. doi:10.2353/ajpath.2010.090517.
- Reich B, Schmidbauer K, Rodriguez Gomez M, et al. Fibrocytes develop outside the kidney but contribute to renal fibrosis in a mouse model. Kidney Int. 2013;84(1):78–89. doi:10.1038/ki.2013.84.
- Meng XM, Wang S, Huang XR, et al. Inflammatory macrophages can transdifferentiate into myofibroblasts during renal fibrosis. Cell Death Dis. 2016;7(12):e2495–e2495. doi:10.1038/cddis.2016.402.
- Wang S, Meng XM, Ng YY, et al. TGF-β/Smad3 signalling regulates the transition of bone marrow-derived macrophages into myofibroblasts during tissue fibrosis. Oncotarget. 2016;7(8):8809–8822. doi:10.18632/oncotarget.6604.
- Wei J, Xu Z, Yan X. The role of the macrophage-to-myofibroblast transition in renal fibrosis. Front Immunol. 2022;13:934377. doi:10.3389/fimmu.2022.934377.
- Chen J, Tang Y, Zhong Y, et al. P2Y12 inhibitor clopidogrel inhibits renal fibrosis by blocking macrophage-to-myofibroblast transition. Mol Ther. 2022;30(9):3017–3033. doi:10.1016/j.ymthe.2022.06.019.
- Feng Y, Guo F, Xia Z, et al. Inhibition of fatty acid-binding protein 4 attenuated kidney fibrosis by mediating macrophage-to-myofibroblast transition. Front Immunol. 2020;11:566535. doi:10.3389/fimmu.2020.566535.
- Xu Y, Zhu Q, Song J, et al. Regulatory effect of iguratimod on the balance of Th subsets and inhibition of inflammatory cytokines in patients with rheumatoid arthritis. Mediators Inflamm.2015;2015:356040. doi:10.1155/2015/356040.
- Kang Y, Yan Q, Fu Q, et al. Iguratimod as an alternative induction therapy for refractory lupus nephritis: a preliminary investigational study. Arthritis Res Ther. 2020;22(1):65. doi:10.1186/s13075-020-02154-7.
- Hu G, Yu YF, Yin S, et al. Efficacy and safety of iguratimod combined with methylprednisolone for primary Sjögren’s syndrome: a meta-analysis and trial sequential analysis. Eur Rev Med Pharmacol Sci. 2023;27:7544–7556. doi:10.26355/eurrev_202308_33406.
- Long Z, Deng Y, He Q, et al. Efficacy and safety of iguratimod in the treatment of ankylosing spondylitis: a systematic review and meta-analysis of randomized controlled trials. Front Immunol. 2023;14:993860. doi:10.3389/fimmu.2023.993860.
- Liu Y, Zhang Y, Bian W, et al. Efficacy and safety of iguratimod on patients with relapsed or refractory IgG4-related disease. Clin Rheumatol. 2020;39(2):491–497. doi:10.1007/s10067-019-04880-z.
- Yan Q, Liu B, Wang J, et al. Iguratimod as an alternative therapy for systemic sclerosis and prevention of the occurrence of ischemic digital ulcer. Front Med . 2023;10:1113408. doi:10.3389/fmed.2023.1113408.
- Younis M, Wu Y, Fang Q, et al. Synergistic therapeutic antitumor effect of PD-1 blockade cellular vesicles in combination with iguratimod and rhodium nanoparticles. J Colloid Interface Sci. 2023;649:929–942. doi:10.1016/j.jcis.2023.06.030.
- Shu P, Shao SQ, Cai XN, et al. Iguratimod attenuates general disease activity and improves lung function in rheumatoid arthritis-associated interstitial lung disease patients. Eur Rev Med Pharmacol Sci. 2021;25:4687–4692. doi:10.26355/eurrev_202107_26379.
- Shen L, Yin H, Sun L, et al. Iguratimod attenuated fibrosis in systemic sclerosis via targeting early growth response 1 expression. Arthritis Res Ther. 2023;25(1):151. doi:10.1186/s13075-023-03135-2.
- Liu W, Han X, Li Q, et al. Iguratimod ameliorates bleomycin-induced pulmonary fibrosis by inhibiting the EMT process and NLRP3 inflammasome activation. Biomed Pharmacother. 2022;153:113460. doi:10.1016/j.biopha.2022.113460.
- Xue L, Xu J, Lu W, et al. Iguratimod alleviates tubulo-interstitial injury in mice with lupus. Ren Fail. 2022;44(1):636–647. doi:10.1080/0886022X.2022.2058962.
- Xia Y, Fang X, Dai X, et al. Iguratimod ameliorates nephritis by modulating the Th17/Treg paradigm in pristane-induced lupus. Int Immunopharmacol. 2021;96:107563. doi:10.1016/j.intimp.2021.107563.
- Yan Q, Du F, Huang X, et al. Prevention of immune nephritis by the small molecular weight immunomodulator iguratimod in MRL/lpr mice. PLOS One. 2014;9(10):e108273. doi:10.1371/journal.pone.0108273.
- Chevalier RL, Forbes MS, Thornhill BA. Ureteral obstruction as a model of renal interstitial fibrosis and obstructive nephropathy. Kidney Int. 2009;75(11):1145–1152. doi:10.1038/ki.2009.86.
- Radford MG, Jr., Donadio JV, Jr., Bergstralh EJ, et al. Predicting renal outcome in IgA nephropathy. J Am Soc Nephrol. 1997;8(2):199–207. doi:10.1681/ASN.V82199.
- Lin SL, Chen RH, Chen YM, et al. Pentoxifylline attenuates tubulointerstitial fibrosis by blocking Smad3/4-activated transcription and profibrogenic effects of connective tissue growth factor. J Am Soc Nephrol. 2005;16(9):2702–2713. doi:10.1681/ASN.2005040435.
- Toda G, Yamauchi T, Kadowaki T, et al. Preparation and culture of bone marrow-derived macrophages from mice for functional analysis. STAR Protoc. 2021;2(1):100246. doi:10.1016/j.xpro.2020.100246.
- Li X, Xu M, Shen J, et al. Sorafenib inhibits LPS-induced inflammation by regulating Lyn-MAPK-NF-kB/AP-1 pathway and TLR4 expression. Cell Death Discov. 2022;8(1):281. doi:10.1038/s41420-022-01073-7.
- Liu C, Zhou C, Xia W, et al. Targeting ALK averts ribonuclease 1-induced immunosuppression and enhances antitumor immunity in hepatocellular carcinoma. Nat Commun. 2024;15(1):1009. doi:10.1038/s41467-024-45215-0.
- Lyu T, Jiang H, Zeng L, et al. Iguratimod suppresses Tfh cell differentiation in primary Sjögren’s syndrome patients through inhibiting Akt/mTOR/STAT3 signaling. Arthritis Res Ther. 2023;25(1):152. doi:10.1186/s13075-023-03109-4.
- Tang PM, Zhou S, Li CJ, et al. The proto-oncogene tyrosine protein kinase Src is essential for macrophage-myofibroblast transition during renal scarring. Kidney Int. 2018;93(1):173–187. doi:10.1016/j.kint.2017.07.026.
- Guo Y, Mei F, Huang Y, et al. Matrix stiffness modulates tip cell formation through the p-PXN-Rac1-Yap signaling axis. Bioact Mater. 2022;7:364–376. doi:10.1016/j.bioactmat.2021.05.033.
- Zhang Y, Liu Z, Yang X, et al. H3K27 acetylation activated-COL6A1 promotes osteosarcoma lung metastasis by repressing STAT1 and activating pulmonary cancer-associated fibroblasts. Theranostics. 2021;11(3):1473–1492. doi:10.7150/thno.51245.
- Hang Z, Wei J, Zheng M, et al. Iguratimod attenuates macrophage polarization and antibody-mediated rejection after renal transplant by regulating KLF4. Front Pharmacol. 2022;13:865363. doi:10.3389/fphar.2022.865363.
- Tao J, Sun L, Wang Z, et al. Efficacy and safety of iguratimod supplement to the standard immunosuppressive regimen in highly mismatched renal transplant recipients: a pilot study. Front Immunol. 2021;12:738392. doi:10.3389/fimmu.2021.738392.
- Chen RX, Cao SS, Zhao LD, et al. Obstructive uropathy associated with rheumatoid arthritis successfully treated with steroids and immunosuppressive therapy: a case report. Medicine . 2019;98(50):e18415. doi:10.1097/MD.0000000000018415.
- Jiang H, Gao H, Wang Q, et al. Molecular mechanisms and clinical application of iguratimod: a review. Biomed Pharmacother. 2020;122:109704. doi:10.1016/j.biopha.2019.109704.
- Shao S, Qu Z, Liang Y, et al. Iguratimod decreases bleomycin-induced pulmonary fibrosis in association with inhibition of TNF-α in mice. Int Immunopharmacol. 2021;99:107936. doi:10.1016/j.intimp.2021.107936.
- Xie X, Gan H, Tian J, et al. Iguratimod inhibits skin fibrosis by regulating TGF-β1/Smad signalling pathway in systemic sclerosis. Eur J Clin Invest. 2022;52(8):e13791. doi:10.1111/eci.13791.
- Li G, Yamasaki R, Fang M, et al. Novel disease-modifying anti-rheumatic drug iguratimod suppresses chronic experimental autoimmune encephalomyelitis by down-regulating activation of macrophages/microglia through an NF-κB pathway. Sci Rep. 2018;8(1):1933. doi:10.1038/s41598-018-20390-5.
- Gan K, Yang L, Xu L, et al. Iguratimod (T-614) suppresses RANKL-induced osteoclast differentiation and migration in RAW264.7 cells via NF-κB and MAPK pathways. Int Immunopharmacol. 2016;35:294–300. doi:10.1016/j.intimp.2016.03.038.
- Fu C, Jiang L, Hao S, et al. Activation of the IL-4/STAT6 signaling pathway promotes lung cancer progression by increasing M2 myeloid cells. Front Immunol. 2019;10:2638. doi:10.3389/fimmu.2019.02638.
- Rahal OM, Wolfe AR, Mandal PK, et al. Blocking interleukin (IL)4- and IL13-Mediated phosphorylation of STAT6 (Tyr641) decreases M2 polarization of macrophages and protects against macrophage-mediated radioresistance of inflammatory breast cancer. Int J Radiat Oncol Biol Phys. 2018;100(4):1034–1043. doi:10.1016/j.ijrobp.2017.11.043.
- Liang H, Zhang Z, Yan J, et al. The IL-4 receptor α has a critical role in bone marrow-derived fibroblast activation and renal fibrosis. Kidney Int. 2017;92(6):1433–1443. doi:10.1016/j.kint.2017.04.021.
- Lin H, Wu C, Zhu F, et al. Anti-fibrotic effect of iguratimod on pulmonary fibrosis by inhibiting the fibroblast-to-myofibroblast transition. Adv Med Sci. 2020;65(2):338–347. doi:10.1016/j.advms.2020.05.006.
- Yan Y, Ma L, Zhou X, et al. Src inhibition blocks renal interstitial fibroblast activation and ameliorates renal fibrosis. Kidney Int. 2016;89(1):68–81. doi:10.1038/ki.2015.293.
- Hu X, Wang H, Han C, et al. Src promotes anti-inflammatory (M2) macrophage generation via the IL-4/STAT6 pathway. Cytokine. 2018;111:209–215. doi:10.1016/j.cyto.2018.08.030.