
Abstract
Objectives
Obesity can induce dysbiosis in the gut microbiota and is considered a separate risk factor for kidney function decline. Nonetheless, the precise function of intestinal microorganisms in facilitating the connection between obesity and kidney function decline remains uncertain. Hence, the objective of this study was to investigate the alterations in the gut microbiota composition that take place during obesity and their correlations with renal function utilizing a rat model.
Methods
For 20 weeks, 25 Sprague–Dawley rats were fed either a high-fat diet (HFD) or a normal-fat normal diet (ND). Physiological indices, peripheral plasma, kidney tissue, and colon contents were collected for comparison between groups. Metagenomic analysis of intestinal flora was performed.
Results
The HFD group demonstrated significantly increased levels of creatinine and urea nitrogen in the peripheral blood. Additionally, the HFD rats exhibited a significantly larger glomerular diameter compared to the ND group, accompanied by the presence of glomerulosclerosis, tubular vacuolar transformation, and other pathological changes in certain glomeruli. Metagenomics analysis revealed a notable rise in the prevalence of the Firmicutes phylum within the HFD group, primarily comprising the Rumenococcus genus. Functional analysis indicated that the gut microbiota in the HFD group primarily correlated with infectious diseases, signal transduction, and signaling molecules and interactions.
Conclusions
This study provides evidence that the consumption of a HFD induces modifications in the composition and functionality of the gut microbiome in rats, which may serve as a potential mechanism underlying the relationship between obesity and the progression of kidney function decline.
Introduction
Globally, obesity is becoming increasingly common, affecting a growing number of adults [Citation1]. At the same time, there has been an annual rise in the occurrence of kidney damage linked to obesity, with approximately one-third of these instances advancing to progressive renal insufficiency and end-stage renal disease (ESRD) [Citation2,Citation3], This condition substantially impacts the overall quality of life of affected individuals. Obesity leads to an increased glomerular filtration rate, permeability, and osmotic pressure in the kidneys, causing glomerular hypertrophy and focal segmental sclerosis. These changes are irreversible. According to a Mendelian study, an elevated body mass index is a significant contributing factor to the development of chronic kidney disease (CKD) [Citation4]. Effective methods to slow the progression of the disease include weight loss achieved through dietary control, bariatric surgery, and the use of renin-angiotensin blockers for treatment [Citation2]. Nevertheless, due to inadequate adherence to the aforementioned therapies and unfavorable side effects, from a clinical standpoint, it is crucial to further investigate the pathogenesis of obesity-associated kidney injury and discover potential targets for treatment.
Obesity can lead to alterations in the gut microbiota, primarily marked by shifts in the proportional representation of the Bacteroidetes and Firmicutes phyla [Citation5]. The imbalance of gut bacteria is also a crucial element in the pathophysiological alterations of CKD [Citation6,Citation7]. For instance, in contrast to the healthy control group, patients with ESRD exhibited a higher proportion of Proteobacteria at the phylum level in their fecal microbiota composition, while the healthy control group had a higher proportion of Euryarchaeota [Citation8]. At the family level, there was a notable decrease in the prevalence of Lactobacillaceae and Trueperaceae within the ESRD group, whereas the prevalence of Enterobacteriaceae showed a gradual increase. Furthermore, the proportions of Lactobacillaceae and Veillonellaceae showed a positive correlation with the estimated glomerular filtration rate (eGFR), while the abundance of Enterobacteriaceae exhibited a negative correlation with eGFR [Citation8]. Mechanistic studies have demonstrated that a high-fat diet (HFD) diminishes the variety of bacteria in the intestines, modifies the integrity of the intestinal epithelial cell membranes, triggers an elevation in intestinal permeability and the translocation of lipopolysaccharide, and encourages alterations in the immune system along with mild systemic inflammation [Citation9]. Nevertheless, the precise mechanism through which obesity affects the gut microbiota and its subsequent effect on the progression of kidney function decline are not yet understood.
In this study, we generated an HFD-induced obesity rat model and investigated the links between the composition of gut bacteria and pathological abnormalities in the kidney tissues using a metagenomics technique. Subsequent functional analyses were further employed to provide insight into the possible mechanisms of intestinal flora disorders in obesity-related renal injury.
Material and methods
Rat model of obesity
Sprague-Dawley (SD) rats have been observed to exhibit a propensity for weight gain when subjected to a high-fat diet, rendering them a commonly employed model for investigating obesity. Consequently, a cohort of 25 male SD rats, aged 3 weeks and sourced from Beijing Vitong Lihua Laboratory Animal Technology Co., Ltd., Beijing, China, was selected for this study. These rats were housed in a pathogen-free rearing room to ensure their health and well-being. The rats had unlimited access to water and food. After one week of adaption, the rats were randomly assigned to two groups: the normal diet (ND) group (n = 10) and HFD group (n = 15). To induce obesity, the HFD group was given a diet containing 45% fat (D12451, Jiangsu Synergetic Pharmaceutical Bioengineering Co., Ltd., Nanjing, China) for 20 weeks, while the ND group served as a control and was provided with a diet containing 10% fat (D12450B, Jiangsu Synergetic Pharmaceutical Bioengineering Co., Ltd.) for the same time. Body weight was measured every two weeks. Lee’s obesity index [Citation10] was calculated by measuring the final weight and naso–anal length after the intervention at week 24. At week 24, blood samples were obtained from the eyes and the rats were euthanized through an intraperitoneal overdose of pentobarbital sodium. To investigate the impact of various dietary interventions on the lipid and glucose levels of the rats, the levels of serum triglyceride, cholesterol, high-density lipoprotein (HDL), low-density lipoprotein (LDL), and glucose were measured after centrifuging the supernatant according to a previously reported method [Citation11].
Estimation of renal injury
Kidney damage induced by the HFD was assessed by measuring the levels of albumin and creatinine in the urine using a previously described method [Citation12]. Subsequently, the ratio of albumin to creatinine in the urine was computed. To thoroughly evaluate the impact of the HFD on the kidney function of rats, the serum samples were analyzed for creatinine and urea nitrogen levels using the Chemray-240 Automated Biochemical Analyzer from Rayto Life and Analytical Sciences Co., Ltd. (China). These levels were then used to calculate the creatine clearance rate (Ccr) using the following equation: Ccr (mL/min) = urinary creatinine (mol/L) × urine per minute (mL/min)/serum creatine (mol/L).
Histological and microscopy analyses
To evaluate the pathological alterations in the renal tissues, the renal tissues were fixed in paraffin, sliced into 5-µm-thick sections, and subjected to haematoxylin-eosin staining (HE) [Citation13]. Subsequently, the sections were observed using transmission electron microscopy (Leica Microsystems Imaging Solutions Ltd., Cambridge, UK). Additionally, Periodic acid-Schiff staining (PAS) was performed and the staining patterns were analyzed under a light microscope to examine the pathological alterations in glomeruli and the connected membrane stroma from various perspectives [Citation14]. Twenty glomerular fields of vision were chosen at random from the kidney, encompassing both the vascular and urinary poles of the glomerulus. The glomerular diameter was determined by measuring the two longest diameters of the glomerulus and calculating the average value [Citation15].
Sequencing and analysis of gut microbiota using metagenomics
The colons of the euthanized rats were removed under aseptic conditions. A sample of the contents of the colon near the right rectum was collected for examination and analysis using metagenomic sequencing. Sequencing of the libraries was performed using an Illumina NovaSeq 6000 instrument, resulting in the production of 150-bp paired-end reads. The FastQ file was processed using Trimmomatic (v 0.36) [Citation16] for sequence trimming and filtering. MEGAHIT (v 1.1.2) [Citation17,Citation18] was utilized for metagenome assembly, and only Scaftigs exceeding a length of 500 bp were retained. Prodigal (v 2.6.3) [Citation19] was utilized to predict the open reading frames of the assembled scaffolds, which were then converted into amino acid sequences. CDHIT (v 4.5.7) was employed to create non-redundant gene sets by clustering the sequences at cutoffs of 95% identity and 90% coverage. Bowtie2 (v 2.2.9) was used to align the clean reads to the non-redundant gene set (at 95% identity), and the abundance of each gene in every sample was calculated. Using the relevant NR Library taxonomy database, the species taxonomy was established and the abundance of each species was computed by considering the abundance of its component genes. Abundance profiles were constructed by conducting statistical analysis on the abundance at every taxonomic level, including domain, kingdom, phylum, class, order, family, genus, and species.
Principal component analysis (PCA) and non-metric multidimensional scaling (NMDS) analysis [Citation20,Citation21] were utilized to assess variations in the composition of gut microbiota among different groups and within the same group. In the NMDS analysis, a stress value smaller than 0.2 indicates a certain level of reliability. The Wilcoxon rank-sum test was utilized to assess the variation in relative abundance among groups at various taxonomic levels, with statistical significance considered at a P-value < 0.05. To display the quantities of the top 12 phyla with notable variations among groups, box plots were created using filtered P-values. Heatmaps were constructed for the top 30 species in the abundance ranking, along with their abundance information for each sample. Clustering was employed at the species level to identify the most prevalent species in the samples.
The Spearman correlation coefficient was calculated to reflect the correlation between species by selecting the top 50 species based on overall abundance and analyzing the dominant species. The combination of linear discriminant analysis (LDA) and effect size measurements (LEfSe) was executed for analysis. Initially, the rank-sum test was employed to identify the dissimilarity between various subgroups. This was followed by evaluating the impact magnitude of the dissimilarity using LDA to accomplish downscaling, resulting in the acquisition of the LDA score. The length of the histogram represents the effect size of the differential function [Citation22].
The sequencing analyses were performed by OE Biotech Co., Ltd. (Shanghai, China). The sequencing data has been deposited in the BioProject database under identification number PRJNA876316.
Statistical analyses
Prism 9 software was used to conduct statistical analysis of the data. A one-sample Kolmogorov-Smirnov test was performed to assess the normality of continuous data. Data that exhibited a normal distribution are presented as mean ± standard deviation, while data that did not follow a normal distribution are presented as median (range). The t-test was used to analyze normally distributed continuous data for intergroup comparisons, while the nonparametric Kruskal–Wallis H test was used to compare non-normally distributed continuous data. A P-value of less than 0.05 was deemed statistically significant.
Results
HFD results in obesity, increased blood glucose levels, and irregular blood lipid levels
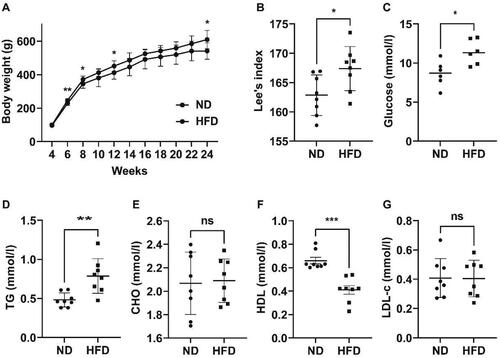
In the present study, it was observed that a notable proportion of rats (8/15) in the HFD group exhibited substantial increases in body weight (Supplementary Table 1). This finding aligns with previous researches [Citation23,Citation24], which has indicated the existence of inter-individual variability in response to HFD among SD rats. Based on the aforementioned observations, a decision was made to specifically choose eight rats with obesity for subsequent analysis. In the ND group, rats with the most extreme body weights, both highest and lowest, were excluded, resulting in a final count of eight rats for further investigation. As depicted in , throughout the 20-week feeding intervention, the rats in both groups experienced a gradual increase in their body weight. Nevertheless, the rats in the HFD group consistently exhibited a greater body weight compared to the rats in the ND group, indicating a significant disparity at the end of the intervention ([609.6(525.5, 687.0)g] vs [540.9(476.2, 584.0)]g, p = 0.02). Lee’s index exhibited a significantly greater value in the HFD group compared to the ND group (167.4 ± 3.754 vs 162.9 ± 3.451, p = 0.02; ). This demonstrated the successful establishment of the obesity model induced by the HFD. As depicted in , at 24 weeks, the blood glucose level of rats in the HFD group was considerably greater than that of rats in the ND group (11.41 ± 1.577 mmol/l vs 8.635 ± 1.629 mmol/l, p = 0.01). The levels of triglycerides in the rats of the HFD group showed a significant increase compared with those of the ND group (0.79 ± 0.22 mmol/l vs 0.48 ± 0.09 mmol/l, p < 0.01, ). The HDL level was significantly lower than that of the ND group ([0.41(0.23, 0.54) mmol/l] vs [0.66(0.60, 0.81)] mmol/l, p < 0.001; ). No notable disparities were observed in the levels of total cholesterol () and LDL-c () between the two groups.
Figure 1. Obesity and disturbances in blood glucose and lipids were observed in rats that were fed a high-fat diet. (A) Variations in body weight between the two groups. (B) Lee’s index in the two groups of rats at week 24. (C) Levels of glucose in the blood of the two groups. (D–G) Levels of triglyceride (TG), cholesterol (CHO), high-density lipoprotein (HDL), and low-density lipoprotein cholesterol (LDL-c) in both groups of rats. ND refers to a normal diet, while HFD stands for high-fat diet. * p < 0.05,** p < 0.01,*** p < 0.001; n = 6–8 per group.
HFD leads to impaired kidney function
At 24 weeks, the HFD and ND group exhibited no significant difference in kidney weight and urinary albumin-to-creatinine ratio (). Conversely, the HFD group demonstrated a significantly diminished ratio of kidney weight to body weight in comparison to the ND group, as the kidney weight was divided by the higher body weight observed in the HDF group. Furthermore, the HFD group exhibited markedly elevated levels of serum creatinine and urea nitrogen compared to those of the ND group. Although the Ccr of the HFD group exhibited a declining pattern in comparison to the ND group, the observed distinction did not reach statistical significance (p = 0.60).
Table 1. Impact of a diet high in fat on kidney function in rats.
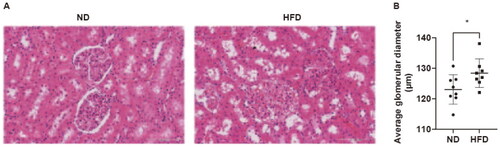
Pathological alterations in the kidney tissue of the HFD group were observed through HE staining, which encompassed glomerular sclerosis, adherence of Bowman’s capsule, hyaline degeneration, and vacuolar degeneration in the renal tubules (). PAS staining revealed a notable augmentation in the relative size of glomeruli in the HFD group when compared to the ND group (128.4 ± 4.68 μm vs 123.1 ± 4.82 μm, p = 0.04) ().
Figure 2. Pathological alterations in the kidneys of rats induced by a high-fat diet. (A) Representative images of HE staining of renal tissues (magnification = 30×, scale bar = 100 μm). (B) The sizes of the glomeruli in the two groups of rats. ND, normal diet; HFD, high-fat diet. Data are displayed as the mean ± SD. * p < 0.05 vs. the ND group; n = 8 per group.
Analysis of microbial populations in the intestines using metagenomics
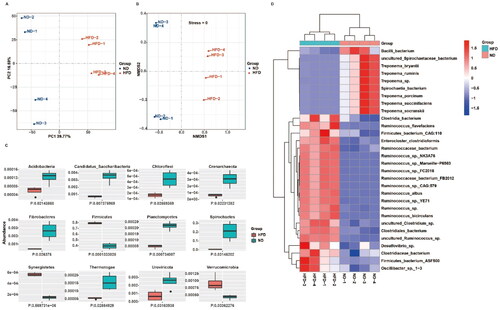
PCA () and NMDS analysis () showed that the two groups of rats exhibited notable variations in the species-level composition of intestinal microbial populations, as indicated by a stress value of 0 in the NMDS analysis. displays the Acidobacteria, Candidatus Saccharibacteria, Chloroflexi, Crenarchaeota, Fibrocacteres, Firmicutes, Planctomycetes, Spirochetes, Synergistetes, Thermotogae, Uroviricota, and Verrucomicrobia as the top 12 phyla exhibiting differential abundance between groups. The heatmap displayed in indicates a statistically significant increase in the prevalence of Ruminococcus spp. at the species level within the HFD group compared to the ND group. Specifically, 12 out of the top 21 species identified were found to be Ruminococcus spp. In contrast to the HFD group, the abundance of Treponema spp. showed a notable rise within the ND group.
Figure 3. A high-fat diet induces significant alterations in the abundance of intestinal microbial populations in rats. (A, B) Comparison of intestinal microbial populations in the two groups of rats at the species level based on principal component analysis and non-metric multidimensional scaling analysis. (C) Variations in the abundance of the top 12 phyla of intestinal microbial populations in the two groups. (D) Heatmap to visualize the species that exhibit differential expression in the intestinal microbial populations of the two groups of rats; n = 4 per group.
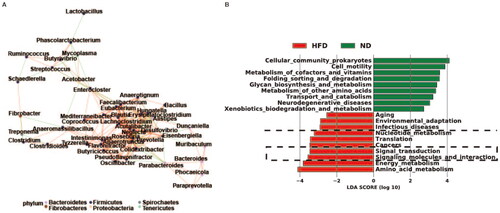
The network of species correlations indicated that the phylum Firmicutes, which includes the genus Ruminococcus, played a significant role in the correlation among species and the distinct abundance variation between groups (). The LEfSe analysis also indicated that the microbiota composition in the HFD group was significantly associated with infectious diseases, signal transduction, signaling molecules and interaction, which were among the top 10 differentially expressed functions (, indicated by the black dashed line).
Figure 4. Interactions and functions of gut bacterial communities in obese rats. (A) Correlation network between bacterial species exhibiting varying abundance in the guts of the ND and HFD groups. (B) Linear discriminant analysis coupled with effect size measurement analysis shows the top 10 functions of differentially abundant bacterial species in the intestines of the two groups of rats. ND, normal diet; HFD, high-fat diet; n = 4 per group.
Discussion
The role of diet is vital in the development of obesity, diabetes, and allergies, and a HFD is frequently employed to induce obesity in animal models [Citation15,Citation25,Citation26]. After a 20-week intervention with a HFD, we observed that rats became obese and experienced a notable increase in both lipid and blood glucose levels, in agreement with previous studies [Citation27]. Additionally, rats in the HFD group exhibited increased levels of creatinine and urea nitrogen in their peripheral blood. These changes were accompanied by pathological alterations, including glomerular hypertrophy, partial glomerular crumpling, and tubular vacuolar degeneration. These findings indicate that a prolonged HFD can lead to kidney function decline.
Furthermore, metagenomic-sequencing analysis revealed that the guts of rats showed a significant increase in the prevalence of Ruminococcus after being fed an HFD for 20 weeks. Additionally, functional analysis indicated that the phylum Firmicutes, which includes Ruminococcus, played a vital role in the observed distinctions between the HFD and ND groups. A meta-analysis of clinical studies revealed a notable rise in the prevalence of Firmicutes in the gastrointestinal microbiota of obese adults when compared to those who were in good health [Citation28]. In particular, most of the leading 21 species that showed significant upregulation in the HFD group compared to the ND group were from the Firmicutes phylum. This group comprised 12 Ruminococcus species and five Clostridium species. Ruminococcus, one of the first bacteria identified in the stomach, has a crucial function in digestion and the stimulation of inflammatory reactions. Numerous studies have indicated a strong correlation between the prevalence of Ruminococcus and the onset and progression of diseases linked to inflammation [Citation29–32]. Our functional analysis also indicated that the bacteria with significantly increased abundance in the HFD group mainly contribute to diseases associated with inflammation.
Further functional analysis demonstrated that the gut microbiota, which exhibited notable upregulation in the HFD group, showed enrichment in activities related to signal transduction and interaction with signaling molecules. Previous research indicated a notable rise in the peripheral plasma of obese mice regarding proinflammatory cytokines such as tumor necrosis factor-alpha (TNF-α), interleukin (IL)-1β, IL-6, and IL-18 [Citation33]. Szeto et al. [Citation26] observed that mice with obesity displayed elevated levels of macrophage infiltration in their kidney tissues, concurrently; there was a notable increase in the expression of proinflammatory cytokines such as TNF-α, monocyte chemotactic protein-1, nuclear transcription factor-kappa B, and the fibrotic cytokine transforming growth factor-beta. Likewise, in studies involving humans, kidney biopsy samples from patients with obesity have shown elevated levels of TNF-α and its receptors, IL-6 signal transducers, and interferon-gamma [Citation34]. In addition, in an experimental mouse model of diet-induced obesity, elevated levels of the gut microbiota-derived metabolite trimethylamine N-oxide (TMAO) has been shown to exacerbate renal interstitial fibrosis and dysfunction by augmenting oxidative stress and inflammation within the kidneys [Citation35]. By modifying the imbalanced gut–kidney connection, fecal microbiota transplantation has demonstrated an impact on the occurrence and progression of CKD [Citation36]. Our study provides data to support the dysbiosis of gut microbiota and potential intervention targets in obesity-related kidney injury. Further research and confirmation are needed to investigate the specific mechanisms by which changes in gut microbiota contribute to obesity-related renal injury and the resulting inflammatory responses in the kidneys.
Our study has certain limitations that should be acknowledged. We were not able to confirm the differential abundance of the microbial communities identified in the rat model in patients with kidney injury related to obesity. Furthermore, despite our observations of the disparities, it is imperative to conduct a more thorough examination of the cause-and-effect connection between these microorganism populations and the disease. Such endeavors will contribute to gaining a more comprehensive understanding and elucidation of the intricate relationship between microbial communities and obesity-related kidney disease.
To summarize, metagenomics analysis offered profound understanding of the connection between kidney function decline and an imbalanced gut microbiota in rats fed an HFD. The findings emphasize the important contribution of Ruminococcus, a member of the phylum Firmicutes. Functional analysis demonstrated that the majority of the gut bacterial species with differential abundance in obesity rats primarily participate in infectious diseases, signal transduction, signaling molecules and interactions. Hence, further investigation is required to clarify the precise mechanisms through which these bacterial strains engage with systemic or local inflammatory reactions and contribute to kidney function decline.
Statements and declarations
We hereby declare the originality and truthfulness of our research and its findings. We confirm the authenticity and reliability of all the data, results, analyses, and conclusions presented in this study, ensuring they have not been plagiarized or falsified.
Author contributions
The study was conceived and designed by ZYL and AA, who also provided support for resources. GLJ performed the experiments with the animal model. AA performed the bioinformatics analysis, carried out the statistical analyses, and wrote the initial draft of the manuscript. ZYL participated in the development of the research and revised the document. The final manuscript was read and approved by all authors.
Ethics approval
The Xi’an Jiao Tong University Committee for the Ethics of Animal Experiments (permission number 2021-674) oversaw and approved all animal feeding and experimental procedures conducted.
Data, material, or code availability
The metagenomic sequencing data has been submitted to BioProject (BioProject ID: PRJNA876316).
Supplemental Material
Download MS Excel (11 KB)Acknowledgement
We are grateful to the services provided by OE Biotech Co., Ltd. (Shanghai, China) for the metagenome sequencing and analysis, and we extend our thanks to Editage for their assistance with English-language editing.
Disclosure statement
The authors declare not conflicts of interests that are pertinent to the subject matter of this publication.
References
- Jaacks LM, Vandevijvere S, Pan A, et al. The obesity transition: stages of the global epidemic. Lancet Diabetes Endocrinol. 2019;7(3):1–8. doi:10.1016/S2213-8587(19)30026-9.
- D'Agati VD, Chagnac A, de Vries APJ, et al. Obesity-related glomerulopathy: clinical and pathologic characteristics and pathogenesis. Nat Rev Nephrol. 2016;12(8):453–471. doi:10.1038/nrneph.2016.75.
- Shi Y, Wang C, Zhou X, et al. Downregulation of PTEN promotes podocyte endocytosis of lipids aggravating obesity-related glomerulopathy. Am J Physiol Renal Physiol. 2020;318(3):F589–F599. doi:10.1152/ajprenal.00392.2019.
- Kjaergaard AD, Teumer A, Witte DR, et al. Obesity and kidney function: a two-sample Mendelian randomization study. Clin Chem. 2022;68(3):461–472. doi:10.1093/clinchem/hvab249.
- Nallu A, Sharma S, Ramezani A, et al. Gut microbiome in chronic kidney disease: challenges and opportunities. Transl Res. 2017;179:24–37. doi:10.1016/j.trsl.2016.04.007.
- Hu X, Ouyang S, Xie Y, et al. Characterizing the gut microbiota in patients with chronic kidney disease. Postgrad Med. 2020;132(6):495–505. doi:10.1080/00325481.2020.1744335.
- Sampaio-Maia B, Simões-Silva L, Pestana M, et al. The role of the gut microbiome on chronic kidney disease. Adv Appl Microbiol. 2016;96:65–94.
- Wang H, Ainiwaer A, Song Y, et al. Perturbed gut microbiome and fecal and serum metabolomes are associated with chronic kidney disease severity. Microbiome. 2023;11(1):3. doi:10.1186/s40168-022-01443-4.
- Netto Candido TL, Bressan J, Alfenas RCG. Dysbiosis and metabolic endotoxemia induced by high-fat diet. Nutr Hosp. 2018;35(6):1432–1440. doi:10.20960/nh.1792.
- Wang X-X, Ye T, Li M, et al. Effects of octreotide on hepatic glycogenesis in rats with high fat diet‑induced obesity. Mol Med Rep. 2017;16(1):109–118. doi:10.3892/mmr.2017.6586.
- Liu Y, Zong S, Li J. Attenuation effects of bulk and nanosized ZnO on glucose, lipid level, and inflammation profile in obese mice. Appl Biochem Biotechnol. 2020;190(2):475–486. doi:10.1007/s12010-019-03115-w.
- Cui D, Liu S, Tang M, et al. Phloretin ameliorates hyperuricemia-induced chronic renal dysfunction through inhibiting NLRP3 inflammasome and uric acid reabsorption. Phytomedicine. 2020;66:153111. doi:10.1016/j.phymed.2019.153111.
- Qi M-Y, He Y-H, Cheng Y, et al. Icariin ameliorates streptozocin-induced diabetic nephropathy through suppressing the TLR4/NF-kappaB signal pathway. Food Funct. 2021;12(3):1241–1251. doi:10.1039/d0fo02335c.
- Liu B-L, Chen Y-P, Cheng H, et al. The protective effects of curcumin on obesity-related glomerulopathy are associated with inhibition of wnt/beta-Catenin signaling activation in podocytes. Evid Based Complement Alternat Med. 2015;2015:827472–827412.
- Zhao J, Rui H-L, Yang M, et al. CD36-Mediated lipid accumulation and activation of NLRP3 inflammasome lead to podocyte injury in obesity-related glomerulopathy. Mediators Inflamm. 2019;2019:8247280. doi:10.1155/2019/8247280.
- Bolger AM, Lohse M, Usadel B. Trimmomatic: a flexible trimmer for illumina sequence data. Bioinformatics. 2014;30(15):2114–2120. doi:10.1093/bioinformatics/btu170.
- Li D, Liu C-M, Luo R, et al. MEGAHIT: an ultra-fast single-node solution for large and complex metagenomics assembly via succinct de Bruijn graph. Bioinformatics. 2015;31(10):1674–1676. doi:10.1093/bioinformatics/btv033.
- Li D, Luo R, Liu C-M, et al. MEGAHIT v1.0: a fast and scalable metagenome assembler driven by advanced methodologies and community practices. Methods. 2016;102:3–11. doi:10.1016/j.ymeth.2016.02.020.
- Hyatt D, Chen G-L, Locascio PF, et al. Prodigal: prokaryotic gene recognition and translation initiation site identification. BMC Bioinf. 2010;11(1):119. doi:10.1186/1471-2105-11-119.
- Avershina E, Frisli T, Rudi K. De novo semi-alignment of 16S rRNA gene sequences for deep phylogenetic characterization of next generation sequencing data. Microbes Environ. 2013;28(2):211–216. doi:10.1264/jsme2.me12157.
- Noval Rivas M, Burton OT, Wise P, et al. A microbiota signature associated with experimental food allergy promotes allergic sensitization and anaphylaxis. J Allergy Clin Immunol. 2013;131(1):201–212. doi:10.1016/j.jaci.2012.10.026.
- Segata N, Izard J, Waldron L, et al. Metagenomic biomarker discovery and explanation. Genome Biol. 2011;12(6):R60. doi:10.1186/gb-2011-12-6-r60.
- Levin BE, Dunn-Meynell AA, Balkan B, et al. Selective breeding for diet-induced obesity and resistance in Sprague-Dawley rats. Am J Physiol. 1997;273(2 Pt 2):R725–R730. doi:10.1152/ajpregu.1997.273.2.R725.
- Farley C, Cook JA, Spar BD, et al. Meal pattern analysis of diet-induced obesity in susceptible and resistant rats. Obes Res. 2003;11(7):845–851. doi:10.1038/oby.2003.116.
- Gut K. Broad-band difference interferometer as a refractive index sensor. Opt Exp. 2017;25(25):31111–31121. doi:10.1364/OE.25.031111.
- Szeto HH, Liu S, Soong Y, et al. Protection of mitochondria prevents high-fat diet-induced glomerulopathy and proximal tubular injury. Kidney Int. 2016;90(5):997–1011. doi:10.1016/j.kint.2016.06.013.
- Zhang X-L, Chen L, Yang J, et al. Vitamin D alleviates non-alcoholic fatty liver disease via restoring gut microbiota and metabolism. Front Microbiol. 2023;14:1117644. doi:10.3389/fmicb.2023.1117644.
- Pinart M, Dötsch A, Schlicht K, et al. Gut microbiome composition in obese and non-obese persons: a systematic review and meta-analysis. Nutrients. 2021;14(1):12. doi:10.3390/nu14010012.
- Breban M, Tap J, Leboime A, et al. Faecal microbiota study reveals specific dysbiosis in spondyloarthritis. Ann Rheum Dis. 2017;76(9):1614–1622. doi:10.1136/annrheumdis-2016-211064.
- Azzouz D, Omarbekova A, Heguy A, et al. Lupus nephritis is linked to disease-activity associated expansions and immunity to a gut commensal. Ann Rheum Dis. 2019;78(7):947–956. doi:10.1136/annrheumdis-2018-214856.
- Henke MT, Kenny DJ, Cassilly CD, et al. Ruminococcus gnavus, a member of the human gut microbiome associated with crohn’s disease, produces an inflammatory polysaccharide. Proc Natl Acad Sci USA. 2019;116(26):12672–12677. doi:10.1073/pnas.1904099116.
- Jaagura M, Viiard E, Karu-Lavits K, et al. Low-carbohydrate high-fat weight reduction diet induces changes in human gut microbiota. Microbiologyopen. 2021;10(3):e1194. doi:10.1002/mbo3.1194.
- Ren Y, Wang D, Lu F, et al. Coptidis rhizoma inhibits NLRP3 inflammasome activation and alleviates renal damage in early obesity-related glomerulopathy. Phytomedicine. 2018;49:52–65. doi:10.1016/j.phymed.2018.05.019.
- Wu Y, Liu Z, Xiang Z, et al. Obesity-related glomerulopathy: insights from gene expression profiles of the glomeruli derived from renal biopsy samples. Endocrinology. 2006;147(1):44–50. doi:10.1210/en.2005-0641.
- Sun G, Yin Z, Liu N, et al. Gut microbial metabolite TMAO contributes to renal dysfunction in a mouse model of diet-induced obesity. Biochem Biophys Res Commun. 2017;493(2):964–970. doi:10.1016/j.bbrc.2017.09.108.
- Bian J, Liebert A, Bicknell B, et al. Faecal microbiota transplantation and chronic kidney disease. Nutrients. 2022;14(12):2528. doi:10.3390/nu14122528.